> ## Documentation Index
> Fetch the complete documentation index at: https://notes.kodekloud.com/llms.txt
> Use this file to discover all available pages before exploring further.
# Monitoring and Debugging
> Guide to monitoring and debugging AI agents by logging every step, tracking key metrics, streaming events, and enforcing PII protection for observability and incident resolution.
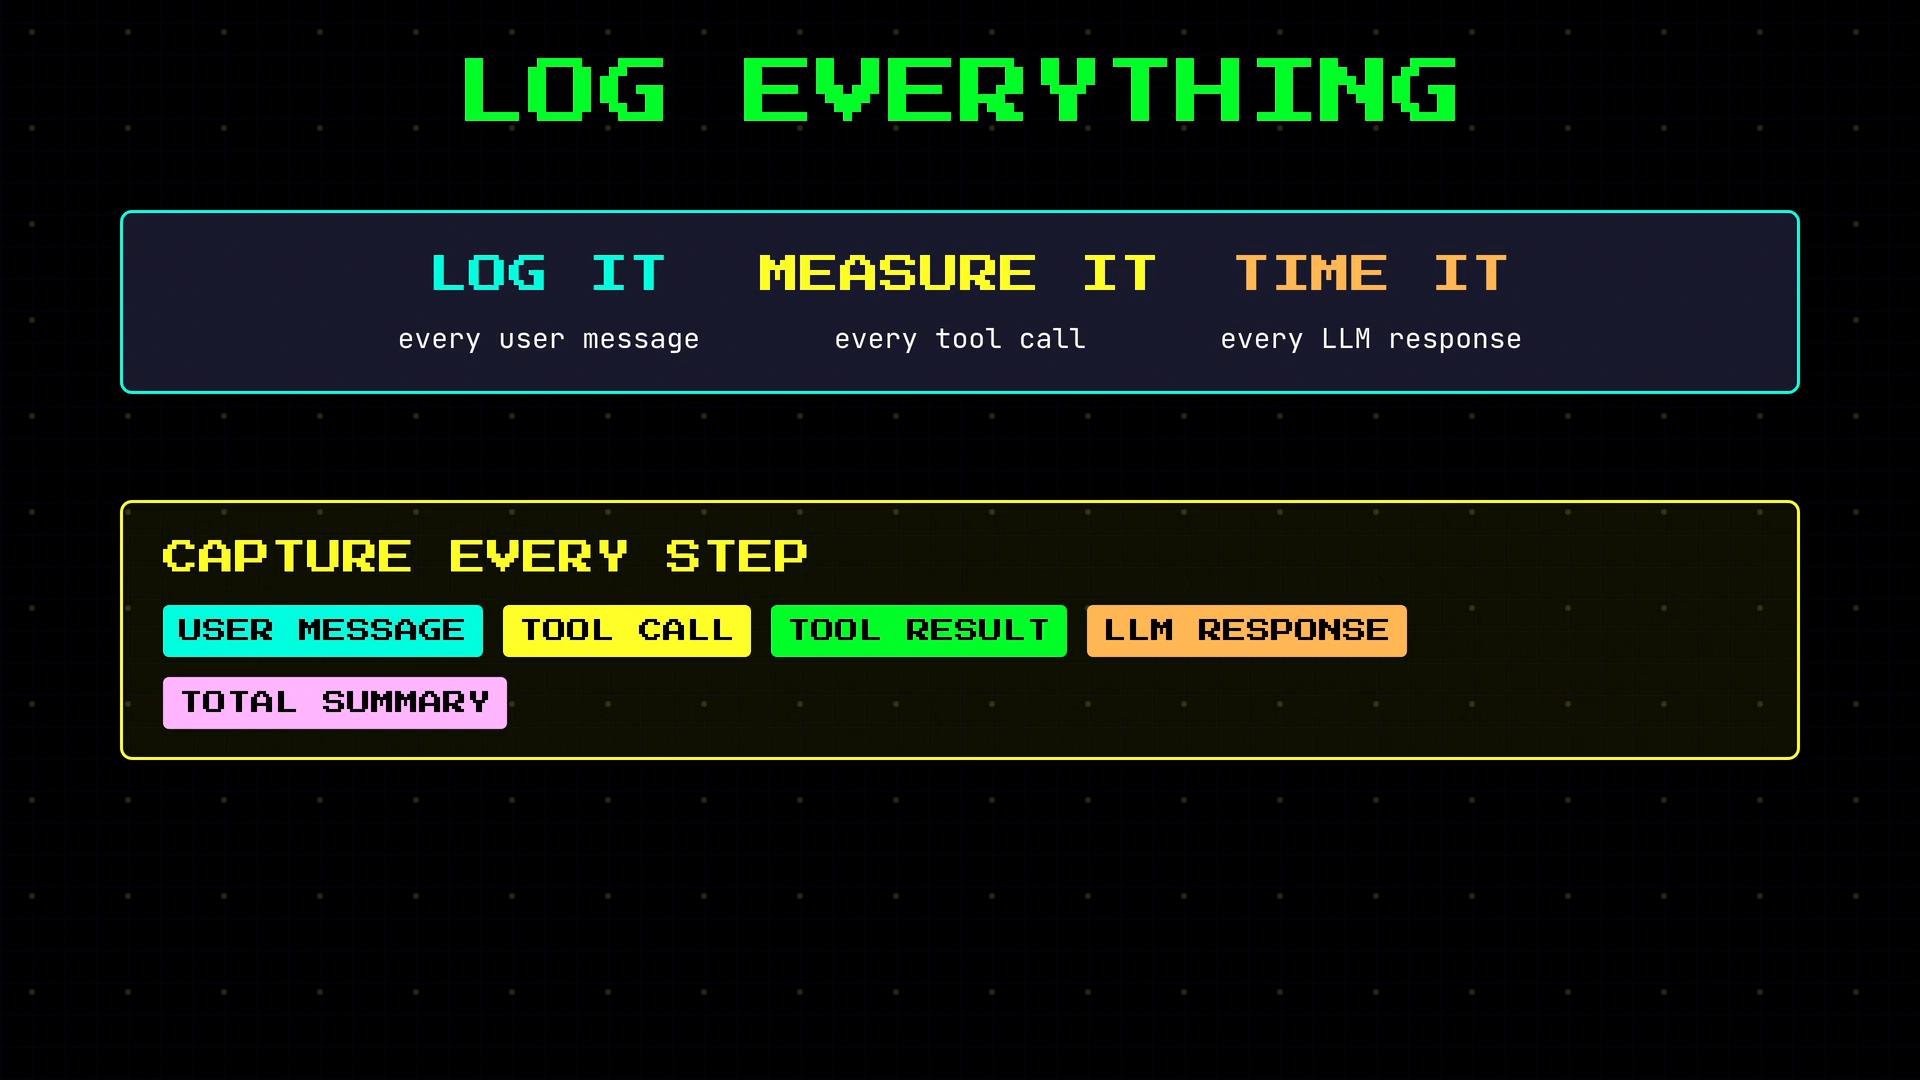
When an agent misbehaves in production, diagnosing the cause is different from debugging a traditional application. You can't pause a language model mid-thought with a breakpoint. Instead, you must build observability: log every step, measure the right metrics, and capture precise timing. The goal is simple: know what the agent did, what each tool returned, and how long each step took.
* Log incoming user messages.
* Log model decisions to call tools, including tool name and arguments.
* Log tool results and token counts.
* Log the model's final response.
* At request completion, log totals: elapsed time, total tokens, tool call counts.
 ## Example: fully logged flight booking request
* 12:01:00 — User: "Book me a flight to NYC next Friday under \$300"
* The model selects `Search Flights` (with date and price cap).
* 12:01:01 — Tool call: `search_flights`
* 12:01:02 — Tool result: 4 flights found (1,200 tokens)
* 12:01:02 — Tool call: `check_calendar`
* 12:01:03 — Tool result: calendar loaded (800 tokens)
* 12:01:04 — Final model text response
* Total: 3 LLM calls, 2 tool calls, 2,200 tokens, 4.0s
The corresponding log trace:
```text theme={null}
agent.log
[12:01:00] User: "Book me a flight to NYC next Friday under $300"
[12:01:00] Model: claude-sonnet-4-20250514 Tools: [search_flights, check_calendar, book_flight]
[12:01:01] LLM → tool_call → search_flights(dest="NYC", date="2026-03-13", max_price=300)
[12:01:02] Result: 4 flights found (1,200 tokens)
[12:01:02] LLM → tool_call → check_calendar(date="2026-03-13")
[12:01:03] Result: calendar loaded (800 tokens)
[12:01:04] LLM → text → "I found a $280 flight at 2:30pm..."
[12:01:04] Total: 3 LLM calls 2 tool calls 2,200 tokens 4.0s
```
That trace shows exactly what happened. If the answer is wrong, inspect the tool results. If the request is slow, see which step consumed the most time.
Log everything, but avoid storing sensitive user data in plain text. Implement redaction, anonymization, or tokenization for personally identifiable information (PII) before long-term storage.
## Key metrics to capture for every request
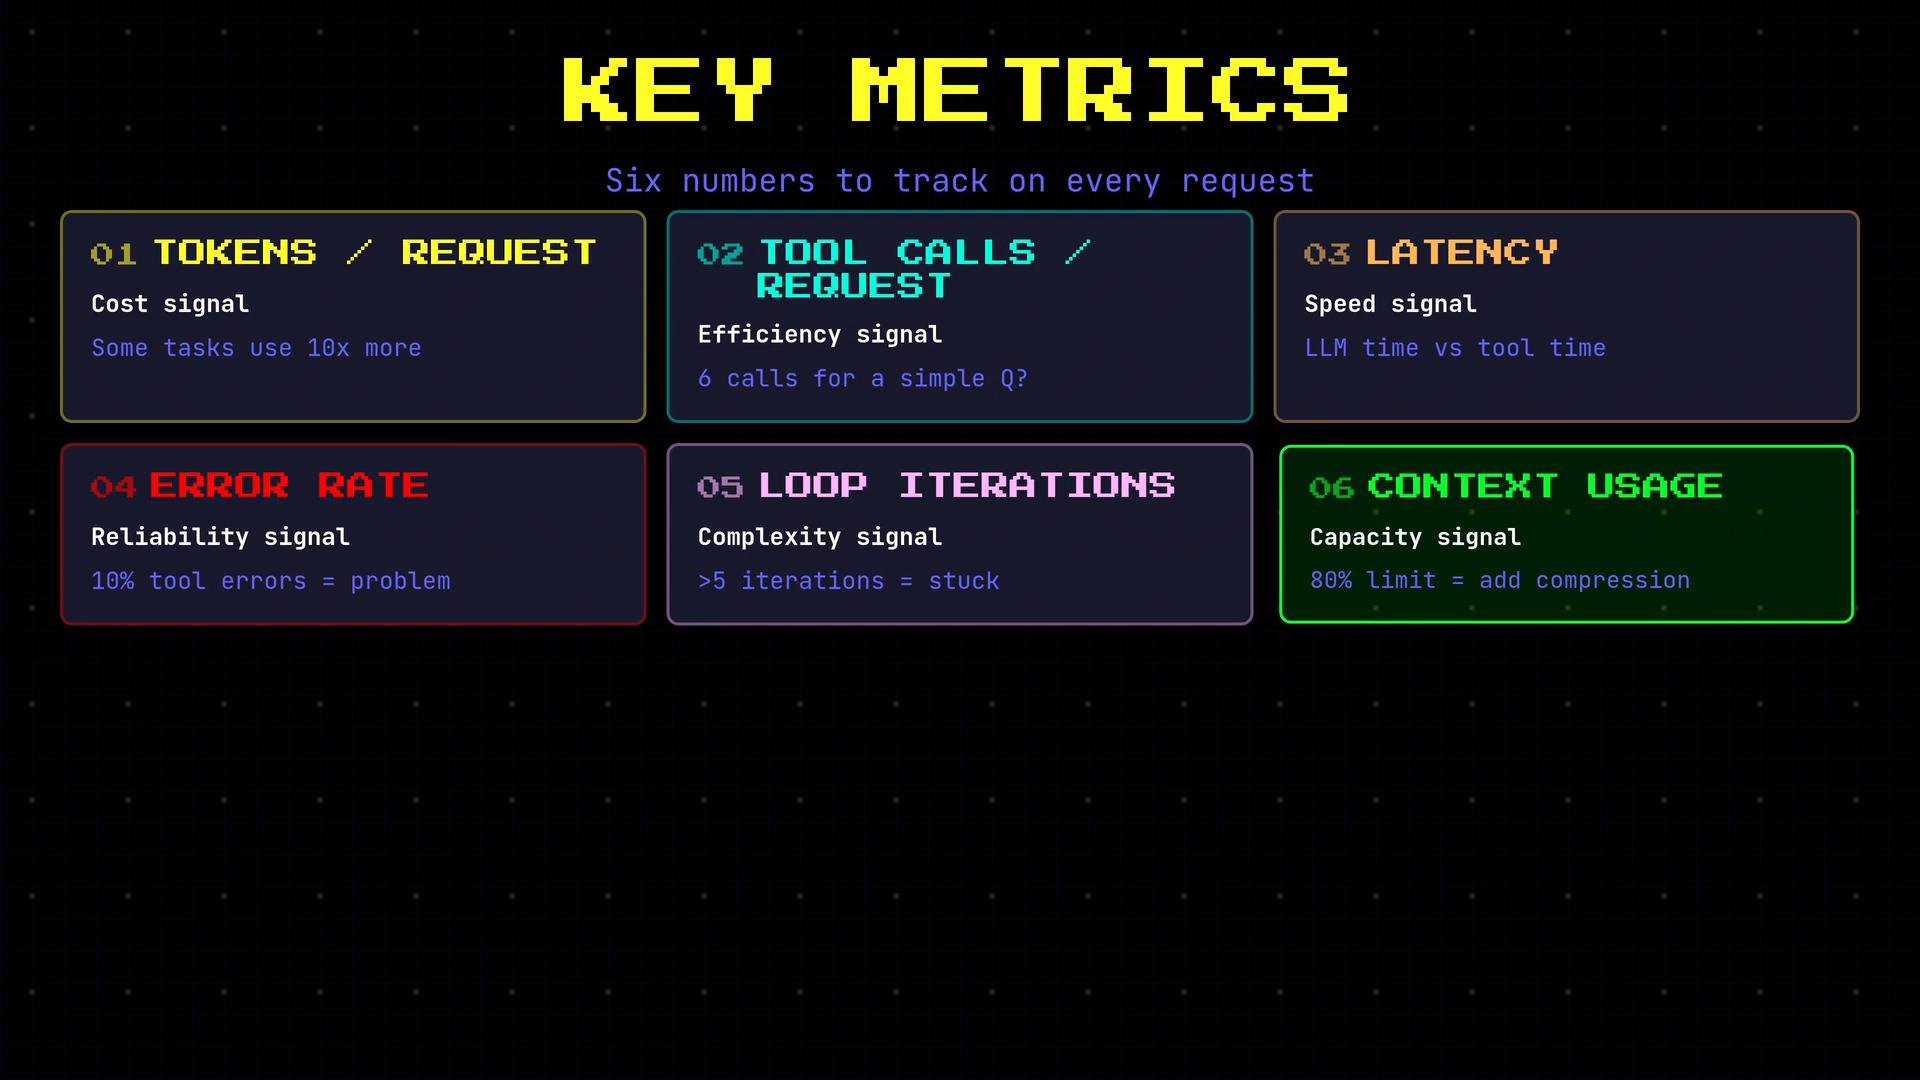
Track these six metrics consistently. They help you spot regressions, prevent runaway costs, and identify reliability problems.
| Metric | Why it matters | How to measure |
| - | -: | - |
| Tokens per request | Primary cost signal. Spikes mean higher API costs or inefficient prompts. | Sum tokens consumed by LLM & tools per request. |
| Tool calls per request | High counts can indicate inefficient chains or looping. | Count unique tool invocations per session/turn. |
| Latency | End-to-end time; split into LLM time and tool execution time to find bottlenecks. | Measure wall-clock time per LLM call and per tool call. |
| Error rate | Tool or API failures degrade UX and loop behavior. | % of failed tool calls / total tool calls. |
| Loop iterations | Excessive loops indicate the model isn't progressing. | Count agent loop iterations per request. |
| Context window usage | Hitting the context limit causes truncation or degraded reasoning. | Track tokens in history vs. model context window (e.g., % of limit). |
## Example: fully logged flight booking request
* 12:01:00 — User: "Book me a flight to NYC next Friday under \$300"
* The model selects `Search Flights` (with date and price cap).
* 12:01:01 — Tool call: `search_flights`
* 12:01:02 — Tool result: 4 flights found (1,200 tokens)
* 12:01:02 — Tool call: `check_calendar`
* 12:01:03 — Tool result: calendar loaded (800 tokens)
* 12:01:04 — Final model text response
* Total: 3 LLM calls, 2 tool calls, 2,200 tokens, 4.0s
The corresponding log trace:
```text theme={null}
agent.log
[12:01:00] User: "Book me a flight to NYC next Friday under $300"
[12:01:00] Model: claude-sonnet-4-20250514 Tools: [search_flights, check_calendar, book_flight]
[12:01:01] LLM → tool_call → search_flights(dest="NYC", date="2026-03-13", max_price=300)
[12:01:02] Result: 4 flights found (1,200 tokens)
[12:01:02] LLM → tool_call → check_calendar(date="2026-03-13")
[12:01:03] Result: calendar loaded (800 tokens)
[12:01:04] LLM → text → "I found a $280 flight at 2:30pm..."
[12:01:04] Total: 3 LLM calls 2 tool calls 2,200 tokens 4.0s
```
That trace shows exactly what happened. If the answer is wrong, inspect the tool results. If the request is slow, see which step consumed the most time.
Log everything, but avoid storing sensitive user data in plain text. Implement redaction, anonymization, or tokenization for personally identifiable information (PII) before long-term storage.
## Key metrics to capture for every request
Track these six metrics consistently. They help you spot regressions, prevent runaway costs, and identify reliability problems.
| Metric | Why it matters | How to measure |
| - | -: | - |
| Tokens per request | Primary cost signal. Spikes mean higher API costs or inefficient prompts. | Sum tokens consumed by LLM & tools per request. |
| Tool calls per request | High counts can indicate inefficient chains or looping. | Count unique tool invocations per session/turn. |
| Latency | End-to-end time; split into LLM time and tool execution time to find bottlenecks. | Measure wall-clock time per LLM call and per tool call. |
| Error rate | Tool or API failures degrade UX and loop behavior. | % of failed tool calls / total tool calls. |
| Loop iterations | Excessive loops indicate the model isn't progressing. | Count agent loop iterations per request. |
| Context window usage | Hitting the context limit causes truncation or degraded reasoning. | Track tokens in history vs. model context window (e.g., % of limit). |
 ## Common failure modes and debugging steps
* Agent returns wrong answers
* Inspect logs for tool results and timestamps. Often the reasoning is correct but the data is stale or erroneous. Fix the tool or data source rather than the model.
* Agent calls the wrong tool
* Make tool descriptions explicit. If two tools look similar to the model (e.g., "Search Web" vs "Search Flights"), clarify usage conditions in the tool description and system prompt.
* Agent loops without progress
* Usually the model cannot interpret a tool's output. Improve the result format (structured JSON, clear keys), add instructions on how to handle that output, or include success/failure flags in tool responses.
* Responses are too slow
* Break down latency into LLM vs. external API time. Large context windows increase LLM latency; slow third-party APIs increase tool latency. Optimize by compressing context and caching tool results.
* Context window overflow
* Summarize or compress old turns, cap included history, or implement retrieval strategies to avoid reaching \~80% of the model’s context limit.
## Real-time event streaming and observability (OpenClaw)
OpenClaw streams agent events in real time via a Pub/Sub event system: text generation, tool calls, tool results, errors, retries, and context compression are emitted as events. Streaming these events enables:
* Live debugging and replay of agent behavior.
* Building progress indicators and structured UIs that reflect each step.
* Postmortem analysis and searchable transcripts.
Subscribe to agent events (example):
```javascript theme={null}
// Subscribe to agent events via pi-embedded-subscribe
const events = await client.piEmbeddedSubscribe({ sessionId });
for await (const event of events) {
switch (event.type) {
case "text_generation":
stream(event.text);
break;
case "tool_call":
log(event.name, event.args);
break;
case "tool_result":
log(event.result, event.tokens);
break;
case "error":
alert(event.message);
break;
case "context_compression":
log("compressing...");
break;
}
}
```
## Common failure modes and debugging steps
* Agent returns wrong answers
* Inspect logs for tool results and timestamps. Often the reasoning is correct but the data is stale or erroneous. Fix the tool or data source rather than the model.
* Agent calls the wrong tool
* Make tool descriptions explicit. If two tools look similar to the model (e.g., "Search Web" vs "Search Flights"), clarify usage conditions in the tool description and system prompt.
* Agent loops without progress
* Usually the model cannot interpret a tool's output. Improve the result format (structured JSON, clear keys), add instructions on how to handle that output, or include success/failure flags in tool responses.
* Responses are too slow
* Break down latency into LLM vs. external API time. Large context windows increase LLM latency; slow third-party APIs increase tool latency. Optimize by compressing context and caching tool results.
* Context window overflow
* Summarize or compress old turns, cap included history, or implement retrieval strategies to avoid reaching \~80% of the model’s context limit.
## Real-time event streaming and observability (OpenClaw)
OpenClaw streams agent events in real time via a Pub/Sub event system: text generation, tool calls, tool results, errors, retries, and context compression are emitted as events. Streaming these events enables:
* Live debugging and replay of agent behavior.
* Building progress indicators and structured UIs that reflect each step.
* Postmortem analysis and searchable transcripts.
Subscribe to agent events (example):
```javascript theme={null}
// Subscribe to agent events via pi-embedded-subscribe
const events = await client.piEmbeddedSubscribe({ sessionId });
for await (const event of events) {
switch (event.type) {
case "text_generation":
stream(event.text);
break;
case "tool_call":
log(event.name, event.args);
break;
case "tool_result":
log(event.result, event.tokens);
break;
case "error":
alert(event.message);
break;
case "context_compression":
log("compressing...");
break;
}
}
```
 ## The debugging mindset for agents
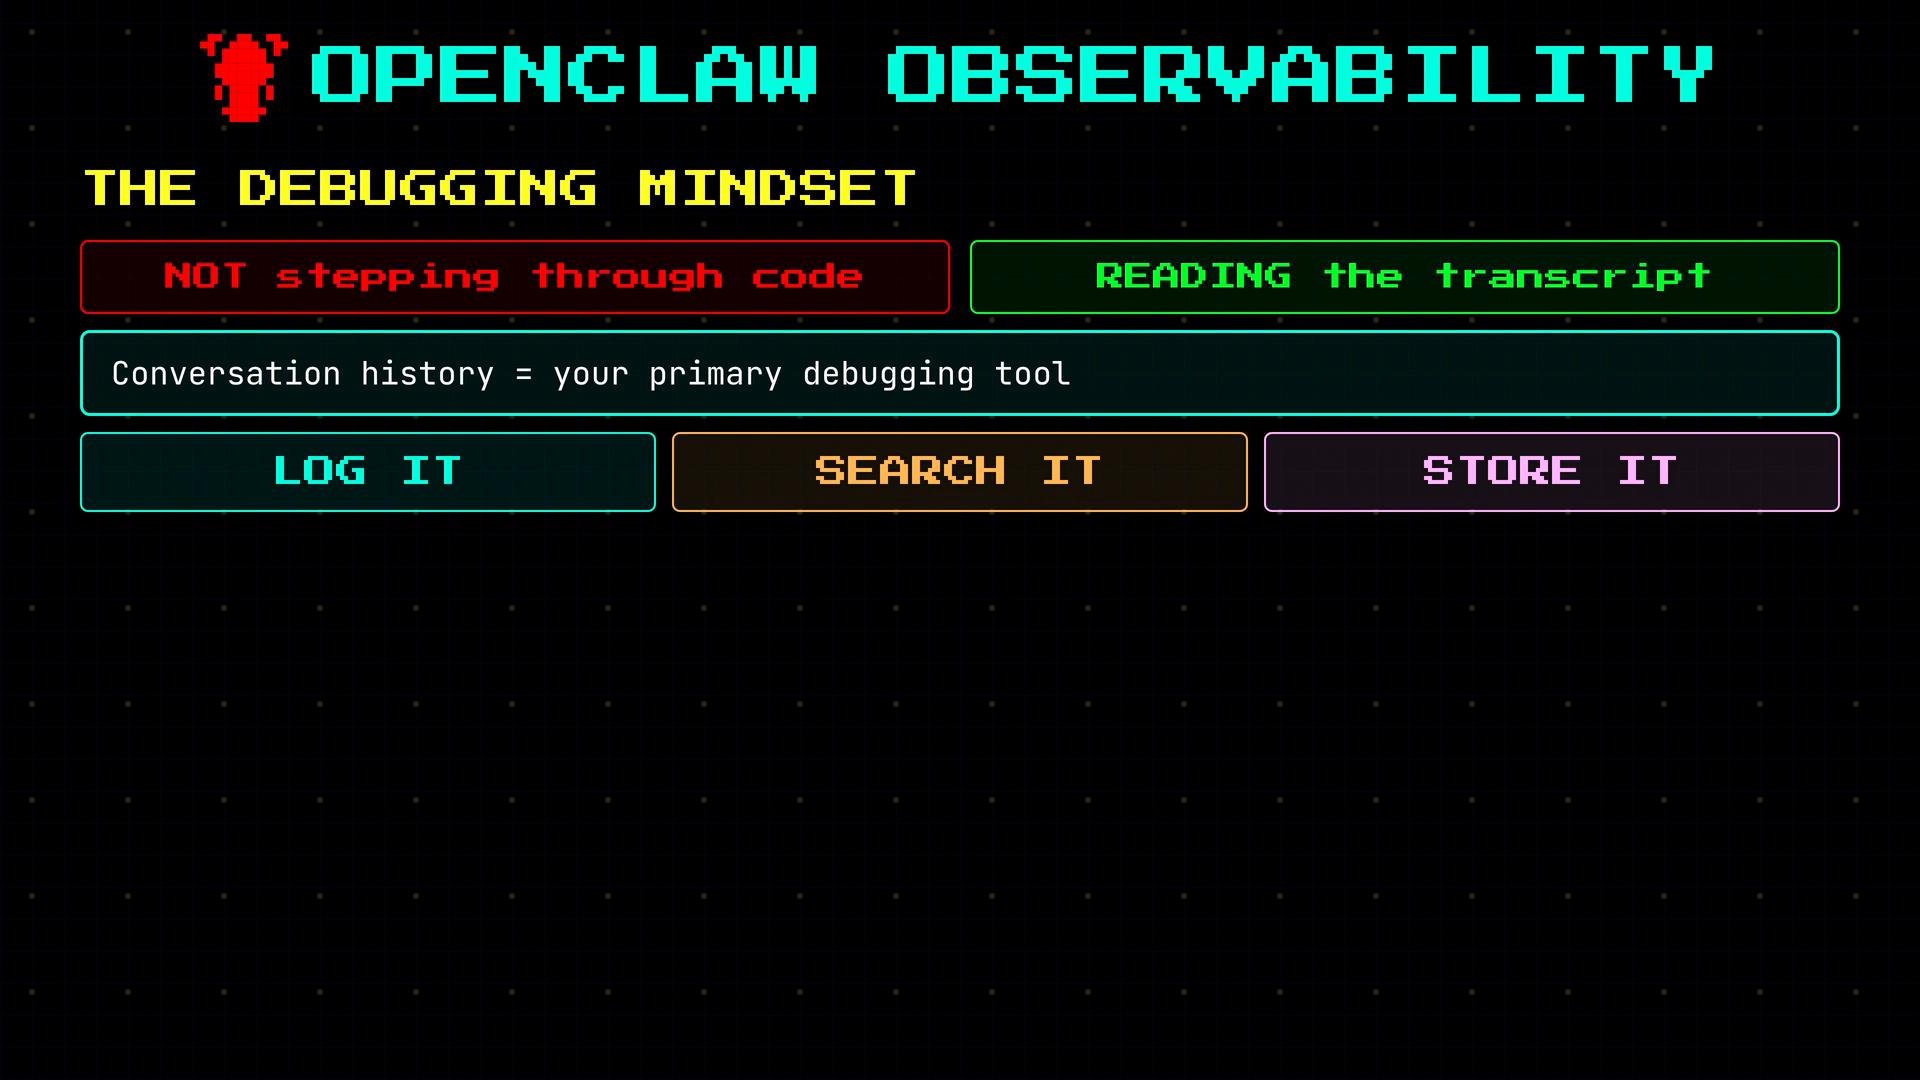
You are not stepping through functions — you are reading a transcript. Every tool call, every result, and the model’s reasoning is your primary debugging interface. Make logs searchable, structured, and retained long enough for analysis and postmortems.
Beware of cost and privacy: verbose logging increases token usage and storage. Balance fidelity with cost and compliance by sampling, redacting PII, and aggregating metrics.
## Checklist: build observability from day one
* Design logs as structured events (timestamp, type, payload, tokens, duration).
* Emit both high-level summaries and raw traces for deep debugging.
* Track the six key metrics per request and surface alerts on outliers.
* Stream events for live UIs and easier replay.
* Ensure PII is handled (masking/redaction) and log retention complies with policy.
* Use tools like OpenTelemetry and Prometheus for metrics and tracing integrations.
## Links and references
* OpenTelemetry: [https://opentelemetry.io/](https://opentelemetry.io/)
* Prometheus: [https://prometheus.io/](https://prometheus.io/)
* Guidance on logging and PII: [https://www.privacyguidance.example/](https://www.privacyguidance.example/) (replace with your org policy)
Build monitoring and observability into your agent system from the start — readable transcripts and structured metrics are the fastest path from incident to resolution.
This documentation is built and hosted on [Mintlify](https://mintlify.com), a developer documentation platform.
## The debugging mindset for agents
You are not stepping through functions — you are reading a transcript. Every tool call, every result, and the model’s reasoning is your primary debugging interface. Make logs searchable, structured, and retained long enough for analysis and postmortems.
Beware of cost and privacy: verbose logging increases token usage and storage. Balance fidelity with cost and compliance by sampling, redacting PII, and aggregating metrics.
## Checklist: build observability from day one
* Design logs as structured events (timestamp, type, payload, tokens, duration).
* Emit both high-level summaries and raw traces for deep debugging.
* Track the six key metrics per request and surface alerts on outliers.
* Stream events for live UIs and easier replay.
* Ensure PII is handled (masking/redaction) and log retention complies with policy.
* Use tools like OpenTelemetry and Prometheus for metrics and tracing integrations.
## Links and references
* OpenTelemetry: [https://opentelemetry.io/](https://opentelemetry.io/)
* Prometheus: [https://prometheus.io/](https://prometheus.io/)
* Guidance on logging and PII: [https://www.privacyguidance.example/](https://www.privacyguidance.example/) (replace with your org policy)
Build monitoring and observability into your agent system from the start — readable transcripts and structured metrics are the fastest path from incident to resolution.
This documentation is built and hosted on [Mintlify](https://mintlify.com), a developer documentation platform.