> ## Documentation Index
> Fetch the complete documentation index at: https://notes.kodekloud.com/llms.txt
> Use this file to discover all available pages before exploring further.
# Creating Component Diagrams and Data Flow
> This article focuses on refining technical specifications and creating component diagrams to visualize data flows in a simplified manner.
In this article, we refine our technical specifications and illustrate a component diagram to visualize data flows clearly. Previously, we generated a detailed technical specifications document that contained extra information. Now, we focus on building a simplified component diagram using BlackboxAI to represent our components and their data interactions.
## Initial Diagram Generation
We started by prompting BlackboxAI to create a component diagram in Mermaid format. The prompt used was:
```text theme={null}
create a component diagram showing components and data flows. Output this in mermaid format.
```
This prompt generated a detailed diagram along with an explanation. Even though extra elements such as MongoDB were included, the diagram served as a solid starting point. Below is the generated Mermaid code:
```mermaid theme={null}
graph TD
A[User Interface] -->|Uploads Image| B[Image Upload Service]
B -->|Processes Image| C[Image Processing Service]
B -->|Stores Optimized Image| D[Cloud Storage (AWS S3)]
C -->|Returns Image URL| E
C -->|Sends Metadata| F[Database (MongoDB)]
E -->|Returns Metadata| C
F -->|Returns Optimized Image| B
B -->|Returns Image URL to User| A
subgraph User Authentication
G[Authentication Service]
A -->|Login/Signup| G
G -->|Validates User| E
end
```
Mermaid diagrams can be generated using various tools like Draw\.io and Excalidraw. When using Excalidraw with the Mermaid-to-Excalidraw option, you might encounter minor syntax errors (often related to brackets). These errors are typically easy to fix.
### Diagram Analysis
The original diagram outlines the following flow:
* The **User Interface** is the entry point where users log in and upload an image.
* The **Image Upload Service** handles image uploads.
* The **Image Processing Service** optimizes the image.
* Optimized images are stored in **AWS S3**.
* Data such as metadata is exchanged between services during the retrieval process.
While this diagram is comprehensive, it includes components that are not required for our revised implementation.
## Updating the Component Diagram
To align the diagram with our updated technical specifications, we first identify the components to remove. For example, our new requirements exclude batch processing, image resizing, user authentication, MongoDB storage, S3 storage, and a caching layer. The backend will be built using Flask (with OpenCV for image processing), and no persistent storage is required. Below is the removal list:
```plaintext theme={null}
Remove Batch processing of existing images in a web application
Remove Image Resizing
Remove User authentication
Remove MongoDB storage of images
Remove S3 storage of images
Remove caching layer
```
After revising the technical specifications, our high-level architecture includes:
* A frontend built with React.
* A backend using Flask along with OpenCV for image processing.
Using these changes, we updated our component diagram. Below is the revised Mermaid diagram representing the new system:
```mermaid theme={null}
graph TD
A[User Interface] -->|Uploads Image| B[Image Upload Service]
B -->|Processes Image| C[Image Processing Service]
C -->|Stores Optimized Image| D[Cloud Storage (AWS S3)]
D -->|Returns Image URL| E
E -->|Sends Metadata| F[Database (MongoDB)]
F -->|Returns Metadata| C
C -->|Returns Optimized Image| A
A -->|Requests Image| F[Image Retrieval Service]
F -->|Fetches Metadata| E
E -->|Returns Metadata| F
F -->|Fetches Image| D
D -->|Returns Image to User| A
```
After further adjustments, we arrive at a cleaner version focused solely on our application requirements:
```mermaid theme={null}
graph TD
A[User Interface] -->|Uploads Image| B[Image Upload Service]
B -->|Processes Image| C[Image Processing Service (Flask + OpenCV)]
C -->|Returns Optimized Image| B
B -->|Returns Image URL to| A
A -->|Requests Optimized Image| D[Image Retrieval Service]
D -->|Fetches Optimized Image| C
C -->|Returns Image to| A
```
This updated diagram illustrates the refined data flow:
* The **User Interface** uploads an image via the **Image Upload Service**.
* The **Image Processing Service (Flask + OpenCV)** processes and optimizes the image.
* The **Image Upload Service** returns the image URL to the **User Interface**.
* When a user requests the optimized image, the **Image Retrieval Service** fetches it from the processing service.
## Visual Representations
The images below illustrate the overall data flow and the key components of the image processing service:
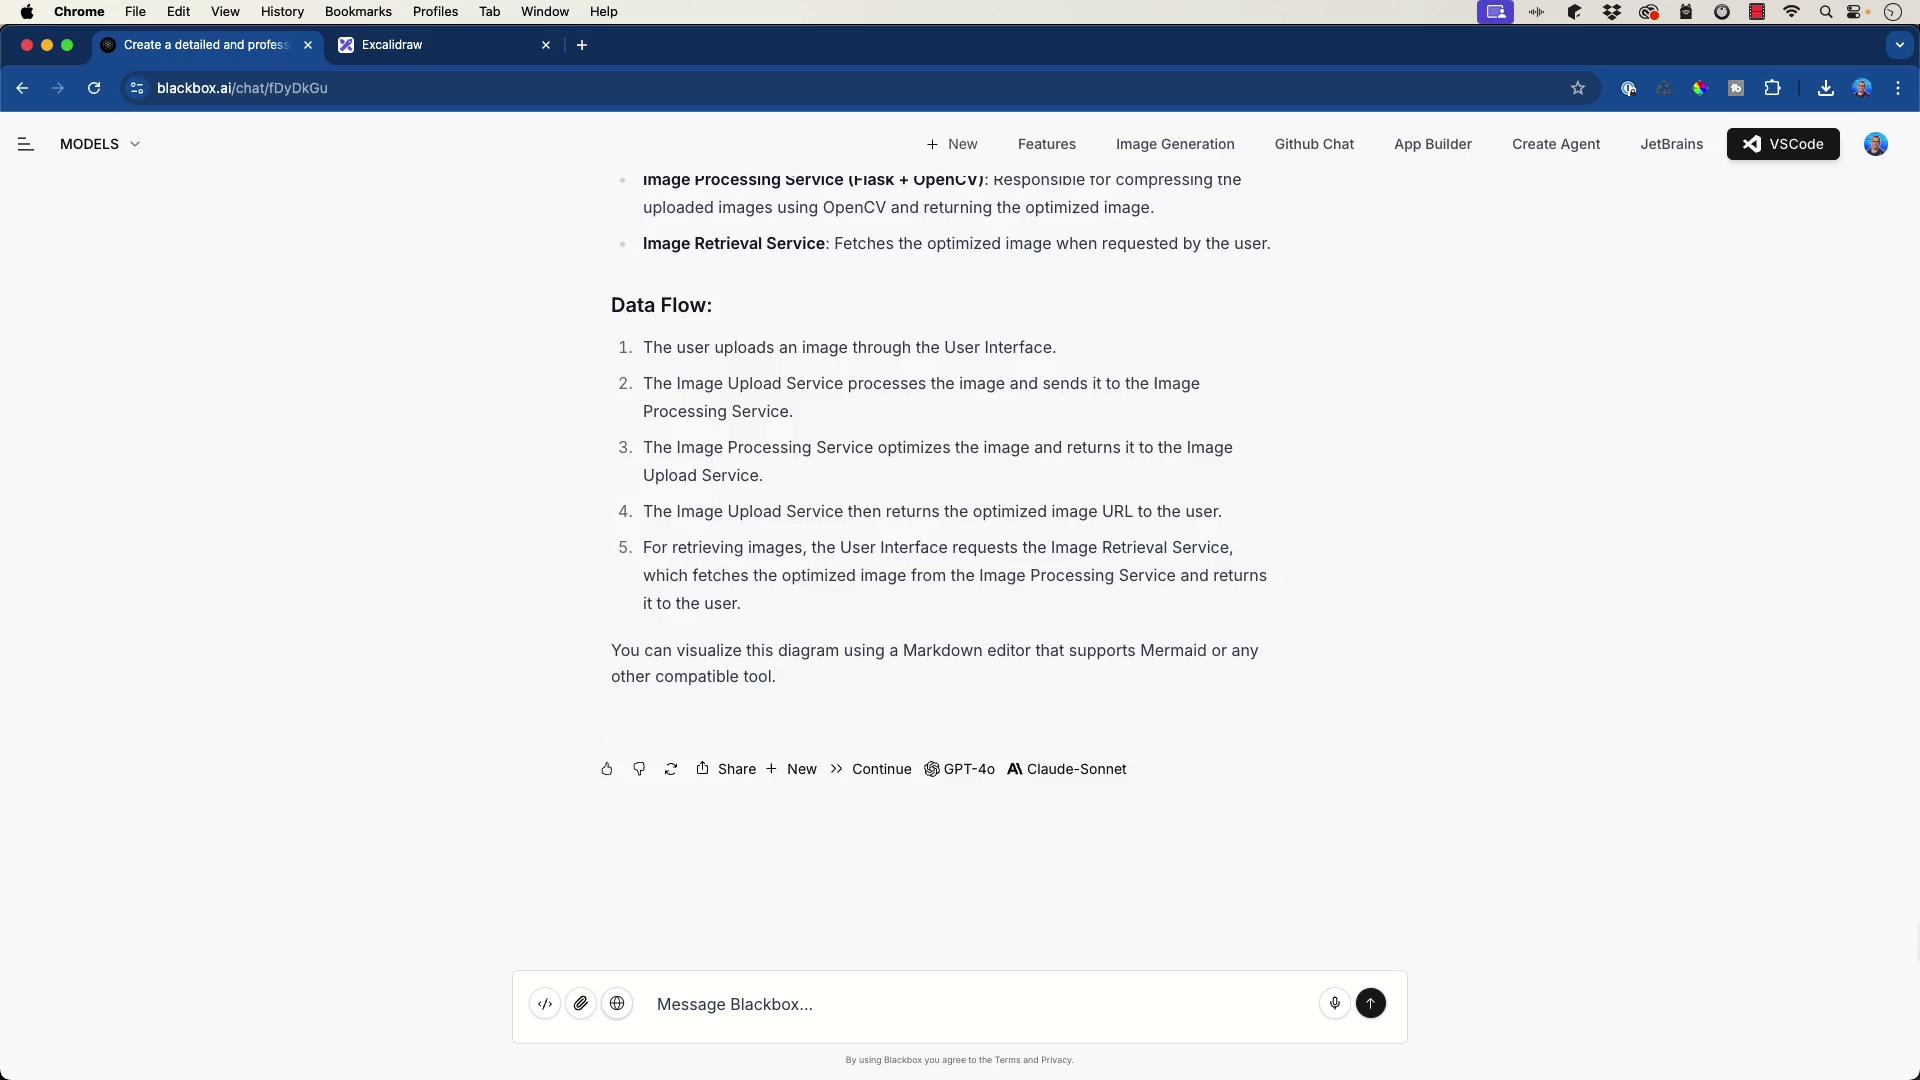
Tools like Excalidraw and Draw\.io allow you to import Mermaid diagrams for further customization. With Draw\.io, for example, you can import the Mermaid code directly, adjust colors, export to SVG or PNG, and achieve a polished look quickly.
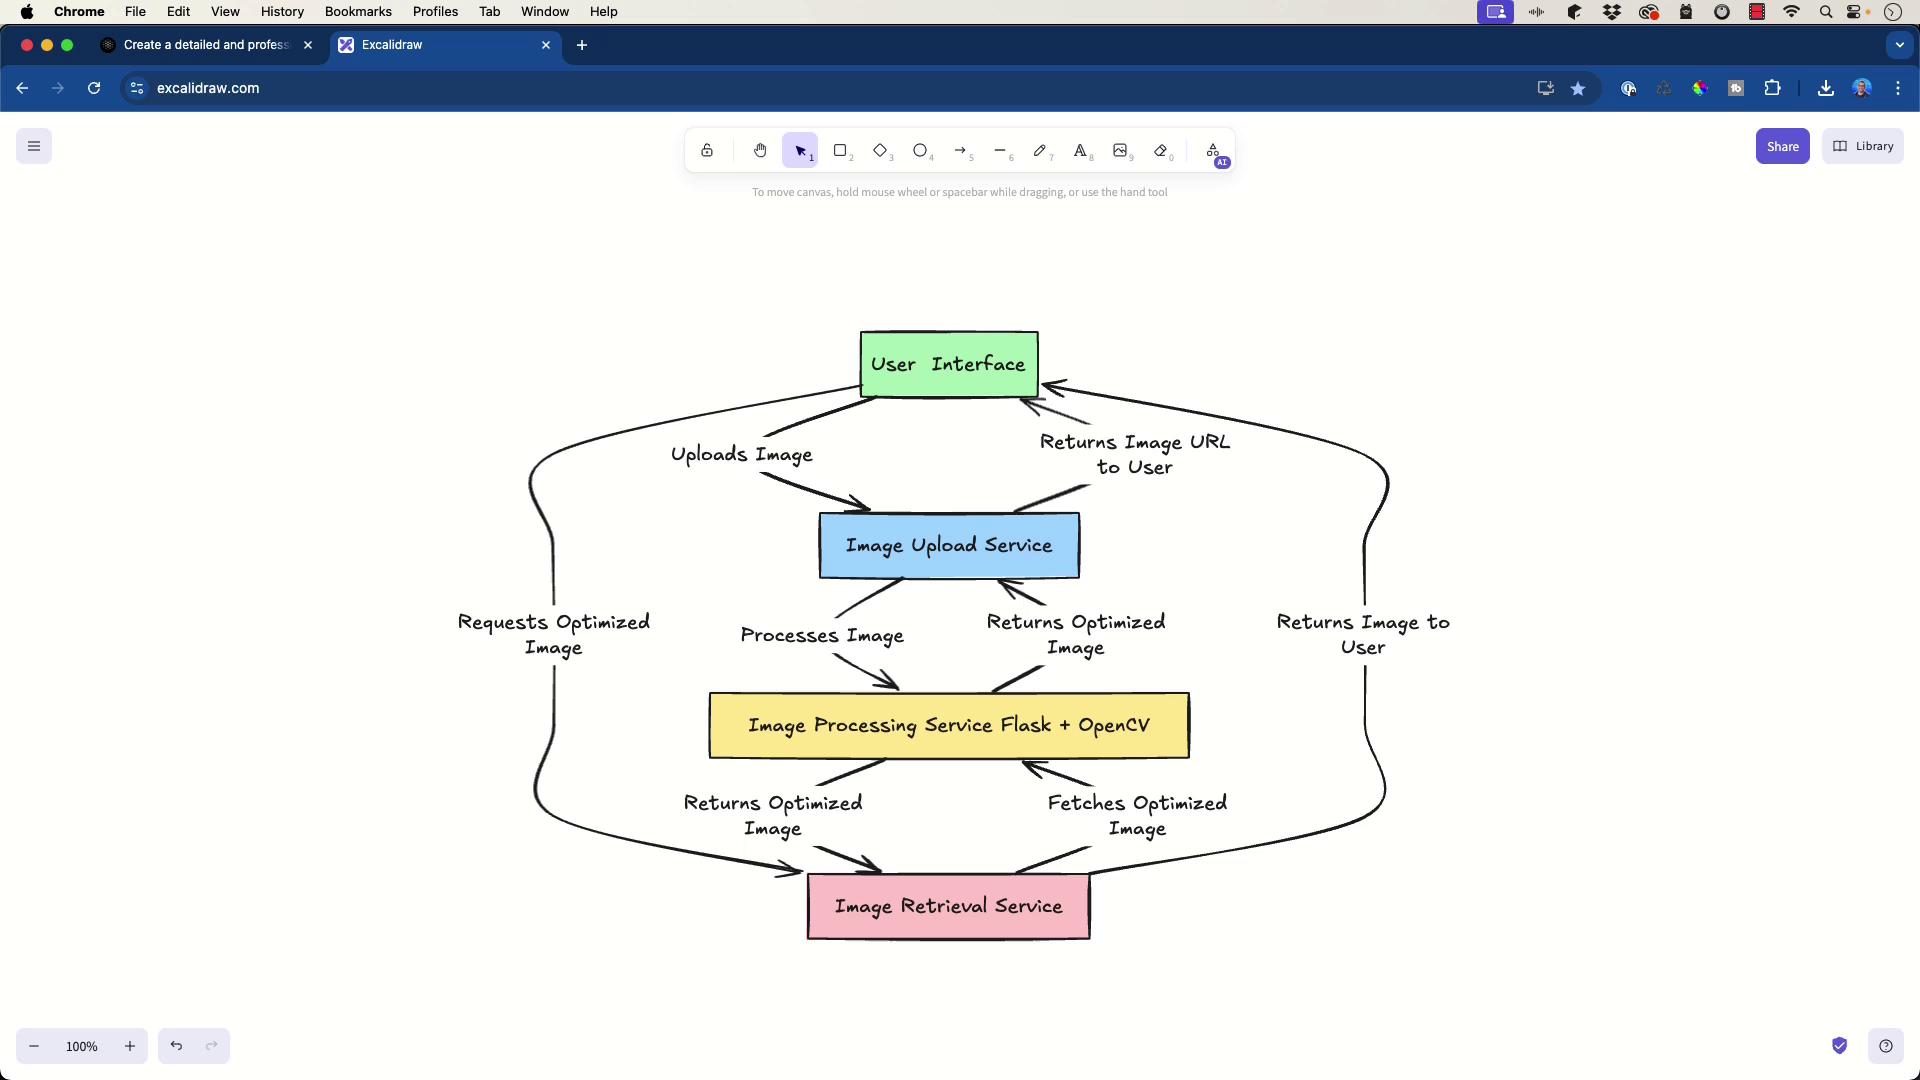
Other AI tools like ChatGPT can also generate similar outputs, but BlackboxAI has proven especially useful for displaying detailed and thorough documentation. Moreover, you can use BlackboxAI without an account—simply visit their website, generate your Mermaid diagram, and even export it as an SVG if needed.
## Conclusion
This module on creating component diagrams and understanding data flows sets the stage for our next steps. In the following section, we will begin building the application based on these refined specifications.