How CloudWatch Works
When your services and applications—whether hosted on AWS or externally—generate logs and metrics, CloudWatch collects these data points into a centralized location. This enables you to monitor and query your entire infrastructure effortlessly. For example, you can configure an alarm to activate if CPU utilization exceeds 70%, triggering actions such as sending an email or publishing a message to an SNS topic. CloudWatch also offers CloudWatch Metrics Insights, a powerful SQL-like querying tool that allows you to extract detailed insights from your metrics.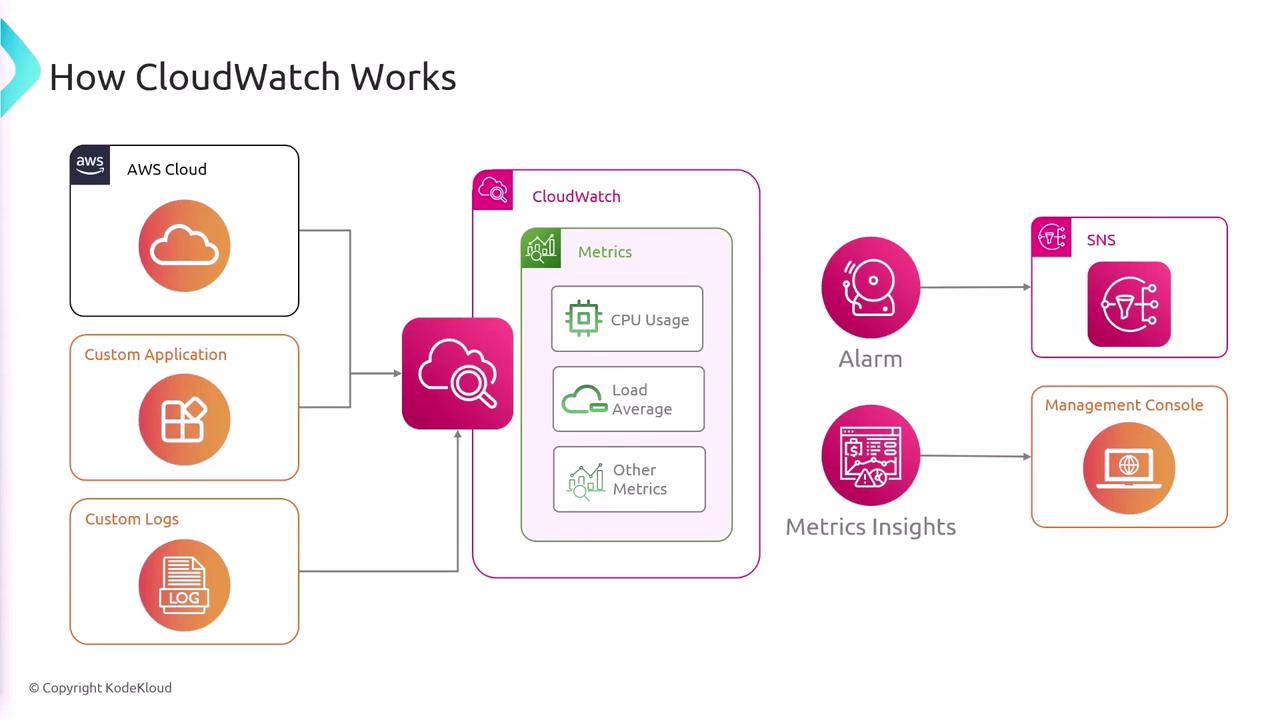
Key Components of CloudWatch
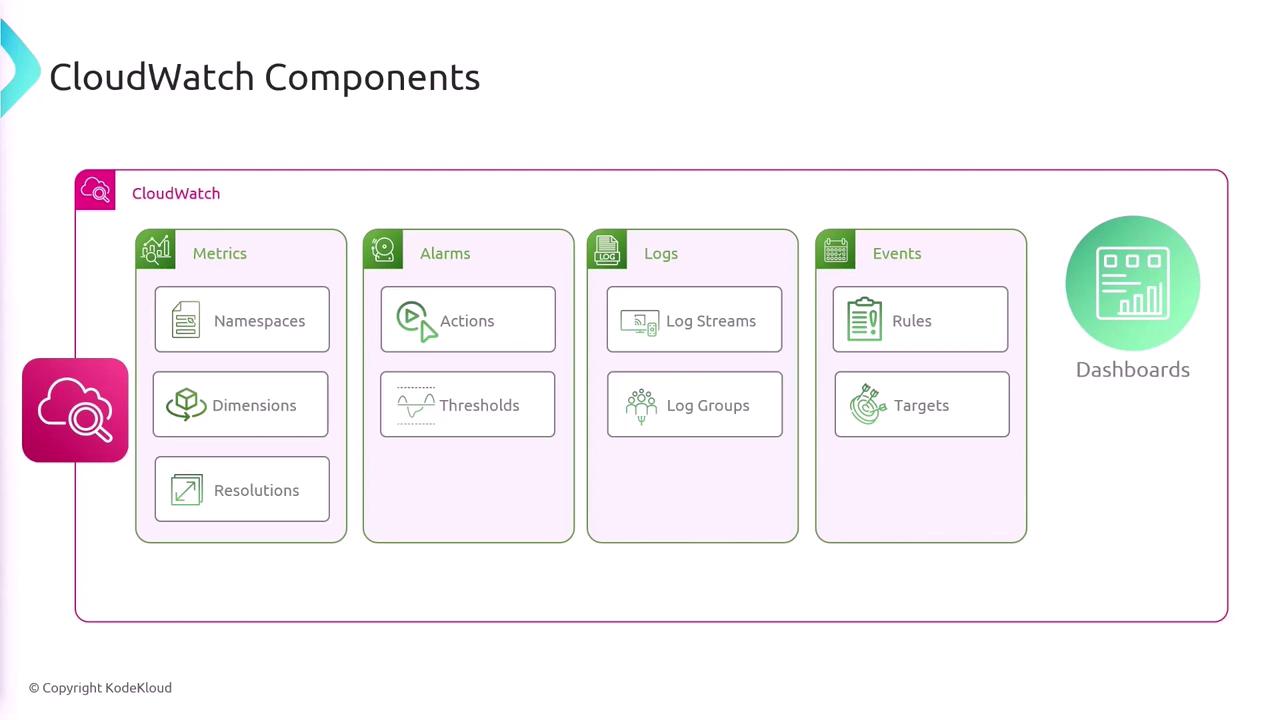
CloudWatch is built on several fundamental components:- Metrics: Data points that can be visualized on dashboards.
- Alarms: Automated triggers that perform defined actions when certain thresholds are crossed.
- Logs: Storage and search capabilities for application and system logs.
- Events (EventBridge): Real-time event routing to different targets.
- Dashboards: Customizable views for monitoring your environment.
Metrics in CloudWatch
AWS services automatically send metrics to CloudWatch upon deployment. For example, when you launch an EC2 instance or create a Lambda function, default metrics such as CPU utilization, network packets, invocation counts, and errors are published without extra configuration.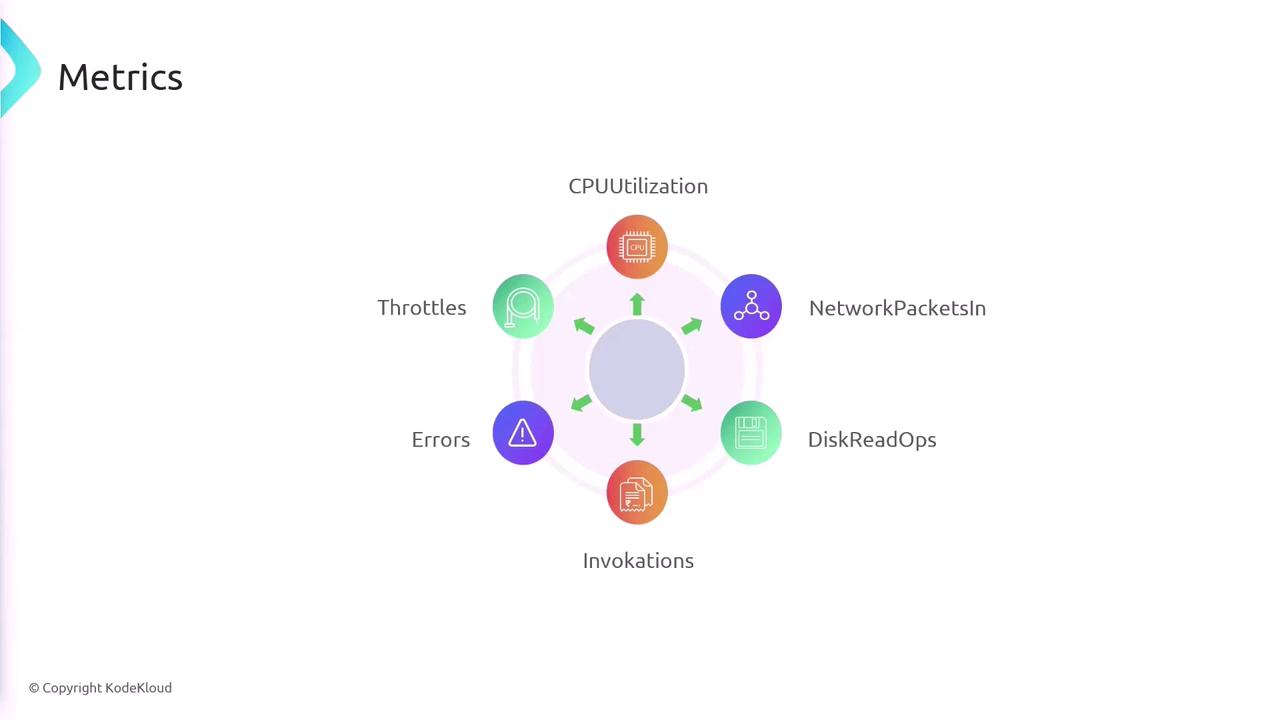
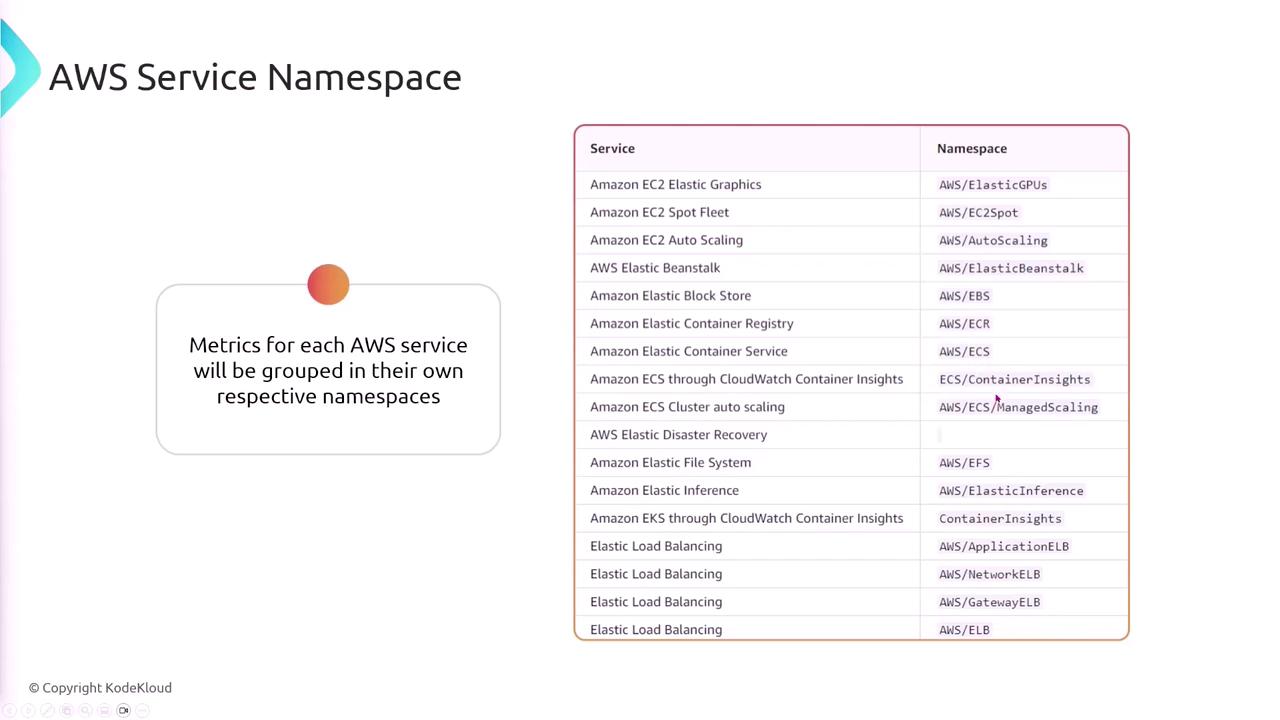
Namespaces
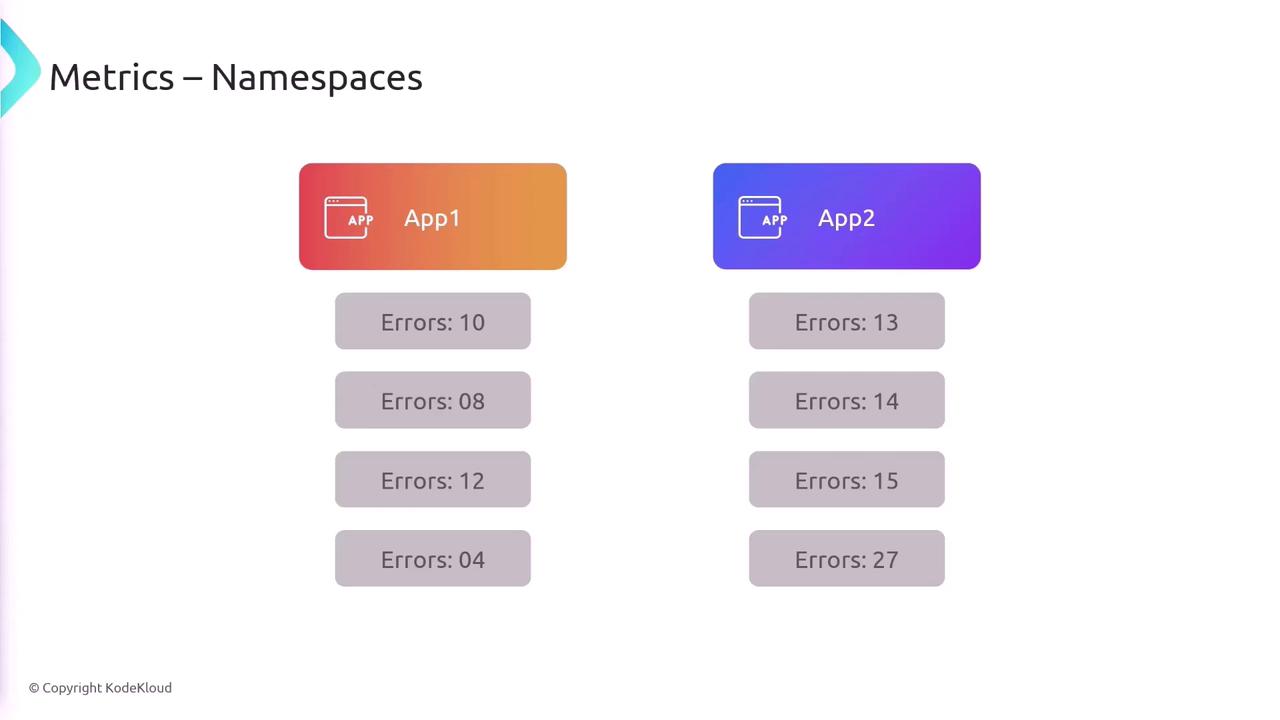
A namespace in CloudWatch acts as a container for metrics, isolating data so that metrics from one application or service do not mix with others.Each AWS service automatically groups its metrics in its own namespace, such as AWS/ECS for ECS metrics or another namespace for Elastic Load Balancer metrics.
Dimensions
Dimensions are key-value pairs that provide additional context for each metric. For instance, a metric for disk read bytes might include dimensions such as the disk identifier or the EC2 instance ID, helping to pinpoint performance characteristics more accurately.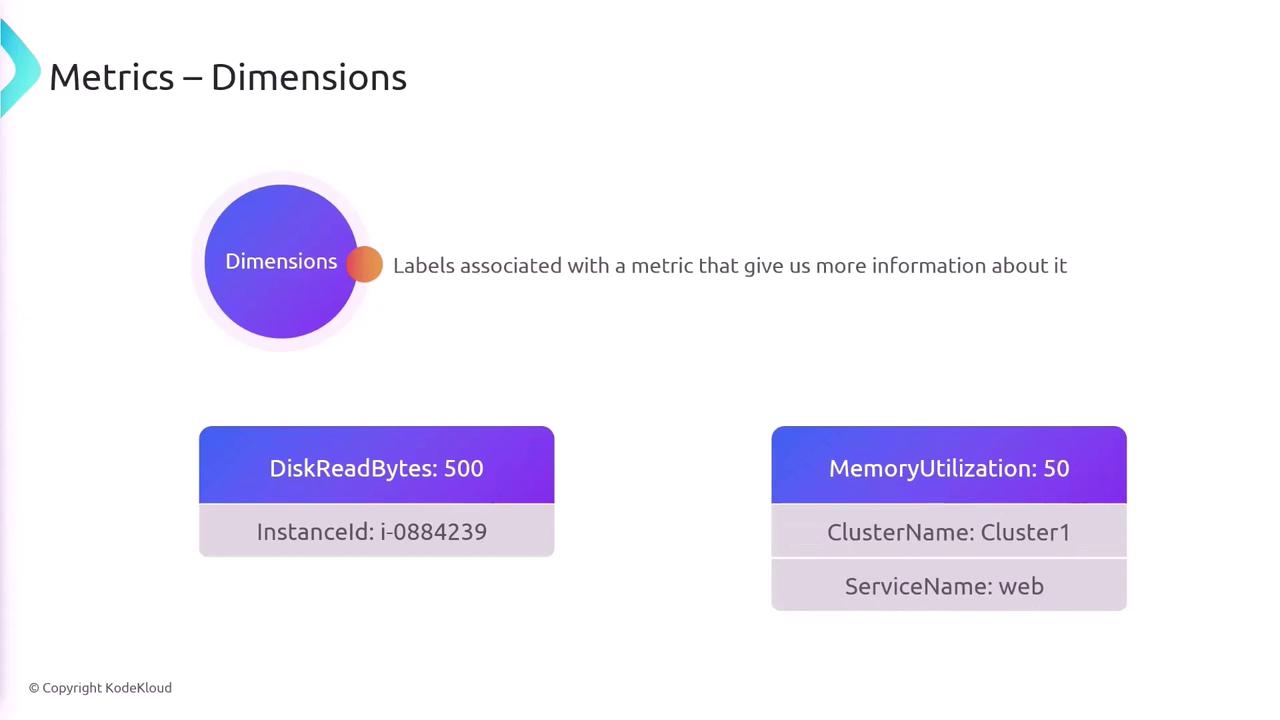
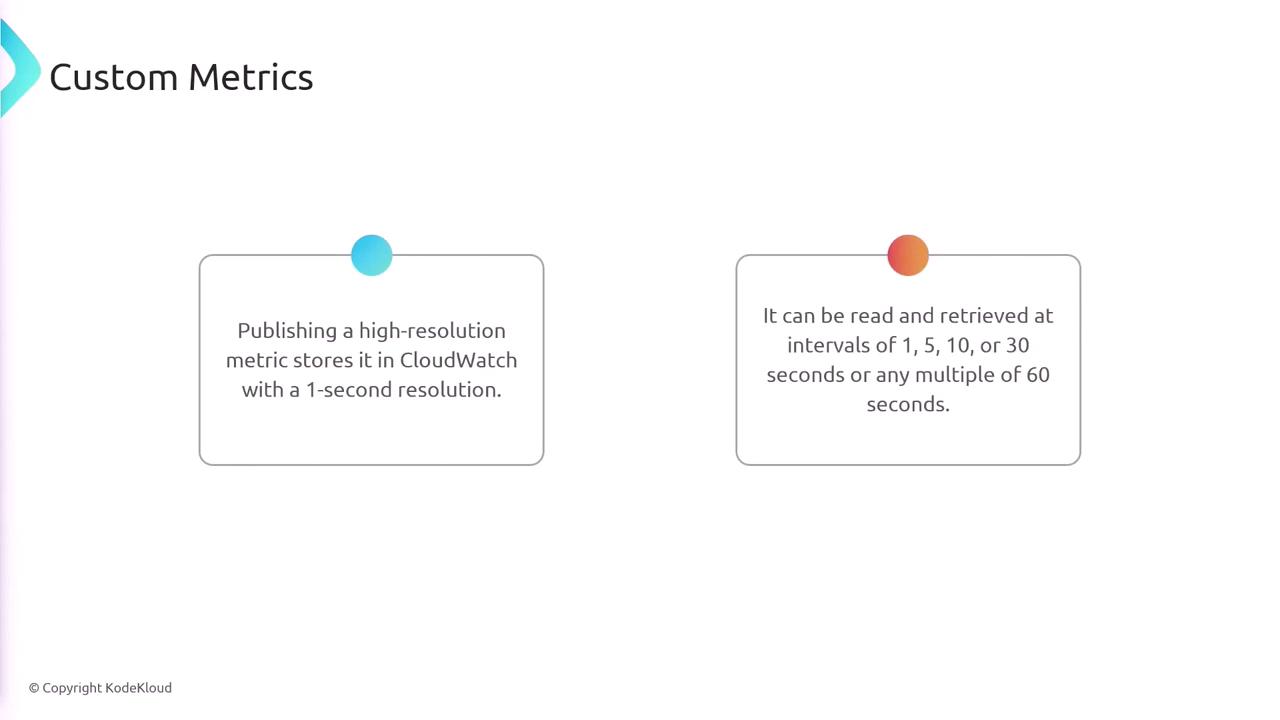
Metric Resolution
CloudWatch supports two types of metric resolutions:- Standard Resolution: 1-minute granularity (default for AWS services).
- High Resolution: 1-second granularity, available for custom metrics.
Logs in CloudWatch
CloudWatch not only collects metrics but also provides a central repository for logs from your applications and systems. You can forward logs from your infrastructure to CloudWatch, enabling centralized analysis and troubleshooting.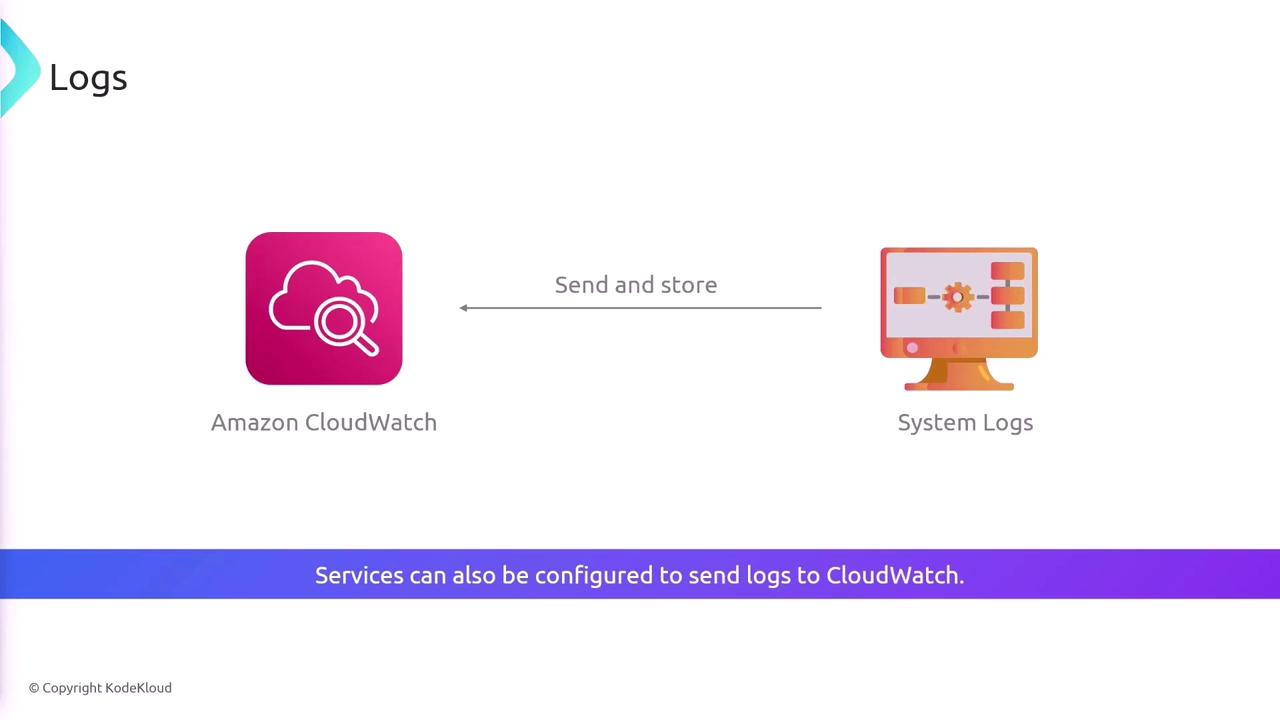
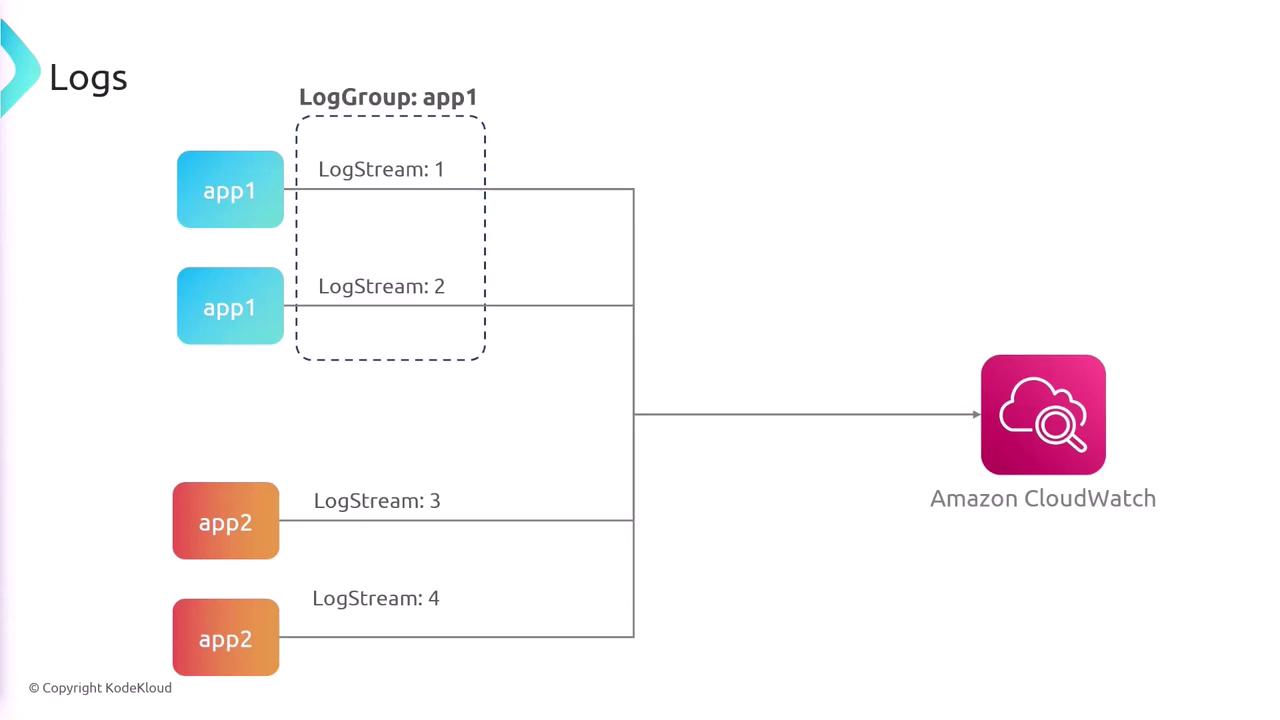
Log Groups and Log Streams
- Log Groups: Collections of log streams that share retention, monitoring, and access settings.
- Log Streams: Sequences of log events from the same source, such as individual servers or services.
CloudWatch Log Insights
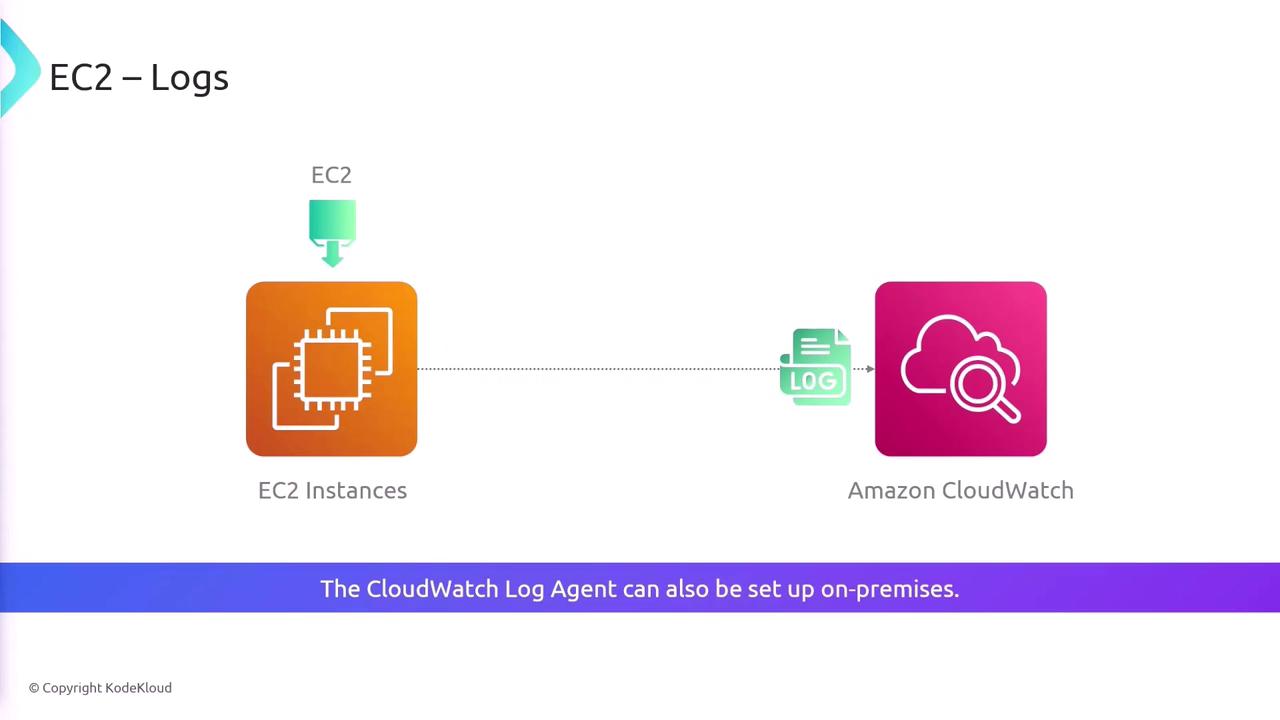
CloudWatch Log Insights is a robust query tool that lets you search and analyze logs efficiently. You can run queries across multiple log groups and even across different AWS accounts. Here’s an example query:By default, EC2 instances do not forward logs to CloudWatch. To enable log forwarding, install the CloudWatch agent on your EC2 instances or on-premises servers.
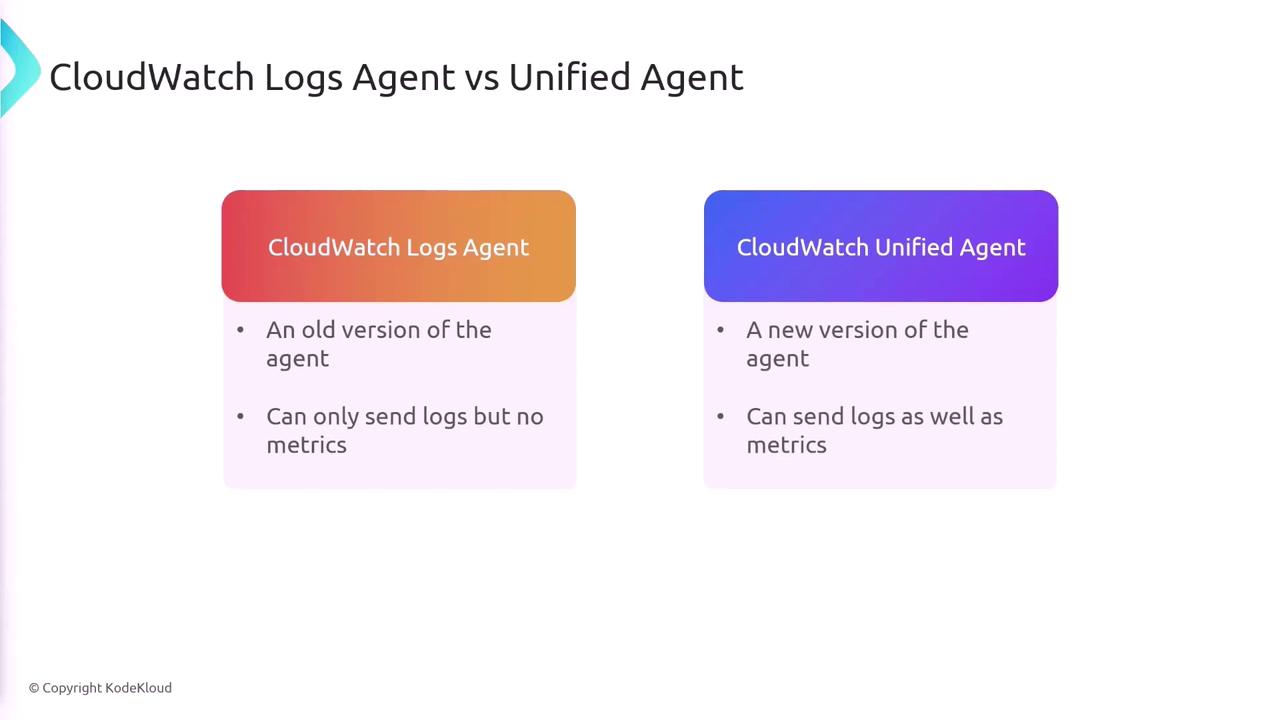
CloudWatch Agents
There are two main agents for log collection in CloudWatch:| Agent Type | Capabilities |
|---|---|
| CloudWatch Logs Agent | Sends logs only |
| CloudWatch Unified Agent | Sends both logs and metrics |
Summary
AWS CloudWatch is an essential tool for monitoring and logging, offering comprehensive insights into your infrastructure. Key takeaways include:- Metrics are isolated within specific namespaces.
- Dimensions add valuable metadata to your metrics.
- CloudWatch supports both standard and high-resolution metrics.
- Log groups and log streams allow centralized log management.
- EC2 instances need the CloudWatch agent for log forwarding.
- CloudWatch Log Insights facilitates robust log querying and analysis.