> ## Documentation Index
> Fetch the complete documentation index at: https://notes.kodekloud.com/llms.txt
> Use this file to discover all available pages before exploring further.
# X Ray Demo
> Guide to using AWS X-Ray in CloudWatch to visualize service maps, inspect traces and segment timelines, troubleshoot faults, and build queries to analyze application performance.
In this lesson you'll learn how to inspect traces produced by an instrumented application using AWS X-Ray (accessible from the CloudWatch console). The sample application is already deployed and configured to send traces to X-Ray — this guide focuses on interpreting those traces in the X-Ray console rather than on the instrumentation steps.
To use X-Ray you must instrument your application with the X-Ray SDK or an AWS-supported integration so that traces and segments are sent to the service.
X-Ray uses sampling by default, which means not every request will generate a trace. When troubleshooting, consider adjusting the sampling rules or temporarily disabling sampling to capture more traces. Be mindful of increased storage and cost when changing sampling rates.
## Opening X-Ray in CloudWatch
Open the AWS Console and search for "X-Ray" (it appears as its own service and is integrated with CloudWatch). X-Ray provides two primary views that are useful for troubleshooting and performance analysis:
| View | Purpose | What you can do |
| - | - | - |
| Service map | Visual topology of your application | See services, clients and resources and how they interact; click nodes to view metrics and traces |
| Traces | Searchable list of individual request traces | Inspect per-request segments, timeline, response codes, durations, and errors |
### Service Map
The Service Map shows nodes (clients, services, AWS resources) and the edges between them. In the demo below, a client issues requests to a Scorekeep application running in an ECS container. That container interacts with multiple DynamoDB tables and publishes to an SNS topic.
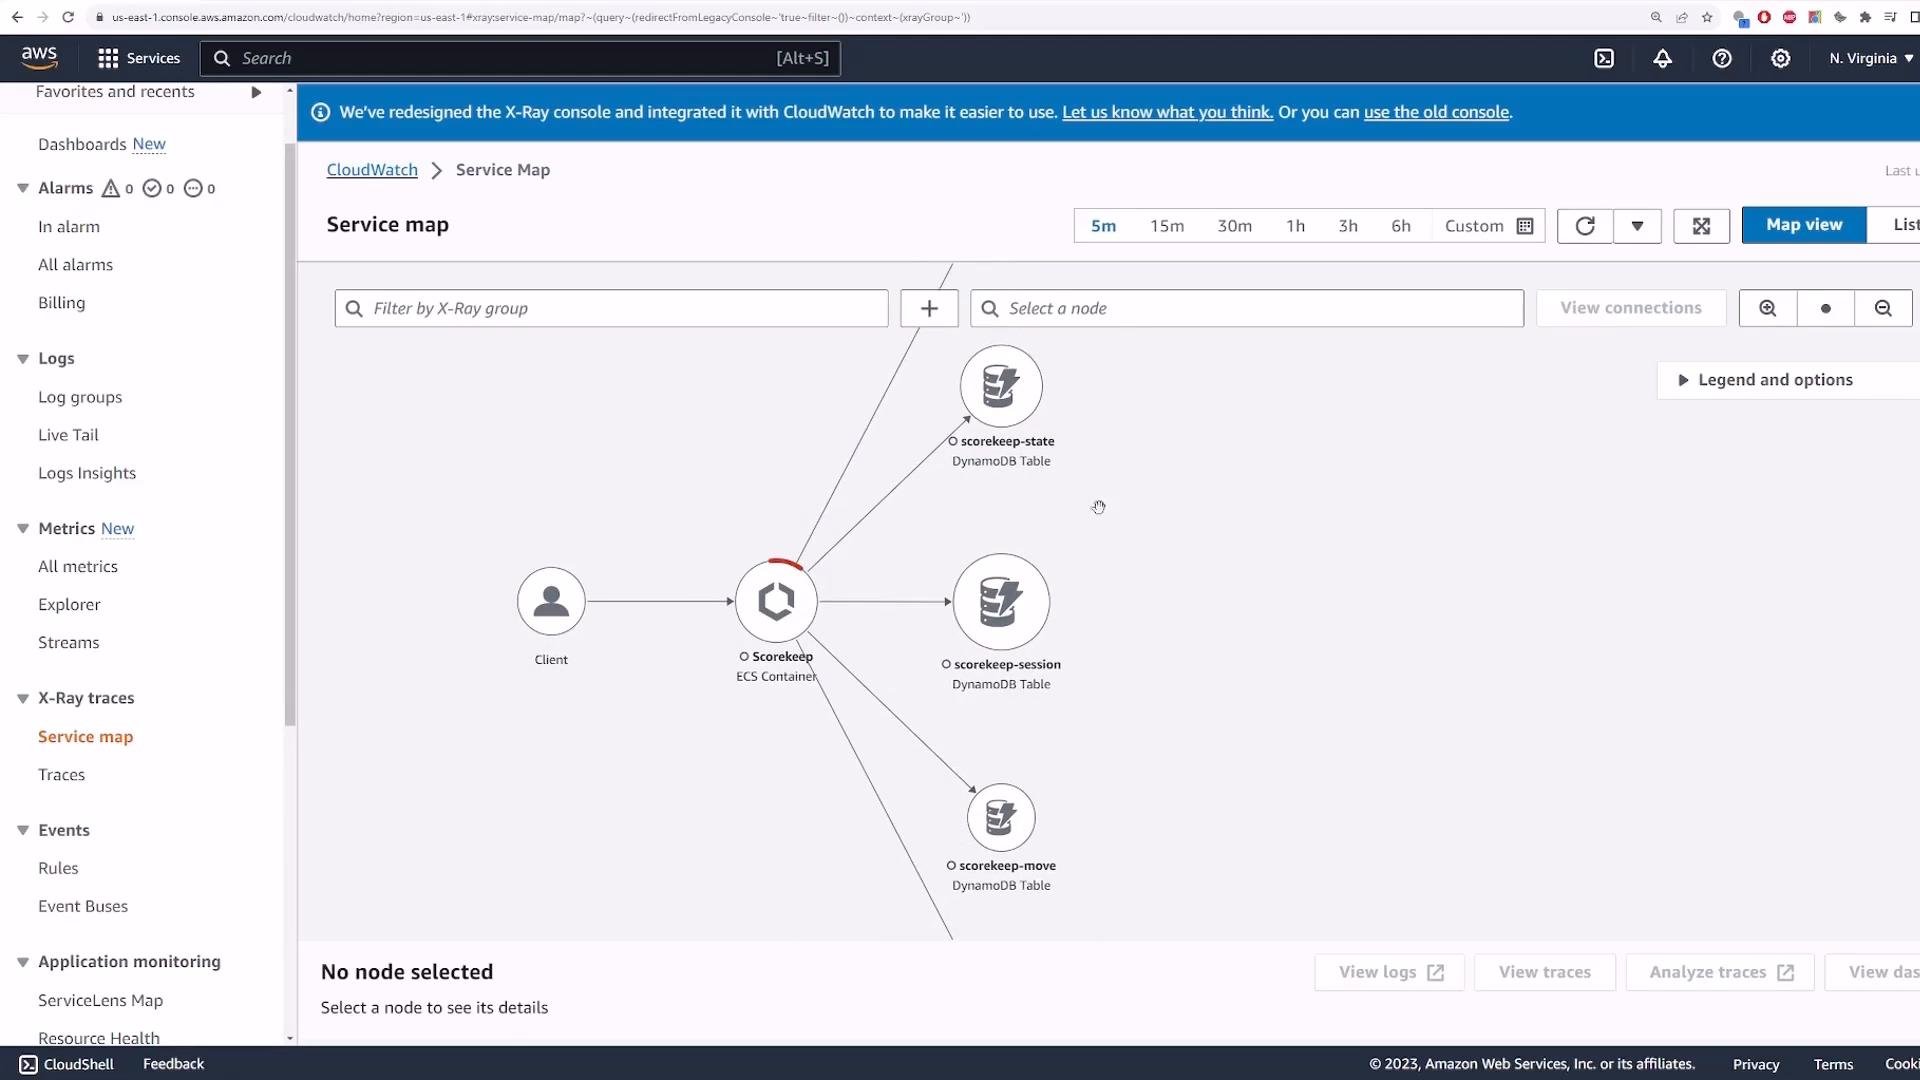 Tips for using the Service Map:
* Adjust the timeframe (last 5, 15 minutes, etc.) to focus on recent activity.
* Click any node to see metrics such as latency, request count and fault rate.
* Use the node's "View traces" action to open traces that include that component.
## Viewing Traces for a Node
Selecting "View traces" builds a filter query targeting that service. For example, to view traces involving the ScorekeepGame DynamoDB table:
```text theme={null}
service(id(name: "scorekeep-game", type: "AWS::DynamoDB::Table"))
```
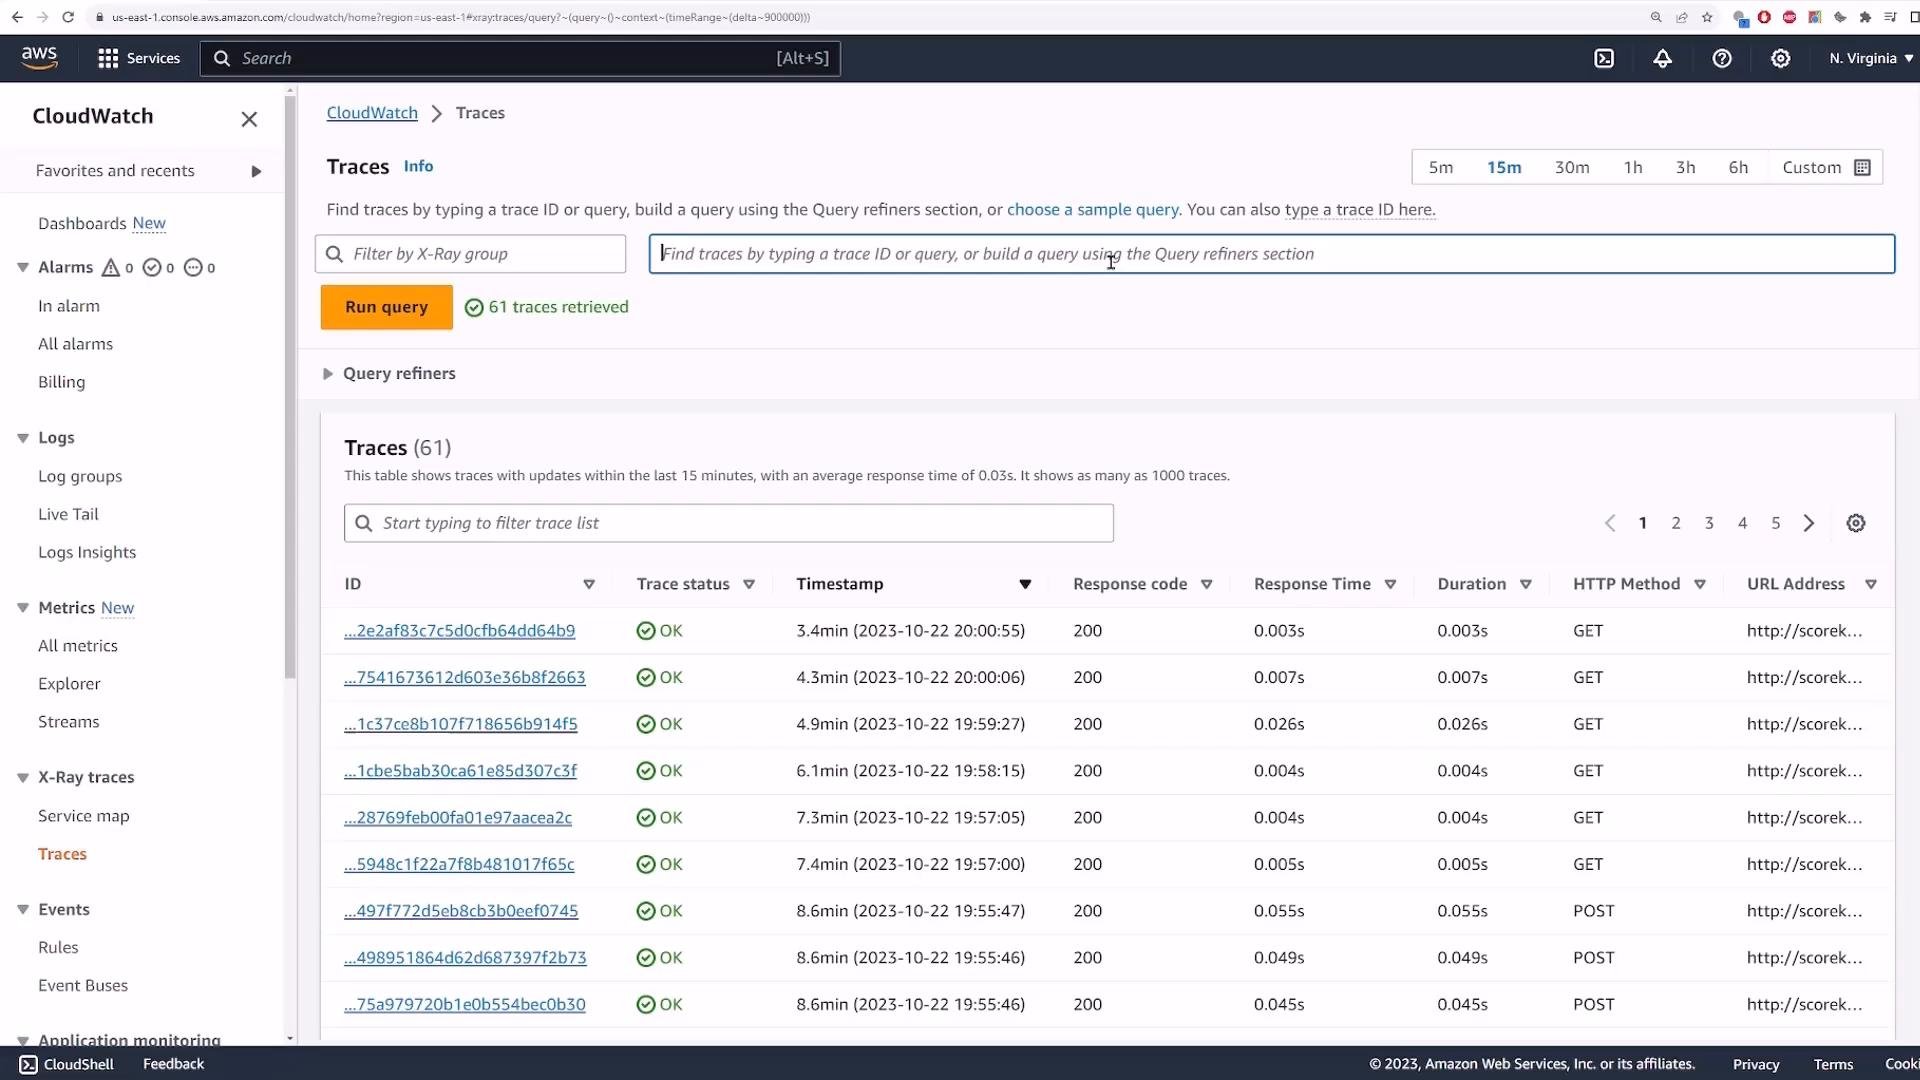
Run the query to list matching traces. The Traces page displays trace IDs, status, timestamps, response codes and durations; click any trace to inspect its segments and timeline.
## Inspecting a Trace and Segments
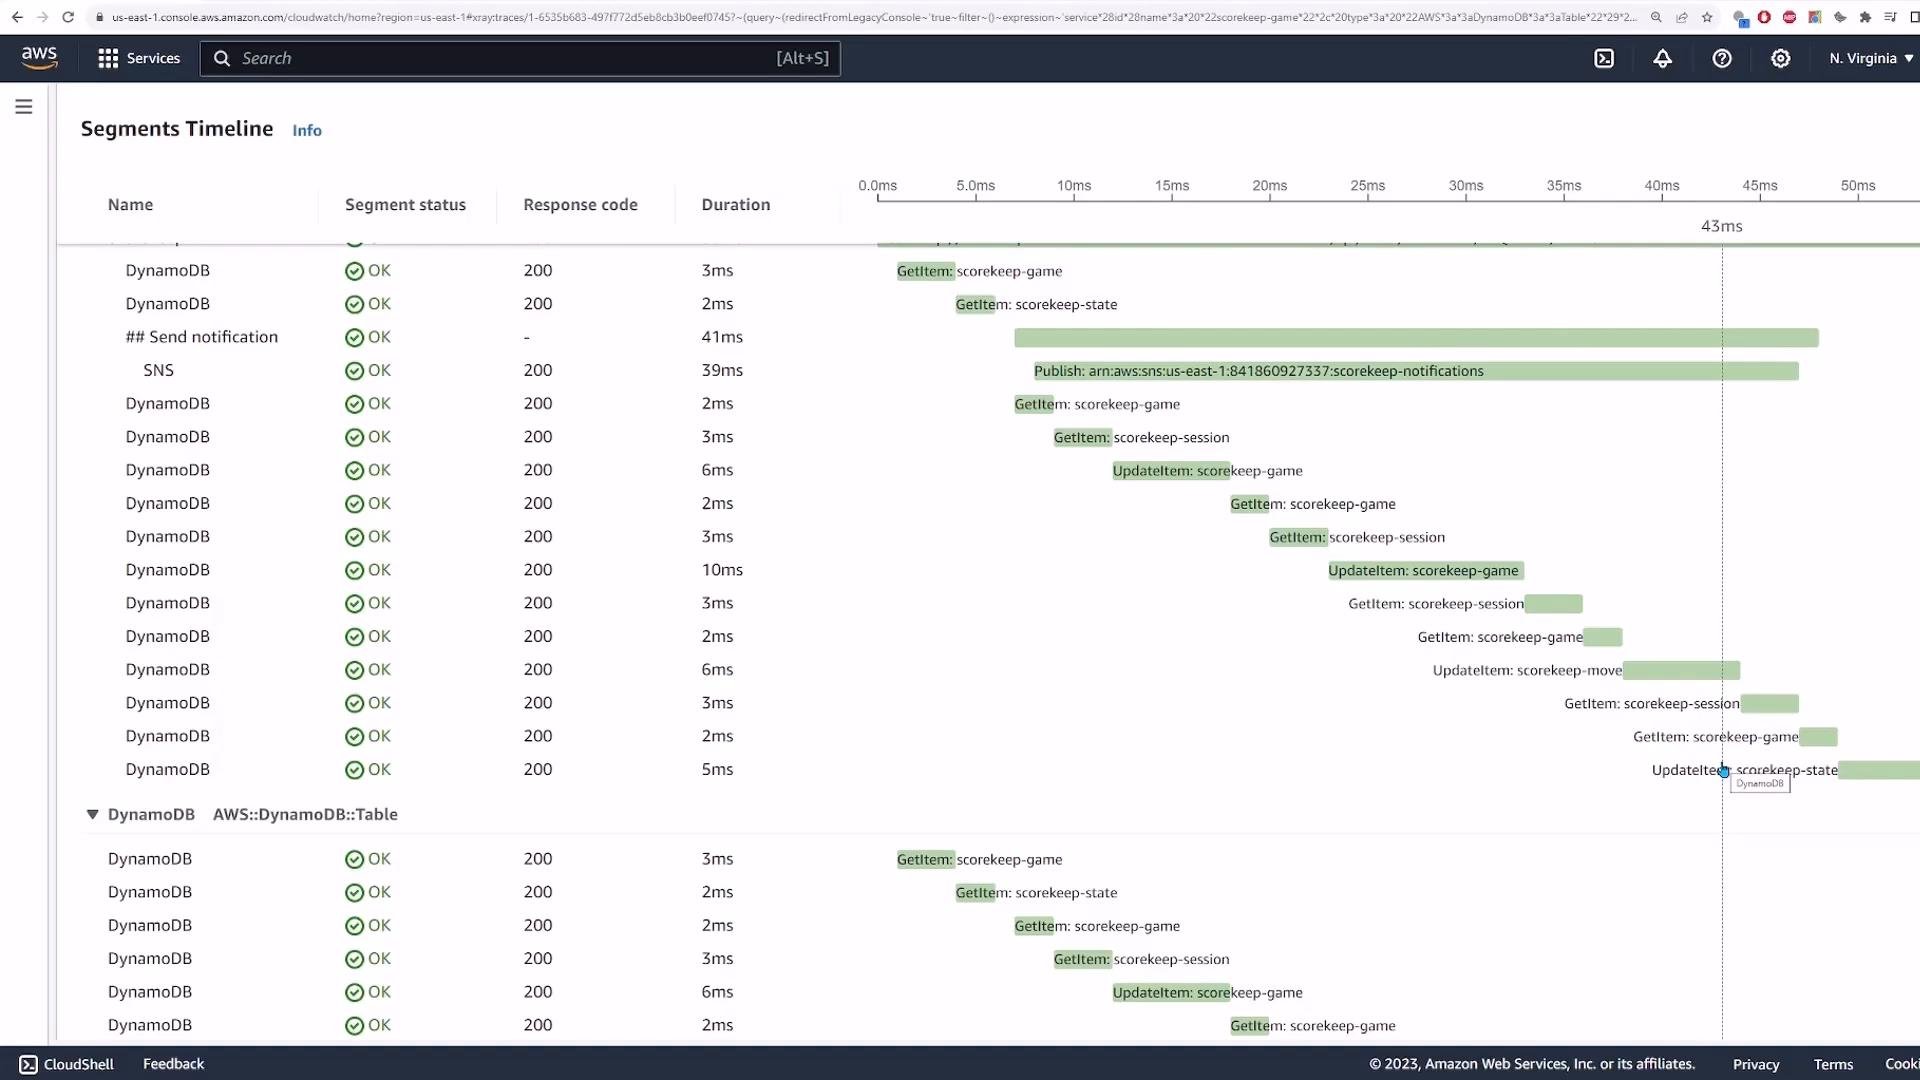
A trace contains segments (one per service, resource, or logical operation). The trace view shows a timeline with the start time and duration of each segment so you can quickly identify which operations contribute most to latency.
Example segments timeline (trimmed and reformatted for readability):
```text theme={null}
Segments Timeline Info
Name Segment status Response code Duration
▾ Scorekeep AWS::ECS::Container
Scorekeep OK 200 55ms POST http://scorekeep-lb-2109482132.us-east-1.elb.amazonaws.com/api/move/ACHPV0P4/BKQB0F95/IHTNODIB
DynamoDB OK 200 3ms GetItem: scorekeep-game
DynamoDB OK 200 2ms GetItem: scorekeep-state
## Send notification OK - 41ms
SNS OK 200 39ms Publish: arn:aws:sns:us-east-1:841860927337:scorekeep-notifications
DynamoDB OK 200 2ms GetItem: scorekeep-game
DynamoDB OK 200 3ms GetItem: scorekeep-session
DynamoDB OK 200 6ms UpdateItem: scorekeep-game
DynamoDB OK 200 2ms GetItem: scorekeep-game
DynamoDB OK 200 3ms GetItem: scorekeep-session
DynamoDB OK 200 10ms UpdateItem: scorekeep-game
DynamoDB OK 200 3ms GetItem: scorekeep-session
DynamoDB OK 200 2ms GetItem: scorekeep-game
DynamoDB OK 200 6ms UpdateItem: scorekeep-state
DynamoDB OK 200 3ms GetItem: scorekeep-session
DynamoDB OK 200 5ms UpdateItem: scorekeep-move
▾ DynamoDB AWS::DynamoDB::Table
DynamoDB OK 200 3ms GetItem: scorekeep-game
```
Each line shows:
* Segment name and type
* Status (e.g., OK, Fault)
* Response code (HTTP or AWS operation result)
* Duration (milliseconds)
* Operation details (HTTP method/URL or API call and resource)
This makes it easy to spot high-latency operations (for example, a long-running UpdateItem or external HTTP call) and to trace the request flow across services.
Tips for using the Service Map:
* Adjust the timeframe (last 5, 15 minutes, etc.) to focus on recent activity.
* Click any node to see metrics such as latency, request count and fault rate.
* Use the node's "View traces" action to open traces that include that component.
## Viewing Traces for a Node
Selecting "View traces" builds a filter query targeting that service. For example, to view traces involving the ScorekeepGame DynamoDB table:
```text theme={null}
service(id(name: "scorekeep-game", type: "AWS::DynamoDB::Table"))
```
Run the query to list matching traces. The Traces page displays trace IDs, status, timestamps, response codes and durations; click any trace to inspect its segments and timeline.
## Inspecting a Trace and Segments
A trace contains segments (one per service, resource, or logical operation). The trace view shows a timeline with the start time and duration of each segment so you can quickly identify which operations contribute most to latency.
Example segments timeline (trimmed and reformatted for readability):
```text theme={null}
Segments Timeline Info
Name Segment status Response code Duration
▾ Scorekeep AWS::ECS::Container
Scorekeep OK 200 55ms POST http://scorekeep-lb-2109482132.us-east-1.elb.amazonaws.com/api/move/ACHPV0P4/BKQB0F95/IHTNODIB
DynamoDB OK 200 3ms GetItem: scorekeep-game
DynamoDB OK 200 2ms GetItem: scorekeep-state
## Send notification OK - 41ms
SNS OK 200 39ms Publish: arn:aws:sns:us-east-1:841860927337:scorekeep-notifications
DynamoDB OK 200 2ms GetItem: scorekeep-game
DynamoDB OK 200 3ms GetItem: scorekeep-session
DynamoDB OK 200 6ms UpdateItem: scorekeep-game
DynamoDB OK 200 2ms GetItem: scorekeep-game
DynamoDB OK 200 3ms GetItem: scorekeep-session
DynamoDB OK 200 10ms UpdateItem: scorekeep-game
DynamoDB OK 200 3ms GetItem: scorekeep-session
DynamoDB OK 200 2ms GetItem: scorekeep-game
DynamoDB OK 200 6ms UpdateItem: scorekeep-state
DynamoDB OK 200 3ms GetItem: scorekeep-session
DynamoDB OK 200 5ms UpdateItem: scorekeep-move
▾ DynamoDB AWS::DynamoDB::Table
DynamoDB OK 200 3ms GetItem: scorekeep-game
```
Each line shows:
* Segment name and type
* Status (e.g., OK, Fault)
* Response code (HTTP or AWS operation result)
* Duration (milliseconds)
* Operation details (HTTP method/URL or API call and resource)
This makes it easy to spot high-latency operations (for example, a long-running UpdateItem or external HTTP call) and to trace the request flow across services.
 ### Common fields shown in the Traces view
| Field | Meaning | Example |
| - | - | - |
| Trace ID | Unique identifier for a single request end-to-end | `1-5f84c40a-0123456789abcdef01234567` |
| Segment name | Service or resource generating the segment | `Scorekeep` or `DynamoDB` |
| Response code | HTTP status or AWS SDK result | `200`, `500` |
| Status | Indicates OK, Fault, or Error | `OK` |
| Duration | Time spent in that segment | `55ms` |
## Investigating Faults
When a trace contains a fault (e.g., HTTP 500), X-Ray highlights the failing segment and lets you see the call path that led to the error. This helps identify which component failed and which upstream calls preceded it.
Example failing calls:
```text theme={null}
PUT http://scorekeep-lb-2109482132.us-east-1.elb.amazonaws.com/api/game/ACHPV0P4/GJS3FJ6B/rules/null
GetItem: scorekeep-game
GetItem: scorekeep-game
```
Look for:
* The first failing segment in the trace timeline.
* Any related downstream or upstream calls that may have contributed to the fault.
* Error messages or annotations added by your instrumentation (if available).
## Working with All Traces and Building Queries
To view every trace within the selected timeframe, clear the query and run it. You can also build more advanced queries to combine services or to find specific patterns.
Useful query examples:
| Goal | Query |
| - | - |
| Traces for a specific DynamoDB table | `service(id(name: "scorekeep-game", type: "AWS::DynamoDB::Table"))` |
| Traces involving DynamoDB table or SNS topic | `(service(id(name: "scorekeep-game", type: "AWS::DynamoDB::Table"))) OR (service(id(name: "arn:aws:sns:us-east-1:841860927337:scorekeep-notifications", type: "AWS::SNS")))` |
| All traces | (leave the query blank and run) |
Run queries to:
* Filter traces by service, resource ARN, or status.
* Inspect response time distributions for a service.
* Drill into individual traces for segment-level timing and error details.
### Common fields shown in the Traces view
| Field | Meaning | Example |
| - | - | - |
| Trace ID | Unique identifier for a single request end-to-end | `1-5f84c40a-0123456789abcdef01234567` |
| Segment name | Service or resource generating the segment | `Scorekeep` or `DynamoDB` |
| Response code | HTTP status or AWS SDK result | `200`, `500` |
| Status | Indicates OK, Fault, or Error | `OK` |
| Duration | Time spent in that segment | `55ms` |
## Investigating Faults
When a trace contains a fault (e.g., HTTP 500), X-Ray highlights the failing segment and lets you see the call path that led to the error. This helps identify which component failed and which upstream calls preceded it.
Example failing calls:
```text theme={null}
PUT http://scorekeep-lb-2109482132.us-east-1.elb.amazonaws.com/api/game/ACHPV0P4/GJS3FJ6B/rules/null
GetItem: scorekeep-game
GetItem: scorekeep-game
```
Look for:
* The first failing segment in the trace timeline.
* Any related downstream or upstream calls that may have contributed to the fault.
* Error messages or annotations added by your instrumentation (if available).
## Working with All Traces and Building Queries
To view every trace within the selected timeframe, clear the query and run it. You can also build more advanced queries to combine services or to find specific patterns.
Useful query examples:
| Goal | Query |
| - | - |
| Traces for a specific DynamoDB table | `service(id(name: "scorekeep-game", type: "AWS::DynamoDB::Table"))` |
| Traces involving DynamoDB table or SNS topic | `(service(id(name: "scorekeep-game", type: "AWS::DynamoDB::Table"))) OR (service(id(name: "arn:aws:sns:us-east-1:841860927337:scorekeep-notifications", type: "AWS::SNS")))` |
| All traces | (leave the query blank and run) |
Run queries to:
* Filter traces by service, resource ARN, or status.
* Inspect response time distributions for a service.
* Drill into individual traces for segment-level timing and error details.
 ## Summary
AWS X-Ray gives you:
* A Service Map to visualize application topology and to identify nodes of interest.
* A Traces view to investigate per-request segment timelines, durations, response codes and faults.
* A query language to filter traces by service, resource or error conditions.
Key troubleshooting checklist:
* Instrument your app to send traces to X-Ray.
* Use the Service Map to find problematic nodes.
* Inspect Traces and segment timelines to find slow or failing operations.
* Build queries to focus on specific services or combinations of services.
Links and references
* [AWS X-Ray documentation](https://docs.aws.amazon.com/xray/)
* [CloudWatch documentation](https://docs.aws.amazon.com/cloudwatch/)
* [Instrumenting applications for X-Ray (SDKs & integrations)](https://docs.aws.amazon.com/xray/latest/devguide/aws-xray.html)
Hope this lesson was helpful.
This documentation is built and hosted on [Mintlify](https://mintlify.com), a developer documentation platform.
## Summary
AWS X-Ray gives you:
* A Service Map to visualize application topology and to identify nodes of interest.
* A Traces view to investigate per-request segment timelines, durations, response codes and faults.
* A query language to filter traces by service, resource or error conditions.
Key troubleshooting checklist:
* Instrument your app to send traces to X-Ray.
* Use the Service Map to find problematic nodes.
* Inspect Traces and segment timelines to find slow or failing operations.
* Build queries to focus on specific services or combinations of services.
Links and references
* [AWS X-Ray documentation](https://docs.aws.amazon.com/xray/)
* [CloudWatch documentation](https://docs.aws.amazon.com/cloudwatch/)
* [Instrumenting applications for X-Ray (SDKs & integrations)](https://docs.aws.amazon.com/xray/latest/devguide/aws-xray.html)
Hope this lesson was helpful.
This documentation is built and hosted on [Mintlify](https://mintlify.com), a developer documentation platform.