Key CloudWatch Metrics for Lambda Functions
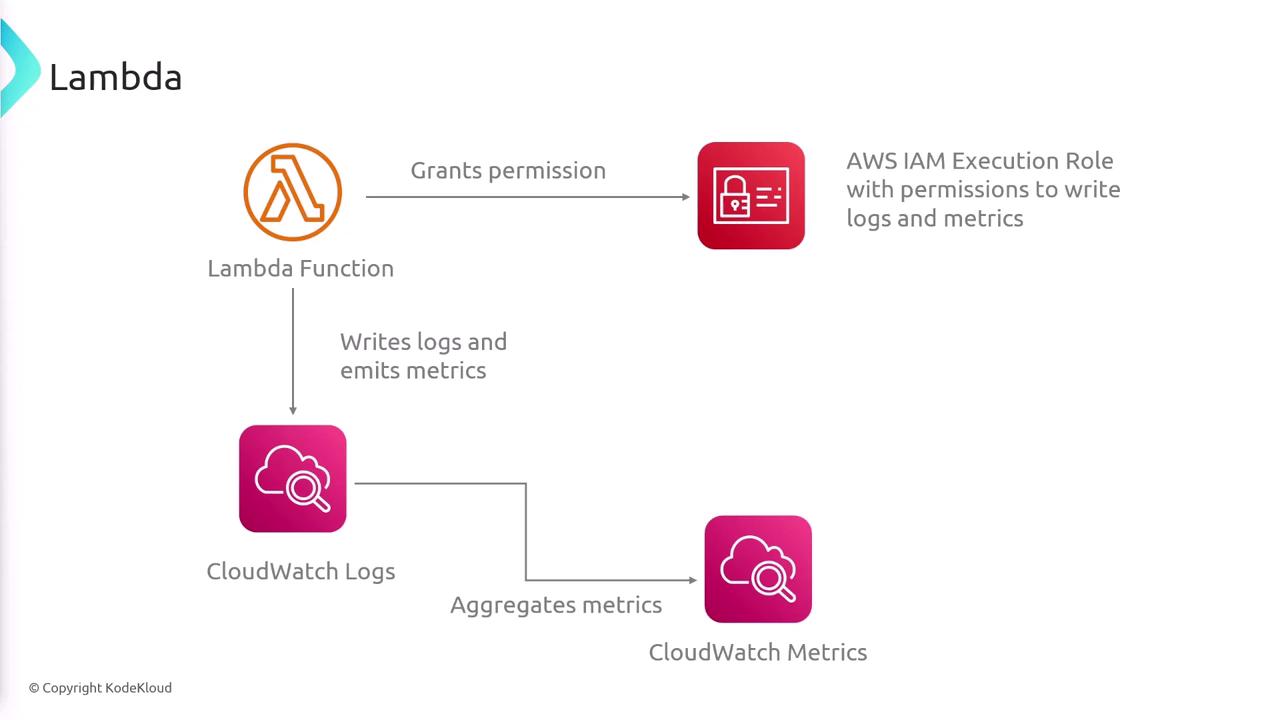
Monitoring your AWS Lambda functions involves keeping an eye on several key metrics provided by CloudWatch. Below are some of the essential metrics:- Invocations: Number of times your Lambda function is triggered.
- Duration: Total running time of your function during each invocation.
- Errors: Count of invocations that resulted in an error.
- Success Rate: Percentage of successful invocations compared to total invocations.
- Throttles: Number of times the function was throttled due to rate limits.
- Concurrent Executions: Number of functions executing simultaneously.
- Async Delivery Failures: For asynchronous invocations, tracks the number of events that failed to deliver.
- Dead Letter Queue Failures: Number of instances where an event could not be redirected to the dead letter queue.
- Additional metrics such as Iterator Age (important for functions triggered by Kinesis or DynamoDB Streams) and Provisioned Concurrency Utilization are also available to provide deeper insights.
Enabling detailed logging and metrics allows you to quickly identify performance bottlenecks or errors, ensuring that you can maintain high availability and efficiency in your applications.
Tracing with AWS X-Ray
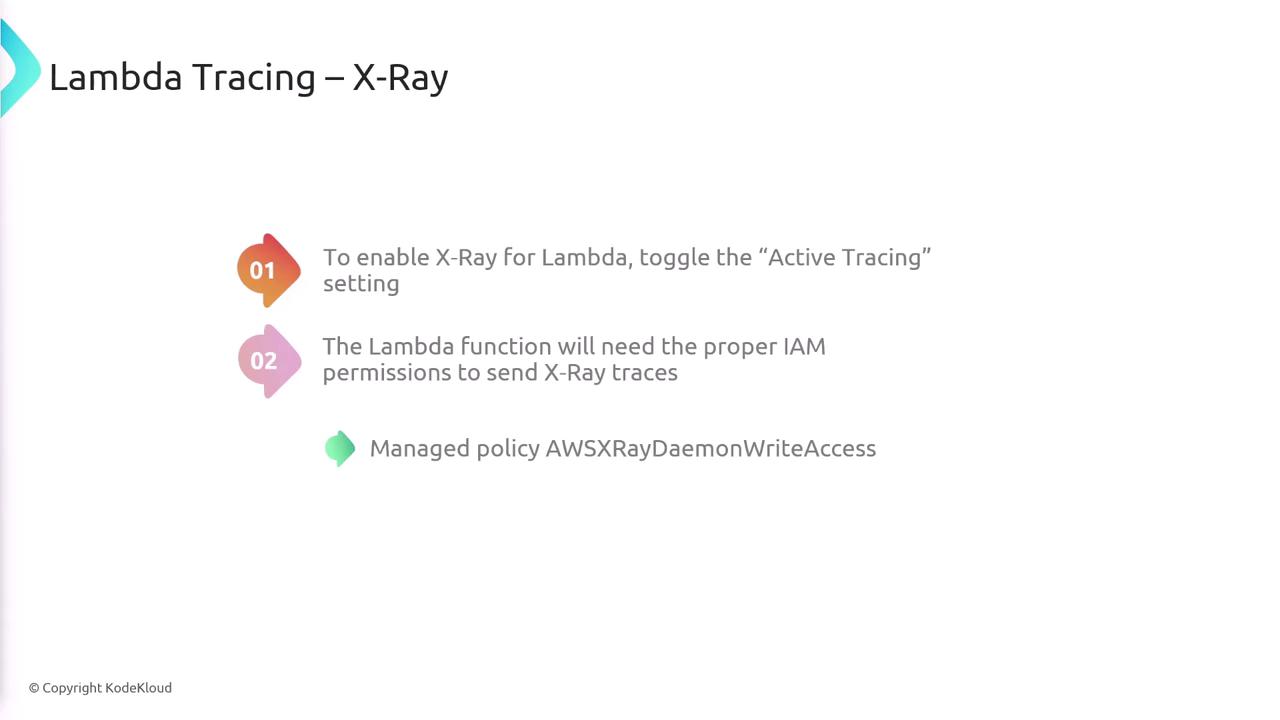
In addition to logging and metrics, tracing is an essential part of the monitoring process for AWS Lambda functions. AWS X-Ray is a powerful service for distributed tracing that provides end-to-end insights into your application’s performance. To enable X-Ray tracing for your Lambda function, follow these steps:- Toggle the Active Tracing setting in your Lambda function configuration.
- Ensure your Lambda function has the appropriate IAM permissions to send trace data to X-Ray. AWS offers a managed policy, AWSXRayDaemonWriteAccess, which grants the necessary permissions.
By integrating AWS X-Ray with your Lambda functions, you can enhance your troubleshooting capabilities and gain detailed insights into the operational flow of your application.