> ## Documentation Index
> Fetch the complete documentation index at: https://notes.kodekloud.com/llms.txt
> Use this file to discover all available pages before exploring further.
# Demo Implementing Data Drift Detection
> Guide to detecting and monitoring data drift with Amazon SageMaker Model Monitor, creating baselines, running statistical checks, and responding to drift in production.
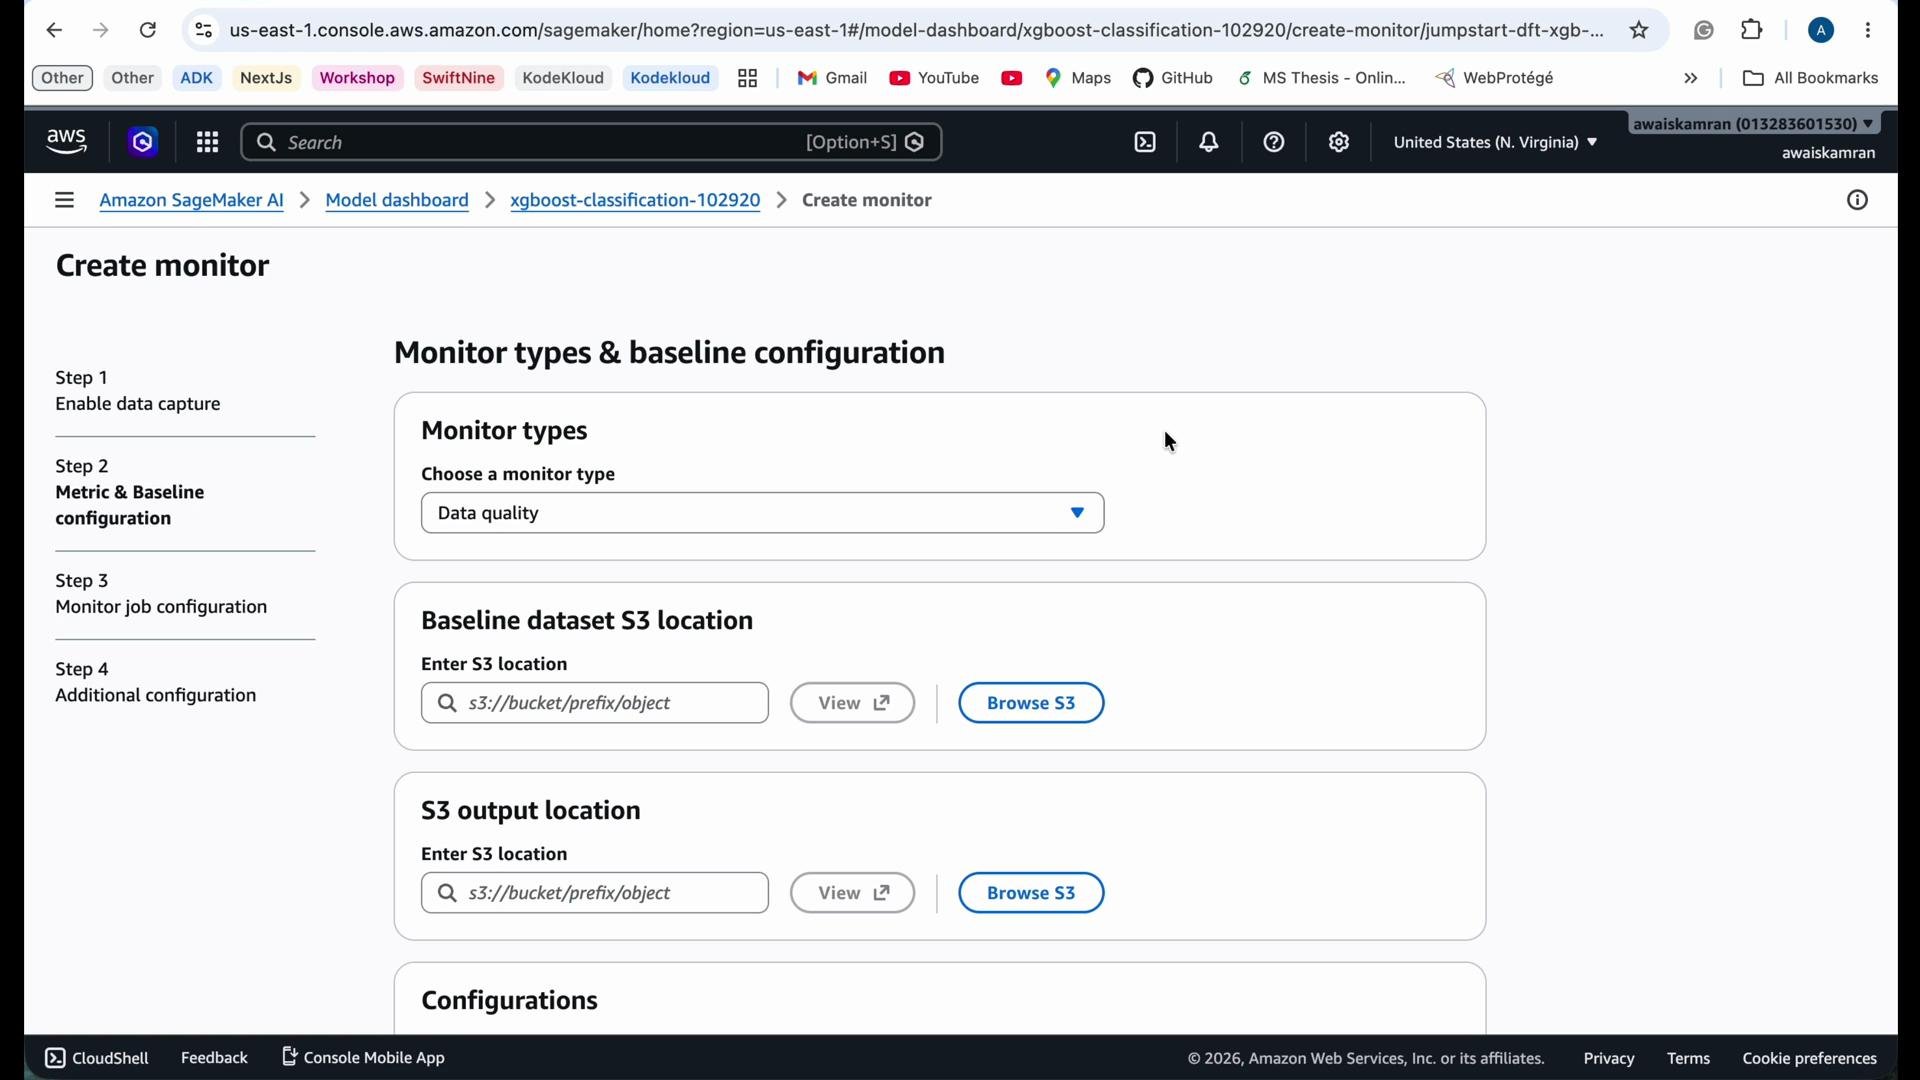
Welcome back. In this lesson we cover data drift: what it is, why it matters, and how to configure a baseline and monitoring so Amazon SageMaker can detect drift in incoming requests. This guide explains the concepts, how SageMaker Model Monitor uses a baseline, and includes a minimal Python example to generate baseline statistics and constraints.
What you'll learn
* What data drift is and how it impacts model quality.
* How to create a representative baseline dataset.
* How SageMaker computes and compares statistics at runtime.
* How to view and act on drift detection results.
## What is data drift and why it matters
Data drift occurs when the distribution or characteristics of incoming data differ significantly from the data that a model was trained on. When requests fall outside the ranges or distributions the model expects, predictions can become unreliable, potentially harming business outcomes.
SageMaker Model Monitor uses a reference distribution — the baseline dataset — to represent expected feature statistics (e.g., ranges, histograms, percentiles). At runtime, Model Monitor computes the same statistics on incoming requests (or a sample) and compares them to the baseline using statistical checks. Significant deviations are flagged as drift so you can investigate and remediate.
 ## How SageMaker Model Monitor uses a baseline
When you provide a baseline dataset (typically an S3 CSV path), SageMaker computes per-feature statistics such as:
* Ranges and percentiles
* Histograms and distributions
* Categorical frequencies
* Missing-value counts
These statistics are stored as baseline statistics and optional constraint files. During monitoring, Model Monitor computes the same statistics on incoming records and runs statistical checks (e.g., population stability index, KS-test) to detect:
* Univariate shifts such as changes in mean or variance
* Categorical distribution shifts (new categories or frequency changes)
* Out-of-range values or increased missingness
If a statistic deviates beyond configured thresholds, Model Monitor marks the check as failed and logs the results.
Provide a representative baseline. The baseline should reflect the expected production distribution (for example, the final processed training data). If the baseline is not representative, Model Monitor will generate misleading drift signals.
## Typical outcomes of drift detection
| Outcome | What it detects | Next steps |
| ----------------------------- | ---------------------------------------------------------- | -------------------------------------------------------------- |
| Univariate shifts | Mean, variance, or percentile changes for numeric features | Investigate data preprocessing or upstream data source changes |
| Categorical shifts | New categories or changed frequency distributions | Map new categories, update encoding, or retrain |
| Out-of-range / missing values | Values falling outside expected ranges or increased nulls | Validate input sanitation, check upstream pipelines |
| Alerts / Logs | Failed checks emitted and results written to S3 | Configure CloudWatch alarms and incident response playbooks |
## Create a baseline programmatically (minimal example)
Use the SageMaker Model Monitor Python SDK to suggest baseline statistics and constraints from an S3 CSV. The example below shows a minimal setup that generates the baseline output in S3.
```python theme={null}
from sagemaker import Session
from sagemaker.model_monitor import DefaultModelMonitor, DatasetFormat
# Initialize session and role
session = Session()
role = "arn:aws:iam::123456789012:role/SageMakerExecutionRole" # replace with your role
# Input baseline CSV and output S3 locations
baseline_input_s3 = "s3://your-bucket/path/to/baseline.csv"
baseline_output_s3 = "s3://your-bucket/path/to/baseline-output/"
# Create a default Model Monitor instance
monitor = DefaultModelMonitor(
role=role,
instance_count=1,
instance_type="ml.m5.xlarge",
sagemaker_session=session,
)
# Suggest baseline statistics and optional constraint files
monitor.suggest_baseline(
baseline_dataset=baseline_input_s3,
dataset_format=DatasetFormat.csv(header=True),
output_s3_uri=baseline_output_s3,
)
```
This call writes baseline statistics and constraints to the specified `baseline_output_s3` location. Use those artifacts when configuring a Monitor Schedule so Model Monitor compares incoming data against this baseline.
## Monitoring schedules and viewing results
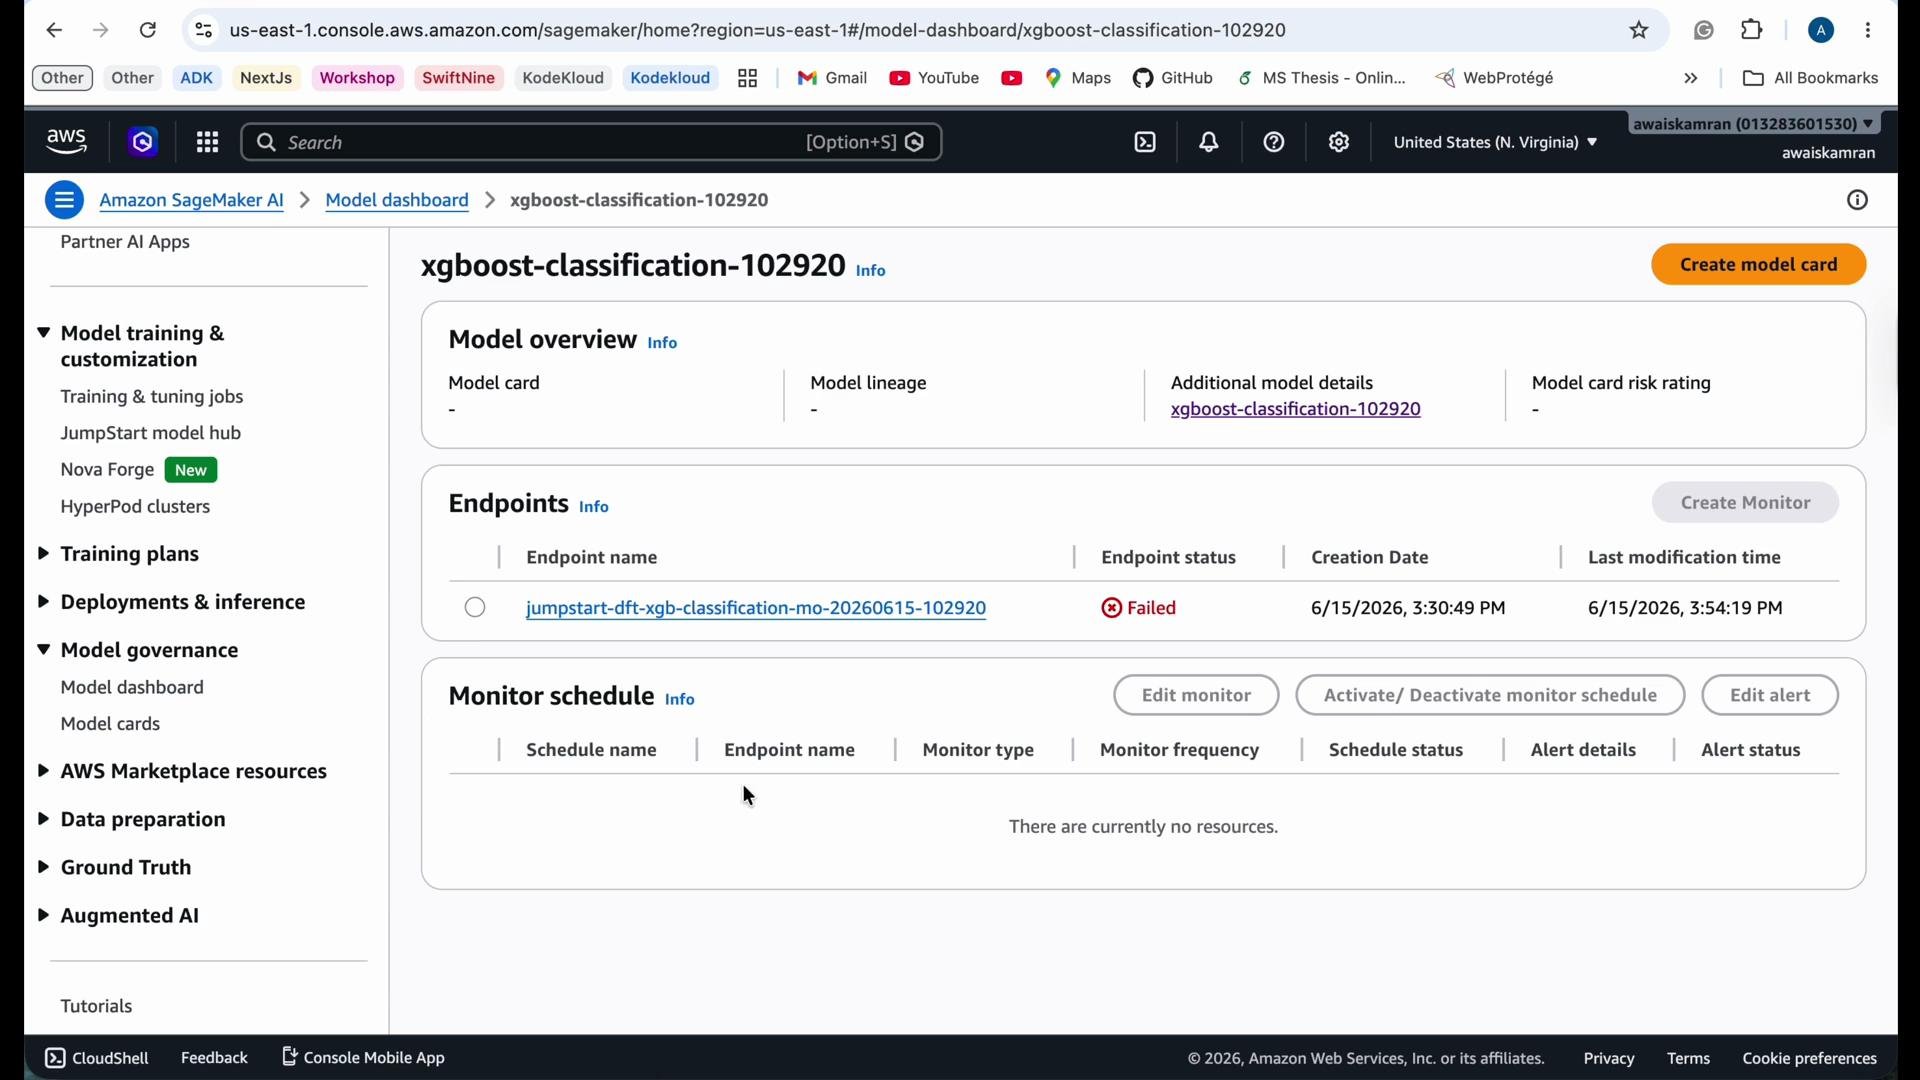
Once a monitor runs (scheduled or continuous for streaming), failed checks and drift summaries are visible in the SageMaker console and Model Monitor dashboard. Open your model’s Monitor Schedule to inspect results and any failed checks. The dashboard also surfaces endpoint health and monitoring schedule status.
## How SageMaker Model Monitor uses a baseline
When you provide a baseline dataset (typically an S3 CSV path), SageMaker computes per-feature statistics such as:
* Ranges and percentiles
* Histograms and distributions
* Categorical frequencies
* Missing-value counts
These statistics are stored as baseline statistics and optional constraint files. During monitoring, Model Monitor computes the same statistics on incoming records and runs statistical checks (e.g., population stability index, KS-test) to detect:
* Univariate shifts such as changes in mean or variance
* Categorical distribution shifts (new categories or frequency changes)
* Out-of-range values or increased missingness
If a statistic deviates beyond configured thresholds, Model Monitor marks the check as failed and logs the results.
Provide a representative baseline. The baseline should reflect the expected production distribution (for example, the final processed training data). If the baseline is not representative, Model Monitor will generate misleading drift signals.
## Typical outcomes of drift detection
| Outcome | What it detects | Next steps |
| ----------------------------- | ---------------------------------------------------------- | -------------------------------------------------------------- |
| Univariate shifts | Mean, variance, or percentile changes for numeric features | Investigate data preprocessing or upstream data source changes |
| Categorical shifts | New categories or changed frequency distributions | Map new categories, update encoding, or retrain |
| Out-of-range / missing values | Values falling outside expected ranges or increased nulls | Validate input sanitation, check upstream pipelines |
| Alerts / Logs | Failed checks emitted and results written to S3 | Configure CloudWatch alarms and incident response playbooks |
## Create a baseline programmatically (minimal example)
Use the SageMaker Model Monitor Python SDK to suggest baseline statistics and constraints from an S3 CSV. The example below shows a minimal setup that generates the baseline output in S3.
```python theme={null}
from sagemaker import Session
from sagemaker.model_monitor import DefaultModelMonitor, DatasetFormat
# Initialize session and role
session = Session()
role = "arn:aws:iam::123456789012:role/SageMakerExecutionRole" # replace with your role
# Input baseline CSV and output S3 locations
baseline_input_s3 = "s3://your-bucket/path/to/baseline.csv"
baseline_output_s3 = "s3://your-bucket/path/to/baseline-output/"
# Create a default Model Monitor instance
monitor = DefaultModelMonitor(
role=role,
instance_count=1,
instance_type="ml.m5.xlarge",
sagemaker_session=session,
)
# Suggest baseline statistics and optional constraint files
monitor.suggest_baseline(
baseline_dataset=baseline_input_s3,
dataset_format=DatasetFormat.csv(header=True),
output_s3_uri=baseline_output_s3,
)
```
This call writes baseline statistics and constraints to the specified `baseline_output_s3` location. Use those artifacts when configuring a Monitor Schedule so Model Monitor compares incoming data against this baseline.
## Monitoring schedules and viewing results
Once a monitor runs (scheduled or continuous for streaming), failed checks and drift summaries are visible in the SageMaker console and Model Monitor dashboard. Open your model’s Monitor Schedule to inspect results and any failed checks. The dashboard also surfaces endpoint health and monitoring schedule status.
 ## Practical tips and best practices
* Use a baseline derived from final, post-processed training data or a stable production sample.
* Choose monitoring frequency based on traffic and tolerance for drift: hourly, daily, or custom cron.
* Tune thresholds for each check to balance sensitivity and false positives.
* Store monitor outputs in S3 and configure CloudWatch alarms for important violations.
* Mask, hash, or avoid storing PII. Use aggregation or synthetic data when possible.
Be careful with sensitive data. If monitoring real user data, ensure compliance with privacy regulations (PII handling, encryption at rest/in transit, least privilege IAM) and consider anonymizing or aggregating fields before storing or analyzing them.
## Where to go from here
* Inspect baseline constraint files and refine checks to fit your production tolerance.
* Automate alarms and remediation: trigger retraining, disable automated decisions, or notify data engineers.
* Combine data drift signals with model performance metrics (ground-truth labels) for end-to-end quality monitoring.
## Links and references
* [Amazon SageMaker Model Monitor documentation](https://docs.aws.amazon.com/sagemaker/latest/dg/model-monitor.html)
* [SageMaker Model Monitor Python SDK (readthedocs)](https://sagemaker.readthedocs.io/en/stable/amazon_sagemaker_model_monitor.html)
* [Amazon S3 documentation](https://docs.aws.amazon.com/s3/index.html)
* [Amazon CloudWatch documentation](https://docs.aws.amazon.com/cloudwatch/)
* [Kubernetes and monitoring best practices — general reference](https://kubernetes.io/docs/concepts/)
By configuring a reliable baseline and a monitoring schedule, SageMaker Model Monitor will report where incoming requests deviate from expected distributions so you can investigate, retrain, or gate predictions to maintain model quality.
## Practical tips and best practices
* Use a baseline derived from final, post-processed training data or a stable production sample.
* Choose monitoring frequency based on traffic and tolerance for drift: hourly, daily, or custom cron.
* Tune thresholds for each check to balance sensitivity and false positives.
* Store monitor outputs in S3 and configure CloudWatch alarms for important violations.
* Mask, hash, or avoid storing PII. Use aggregation or synthetic data when possible.
Be careful with sensitive data. If monitoring real user data, ensure compliance with privacy regulations (PII handling, encryption at rest/in transit, least privilege IAM) and consider anonymizing or aggregating fields before storing or analyzing them.
## Where to go from here
* Inspect baseline constraint files and refine checks to fit your production tolerance.
* Automate alarms and remediation: trigger retraining, disable automated decisions, or notify data engineers.
* Combine data drift signals with model performance metrics (ground-truth labels) for end-to-end quality monitoring.
## Links and references
* [Amazon SageMaker Model Monitor documentation](https://docs.aws.amazon.com/sagemaker/latest/dg/model-monitor.html)
* [SageMaker Model Monitor Python SDK (readthedocs)](https://sagemaker.readthedocs.io/en/stable/amazon_sagemaker_model_monitor.html)
* [Amazon S3 documentation](https://docs.aws.amazon.com/s3/index.html)
* [Amazon CloudWatch documentation](https://docs.aws.amazon.com/cloudwatch/)
* [Kubernetes and monitoring best practices — general reference](https://kubernetes.io/docs/concepts/)
By configuring a reliable baseline and a monitoring schedule, SageMaker Model Monitor will report where incoming requests deviate from expected distributions so you can investigate, retrain, or gate predictions to maintain model quality.