> ## Documentation Index
> Fetch the complete documentation index at: https://notes.kodekloud.com/llms.txt
> Use this file to discover all available pages before exploring further.
# Demo Using CloudWatch for ML Infrastructure Monitoring
> Using AWS CloudWatch to diagnose SageMaker real-time endpoint failures by inspecting logs, metrics, and alarms to identify packaging, import, or resource issues and guide remediation.
AWS CloudWatch is the central hub for logs and metrics in AWS. When a real-time SageMaker endpoint fails, CloudWatch lets you inspect container logs, tracebacks, and operational metrics (CPU, memory, disk, GPU) to root-cause the issue quickly. In this walkthrough we'll inspect a failing SageMaker real-time endpoint from the Model Dashboard, open the associated CloudWatch logs, and use both logs and metrics to identify the failure.
Inspect the model in the SageMaker Model Dashboard and open the model details. The endpoint shows a failure status; to diagnose the cause you should examine:
* The model/container logs (linked from the model page).
* Operational metrics displayed on the dashboard (these are sourced from CloudWatch).
* Any configured alarms or notification triggers.
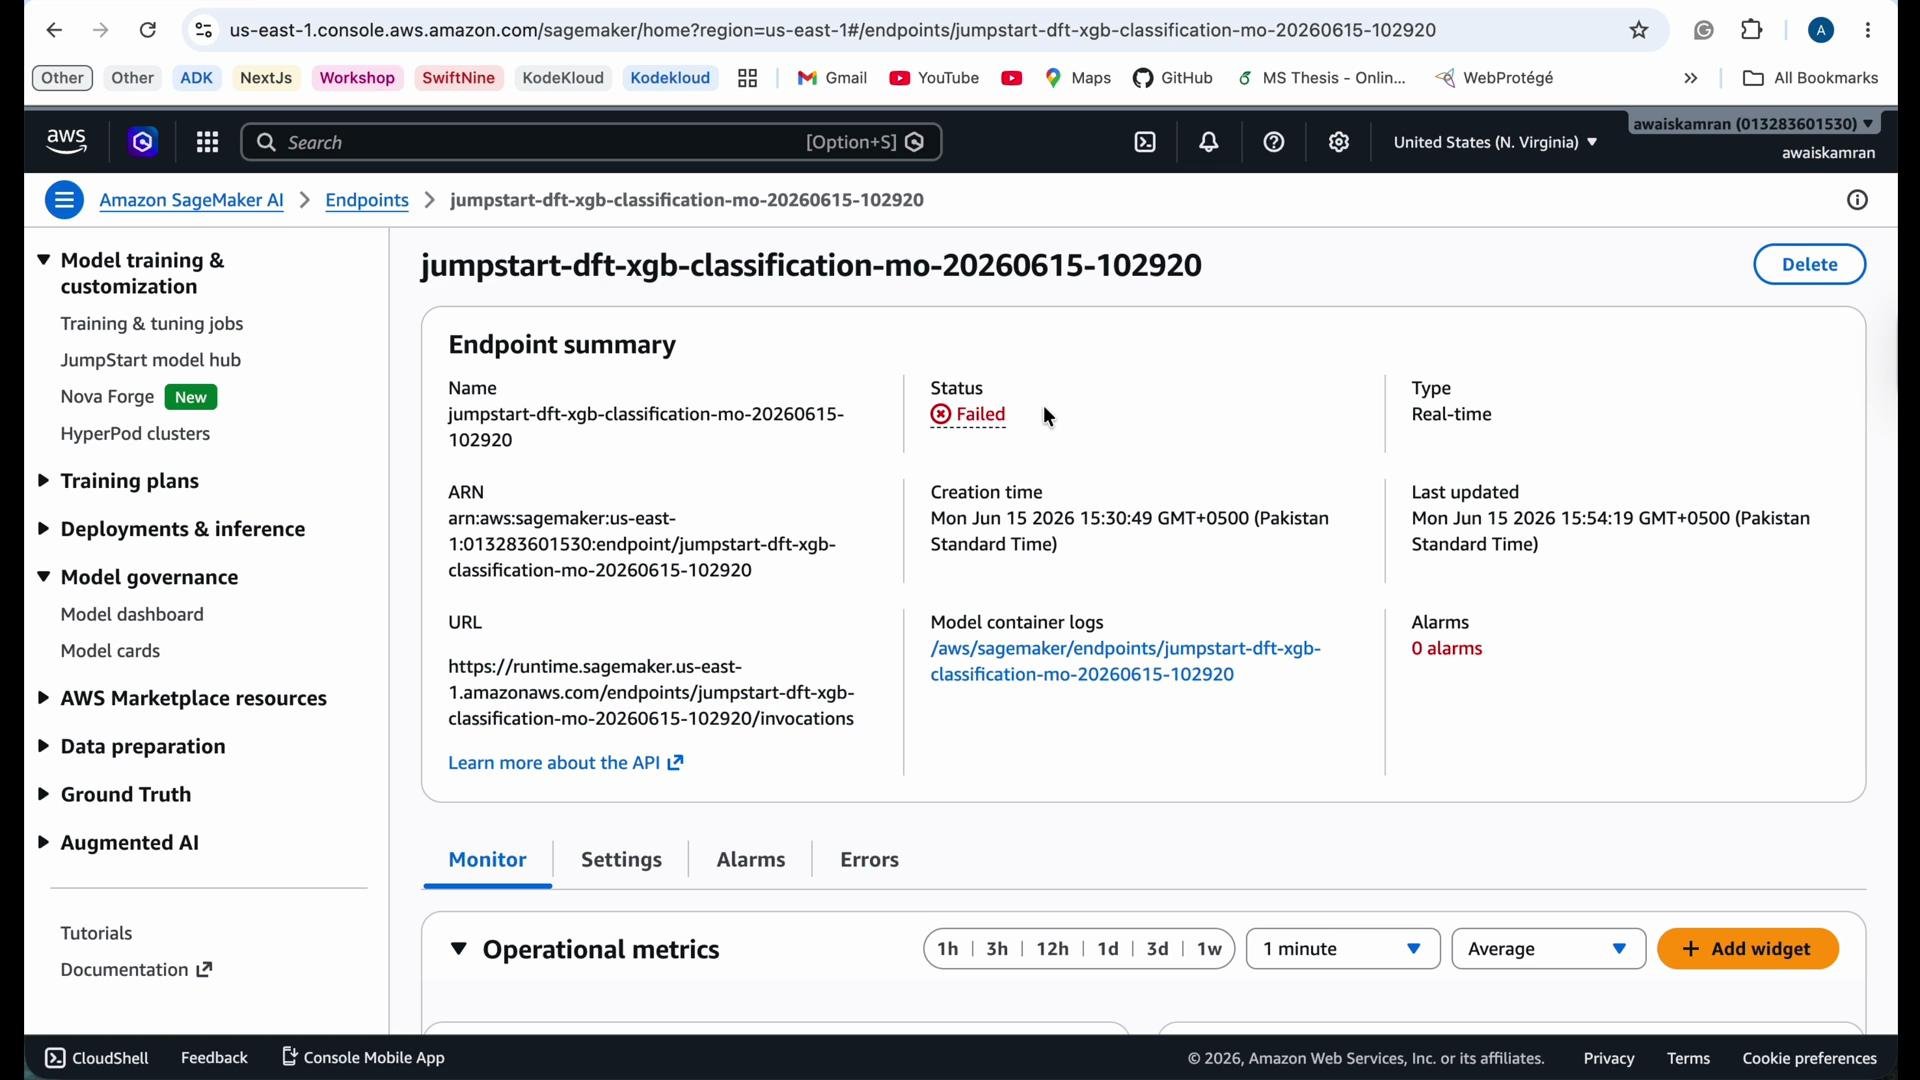 What you’ll typically find on the Model detail page:
* Endpoint name, ARN, and invocation URL.
* Current status (e.g., `Failed`).
* A link to CloudWatch Logs for the endpoint’s log group.
* A monitoring section with charts for `CPUUtilization`, `MemoryUtilization`, `DiskUtilization`, and (if applicable) GPU metrics.
* Controls to create alarms from the displayed metrics.
Step-by-step troubleshooting
1. Open CloudWatch Logs from the Model Dashboard
* Click the CloudWatch Logs link on the model detail page to open the Logs console for the endpoint’s log group.
* Within the log group, open the relevant log stream(s). Logs contain installation, build, and runtime output from the container and the inference server.
2. Inspect logs for tracebacks and warnings
* Scroll the log stream from the time the resource was registered through the failure event and look for Python tracebacks, `ModuleNotFoundError`, or `ImportError`.
* Example container install + runtime log excerpt:
```text theme={null}
/miniconda3/bin/python3 -m pip install .
Processing /opt/ml/code
Preparing metadata (setup.py): started
Preparing metadata (setup.py): finished with status 'done'
Building wheels for collected packages: inference
Building wheel for inference (setup.py): started
Successfully built inference
Installing collected packages: inference
Attempting uninstall: inference
Found existing installation: inference-1.0.0
Successfully installed inference-1.0.0
WARNING: Running pip as the 'root' user can result in broken permissions and conflicting behaviour with the system package manager.
Traceback (most recent call last):
File "/miniconda3/lib/python3.8/site-packages/sagemaker_containers/__init__.py", line 8, in
# (module import attempts)
ModuleNotFoundError: No module named 'inference'
During handling of the above exception, another exception occurred:
Traceback (most recent call last):
File "/miniconda3/bin/serve", line 8, in
sys.exit(serving_entropy)
sagemaker_containers._errors.ImportModuleError: No module named 'inference'
2026/06/15 10:57:51 [crit] 29#29: *1 connect() to unix:/tmp/gunicorn.sock failed (2: No such file or directory) while connecting to upstream, client: 169.254.178.2, request: "GET /ping HTTP/1.1", upstream: "http://unix:/tmp/gunicorn.sock:/", host: "169.254.178.2"
```
Analysis of the example logs
* The root cause is the Python import error: `ModuleNotFoundError: No module named 'inference'`. This means the runtime cannot find the package the server expects.
* Common causes:
* The package was installed into a different environment or path.
* `setup.py` has incorrect package/module names or `packages`/`py_modules` are mis-specified.
* The container image or build artifact does not include the expected module.
* The Nginx/Gunicorn error `connect() to unix:/tmp/gunicorn.sock failed` is a downstream symptom: the inference server never started, so the Nginx proxy failed to connect to the application socket and returned upstream errors.
Avoid installing packages as root inside your container where possible. Packaging or installation problems are a common cause of `ModuleNotFoundError` at runtime. Verify your `setup.py` and package layout, and ensure the module is present in the container image or in the build artifact that SageMaker uses.
3. Narrow the time range and filter logs
* Use CloudWatch’s time-range selector to focus on the minute/hour surrounding the failure.
* Change display formats (expanded rows, plain text) and export logs if required.
* Logs Insights can speed up searching across many log streams.
Logs Insights example
* Basic Logs Insights query to list recent events in the selected log group:
```text theme={null}
fields @timestamp, @message
| sort @timestamp desc
| limit 10000
```
* Use the Logs Insights editor in the CloudWatch console to refine queries by search terms, fields, or parsing rules to zero in on specific error messages, IPs, or request IDs.
4. Check Metrics (CPU / Memory / Disk / GPU)
* Correlate resource metrics with log timestamps. High memory or disk contention can cause processes to crash or fail to start.
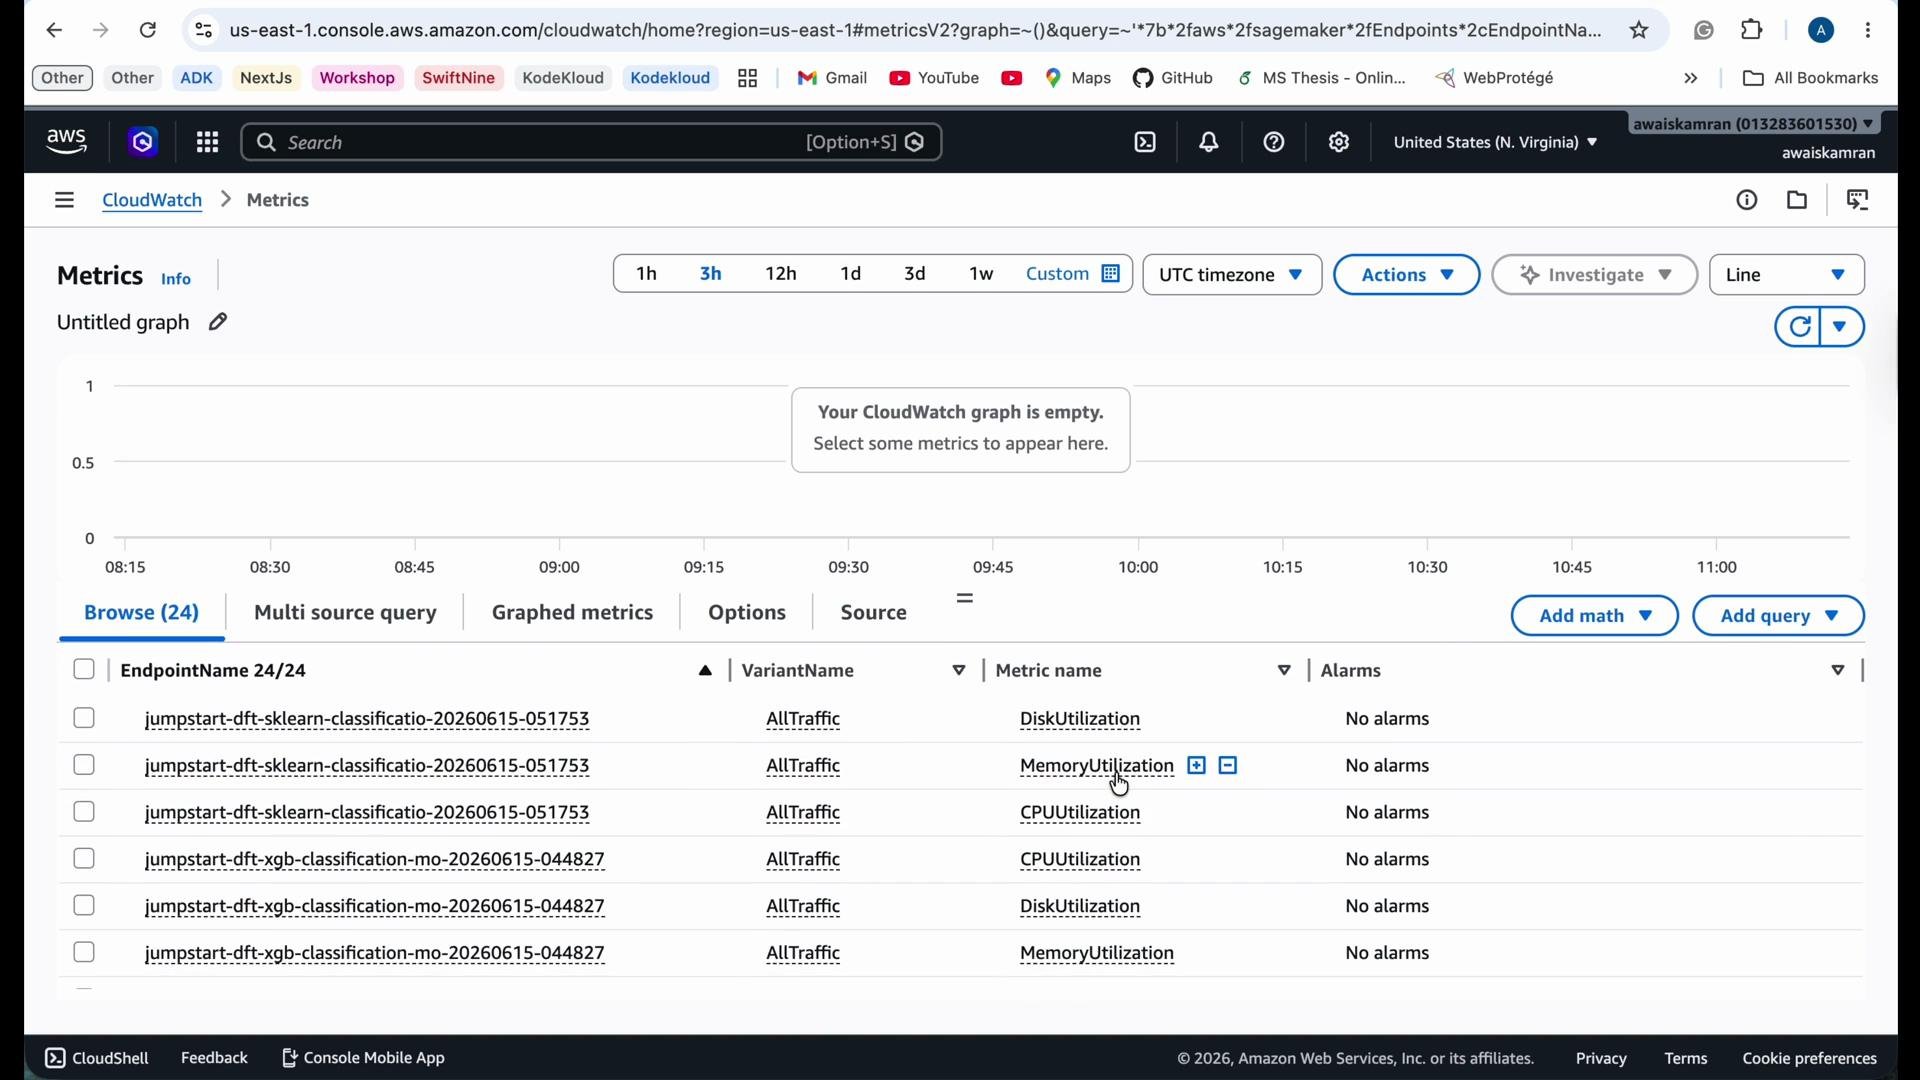
* Use CloudWatch Metrics charts for `DiskUtilization`, `MemoryUtilization`, and `CPUUtilization` to identify anomalies that coincide with the error.
What you’ll typically find on the Model detail page:
* Endpoint name, ARN, and invocation URL.
* Current status (e.g., `Failed`).
* A link to CloudWatch Logs for the endpoint’s log group.
* A monitoring section with charts for `CPUUtilization`, `MemoryUtilization`, `DiskUtilization`, and (if applicable) GPU metrics.
* Controls to create alarms from the displayed metrics.
Step-by-step troubleshooting
1. Open CloudWatch Logs from the Model Dashboard
* Click the CloudWatch Logs link on the model detail page to open the Logs console for the endpoint’s log group.
* Within the log group, open the relevant log stream(s). Logs contain installation, build, and runtime output from the container and the inference server.
2. Inspect logs for tracebacks and warnings
* Scroll the log stream from the time the resource was registered through the failure event and look for Python tracebacks, `ModuleNotFoundError`, or `ImportError`.
* Example container install + runtime log excerpt:
```text theme={null}
/miniconda3/bin/python3 -m pip install .
Processing /opt/ml/code
Preparing metadata (setup.py): started
Preparing metadata (setup.py): finished with status 'done'
Building wheels for collected packages: inference
Building wheel for inference (setup.py): started
Successfully built inference
Installing collected packages: inference
Attempting uninstall: inference
Found existing installation: inference-1.0.0
Successfully installed inference-1.0.0
WARNING: Running pip as the 'root' user can result in broken permissions and conflicting behaviour with the system package manager.
Traceback (most recent call last):
File "/miniconda3/lib/python3.8/site-packages/sagemaker_containers/__init__.py", line 8, in
# (module import attempts)
ModuleNotFoundError: No module named 'inference'
During handling of the above exception, another exception occurred:
Traceback (most recent call last):
File "/miniconda3/bin/serve", line 8, in
sys.exit(serving_entropy)
sagemaker_containers._errors.ImportModuleError: No module named 'inference'
2026/06/15 10:57:51 [crit] 29#29: *1 connect() to unix:/tmp/gunicorn.sock failed (2: No such file or directory) while connecting to upstream, client: 169.254.178.2, request: "GET /ping HTTP/1.1", upstream: "http://unix:/tmp/gunicorn.sock:/", host: "169.254.178.2"
```
Analysis of the example logs
* The root cause is the Python import error: `ModuleNotFoundError: No module named 'inference'`. This means the runtime cannot find the package the server expects.
* Common causes:
* The package was installed into a different environment or path.
* `setup.py` has incorrect package/module names or `packages`/`py_modules` are mis-specified.
* The container image or build artifact does not include the expected module.
* The Nginx/Gunicorn error `connect() to unix:/tmp/gunicorn.sock failed` is a downstream symptom: the inference server never started, so the Nginx proxy failed to connect to the application socket and returned upstream errors.
Avoid installing packages as root inside your container where possible. Packaging or installation problems are a common cause of `ModuleNotFoundError` at runtime. Verify your `setup.py` and package layout, and ensure the module is present in the container image or in the build artifact that SageMaker uses.
3. Narrow the time range and filter logs
* Use CloudWatch’s time-range selector to focus on the minute/hour surrounding the failure.
* Change display formats (expanded rows, plain text) and export logs if required.
* Logs Insights can speed up searching across many log streams.
Logs Insights example
* Basic Logs Insights query to list recent events in the selected log group:
```text theme={null}
fields @timestamp, @message
| sort @timestamp desc
| limit 10000
```
* Use the Logs Insights editor in the CloudWatch console to refine queries by search terms, fields, or parsing rules to zero in on specific error messages, IPs, or request IDs.
4. Check Metrics (CPU / Memory / Disk / GPU)
* Correlate resource metrics with log timestamps. High memory or disk contention can cause processes to crash or fail to start.
* Use CloudWatch Metrics charts for `DiskUtilization`, `MemoryUtilization`, and `CPUUtilization` to identify anomalies that coincide with the error.
 Example NGINX configuration (common in SageMaker inference containers)
* If your endpoint uses Nginx as a front proxy to Gunicorn, you may see related config and errors in logs. A minimal Nginx snippet used by some SageMaker containers:
```nginx theme={null}
worker_processes auto;
daemon off;
pid /tmp/nginx.pid;
error_log /dev/stderr;
worker_rlimit_nofile 4096;
events {
worker_connections 2048;
}
```
Troubleshooting checklist (quick reference)
| Step | Action | Why it helps |
| ---- | ---------------------------------------------------------------- | --------------------------------------------------------------------------------- |
| 1 | Open the Model Dashboard and click the CloudWatch Logs link | Direct access to the endpoint log group for detailed runtime output |
| 2 | Inspect recent log streams for tracebacks and warnings | Find Python exceptions, missing modules, or startup failures |
| 3 | Narrow the time range to the failure window | Focus on the events that triggered the failure |
| 4 | Search logs for packaging/import errors and proxy/socket errors | Identify root causes like `ModuleNotFoundError` or Nginx/Gunicorn socket failures |
| 5 | Use CloudWatch Metrics & Alarms (CPU/Memory/Disk/GPU) | Correlate resource utilization with failures and detect anomalies early |
| 6 | Fix the package layout or container image, rebuild, and redeploy | Ensure the runtime has the correct modules and environment to start successfully |
Additional tips
* Rebuild and test your container locally (or in a CI pipeline) to confirm all packages are installed and imports succeed.
* Ensure `setup.py` accurately lists packages or use `pyproject.toml` with a modern build backend if appropriate.
* Avoid running `pip install` as `root` in production images; instead, use a dedicated virtual environment or ensure correct file ownership and permissions.
Links and References
* \[AWS CloudWatch — Course] ([https://learn.kodekloud.com/user/courses/aws-cloudwatch](https://learn.kodekloud.com/user/courses/aws-cloudwatch))
* \[AWS SageMaker — Course] ([https://learn.kodekloud.com/user/courses/aws-sagemaker](https://learn.kodekloud.com/user/courses/aws-sagemaker))
* \[NGINX for Beginners — Course] ([https://learn.kodekloud.com/user/courses/nginx-for-beginners](https://learn.kodekloud.com/user/courses/nginx-for-beginners))
* [Gunicorn documentation](https://gunicorn.org/)
Use this guide to quickly identify whether an endpoint failure is caused by packaging/import issues, server startup failures, or resource exhaustion, and to apply a corrective rebuild and redeploy workflow.
Example NGINX configuration (common in SageMaker inference containers)
* If your endpoint uses Nginx as a front proxy to Gunicorn, you may see related config and errors in logs. A minimal Nginx snippet used by some SageMaker containers:
```nginx theme={null}
worker_processes auto;
daemon off;
pid /tmp/nginx.pid;
error_log /dev/stderr;
worker_rlimit_nofile 4096;
events {
worker_connections 2048;
}
```
Troubleshooting checklist (quick reference)
| Step | Action | Why it helps |
| ---- | ---------------------------------------------------------------- | --------------------------------------------------------------------------------- |
| 1 | Open the Model Dashboard and click the CloudWatch Logs link | Direct access to the endpoint log group for detailed runtime output |
| 2 | Inspect recent log streams for tracebacks and warnings | Find Python exceptions, missing modules, or startup failures |
| 3 | Narrow the time range to the failure window | Focus on the events that triggered the failure |
| 4 | Search logs for packaging/import errors and proxy/socket errors | Identify root causes like `ModuleNotFoundError` or Nginx/Gunicorn socket failures |
| 5 | Use CloudWatch Metrics & Alarms (CPU/Memory/Disk/GPU) | Correlate resource utilization with failures and detect anomalies early |
| 6 | Fix the package layout or container image, rebuild, and redeploy | Ensure the runtime has the correct modules and environment to start successfully |
Additional tips
* Rebuild and test your container locally (or in a CI pipeline) to confirm all packages are installed and imports succeed.
* Ensure `setup.py` accurately lists packages or use `pyproject.toml` with a modern build backend if appropriate.
* Avoid running `pip install` as `root` in production images; instead, use a dedicated virtual environment or ensure correct file ownership and permissions.
Links and References
* \[AWS CloudWatch — Course] ([https://learn.kodekloud.com/user/courses/aws-cloudwatch](https://learn.kodekloud.com/user/courses/aws-cloudwatch))
* \[AWS SageMaker — Course] ([https://learn.kodekloud.com/user/courses/aws-sagemaker](https://learn.kodekloud.com/user/courses/aws-sagemaker))
* \[NGINX for Beginners — Course] ([https://learn.kodekloud.com/user/courses/nginx-for-beginners](https://learn.kodekloud.com/user/courses/nginx-for-beginners))
* [Gunicorn documentation](https://gunicorn.org/)
Use this guide to quickly identify whether an endpoint failure is caused by packaging/import issues, server startup failures, or resource exhaustion, and to apply a corrective rebuild and redeploy workflow.