> ## Documentation Index
> Fetch the complete documentation index at: https://notes.kodekloud.com/llms.txt
> Use this file to discover all available pages before exploring further.
# Model Performance Monitoring Techniques
> Monitoring and maintaining ML model performance on AWS using SageMaker, CloudWatch, CI/CD, automation, drift detection, alerting, and secure retraining pipelines.
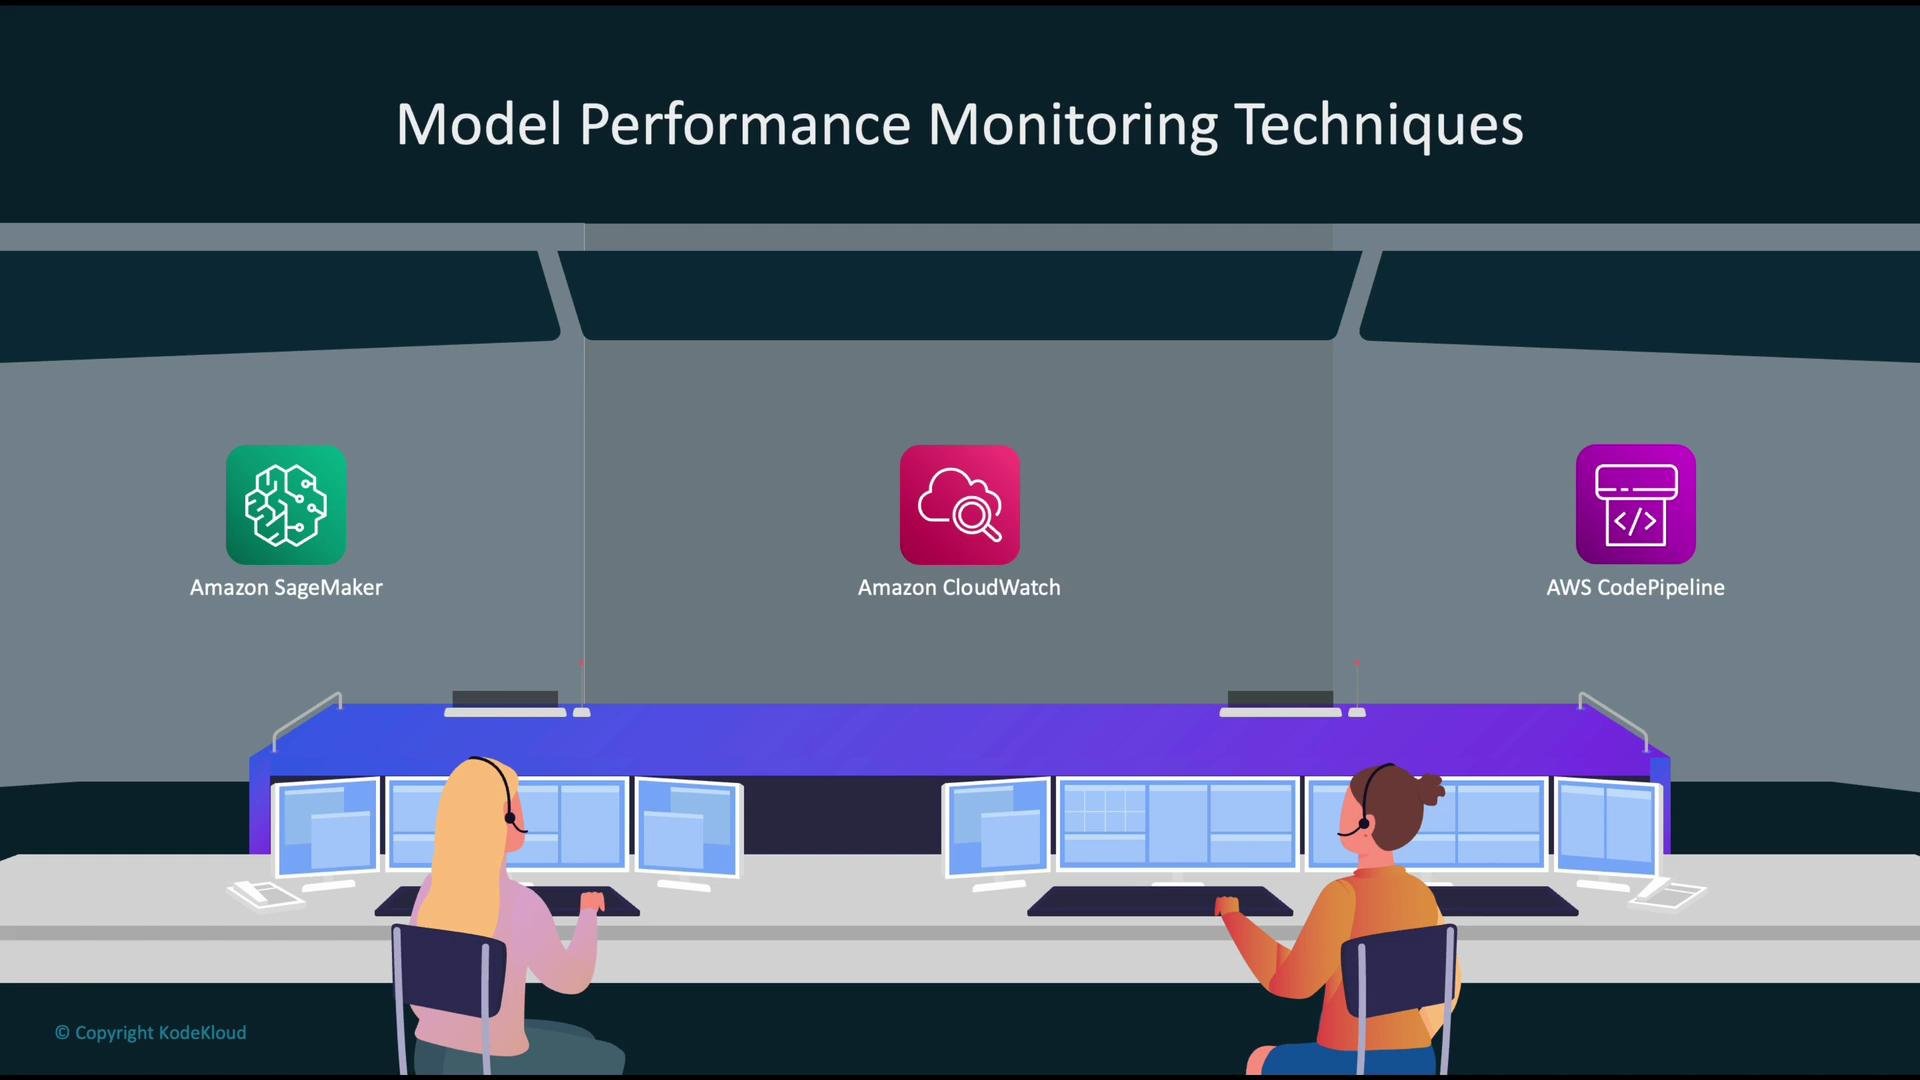
In this lesson we cover practical techniques for monitoring machine learning models in production. Effective model monitoring blends automated pipelines, real-time observability, and model-level telemetry to detect and respond to performance degradation, data drift, and operational issues. On AWS, common services used together include:
* [Amazon SageMaker (Model Monitor)](https://docs.aws.amazon.com/sagemaker/latest/dg/model-monitor.html) — model-specific monitoring (data drift, prediction drift, distribution changes).
* [Amazon CloudWatch](https://aws.amazon.com/cloudwatch/) — centralized metrics, dashboards, logs, traces, and alarms.
* [AWS CodePipeline](https://aws.amazon.com/codepipeline/) and related DevOps services — automate retraining, testing, and redeployment as part of an MLOps workflow.
 Core monitoring approaches to adopt in production:
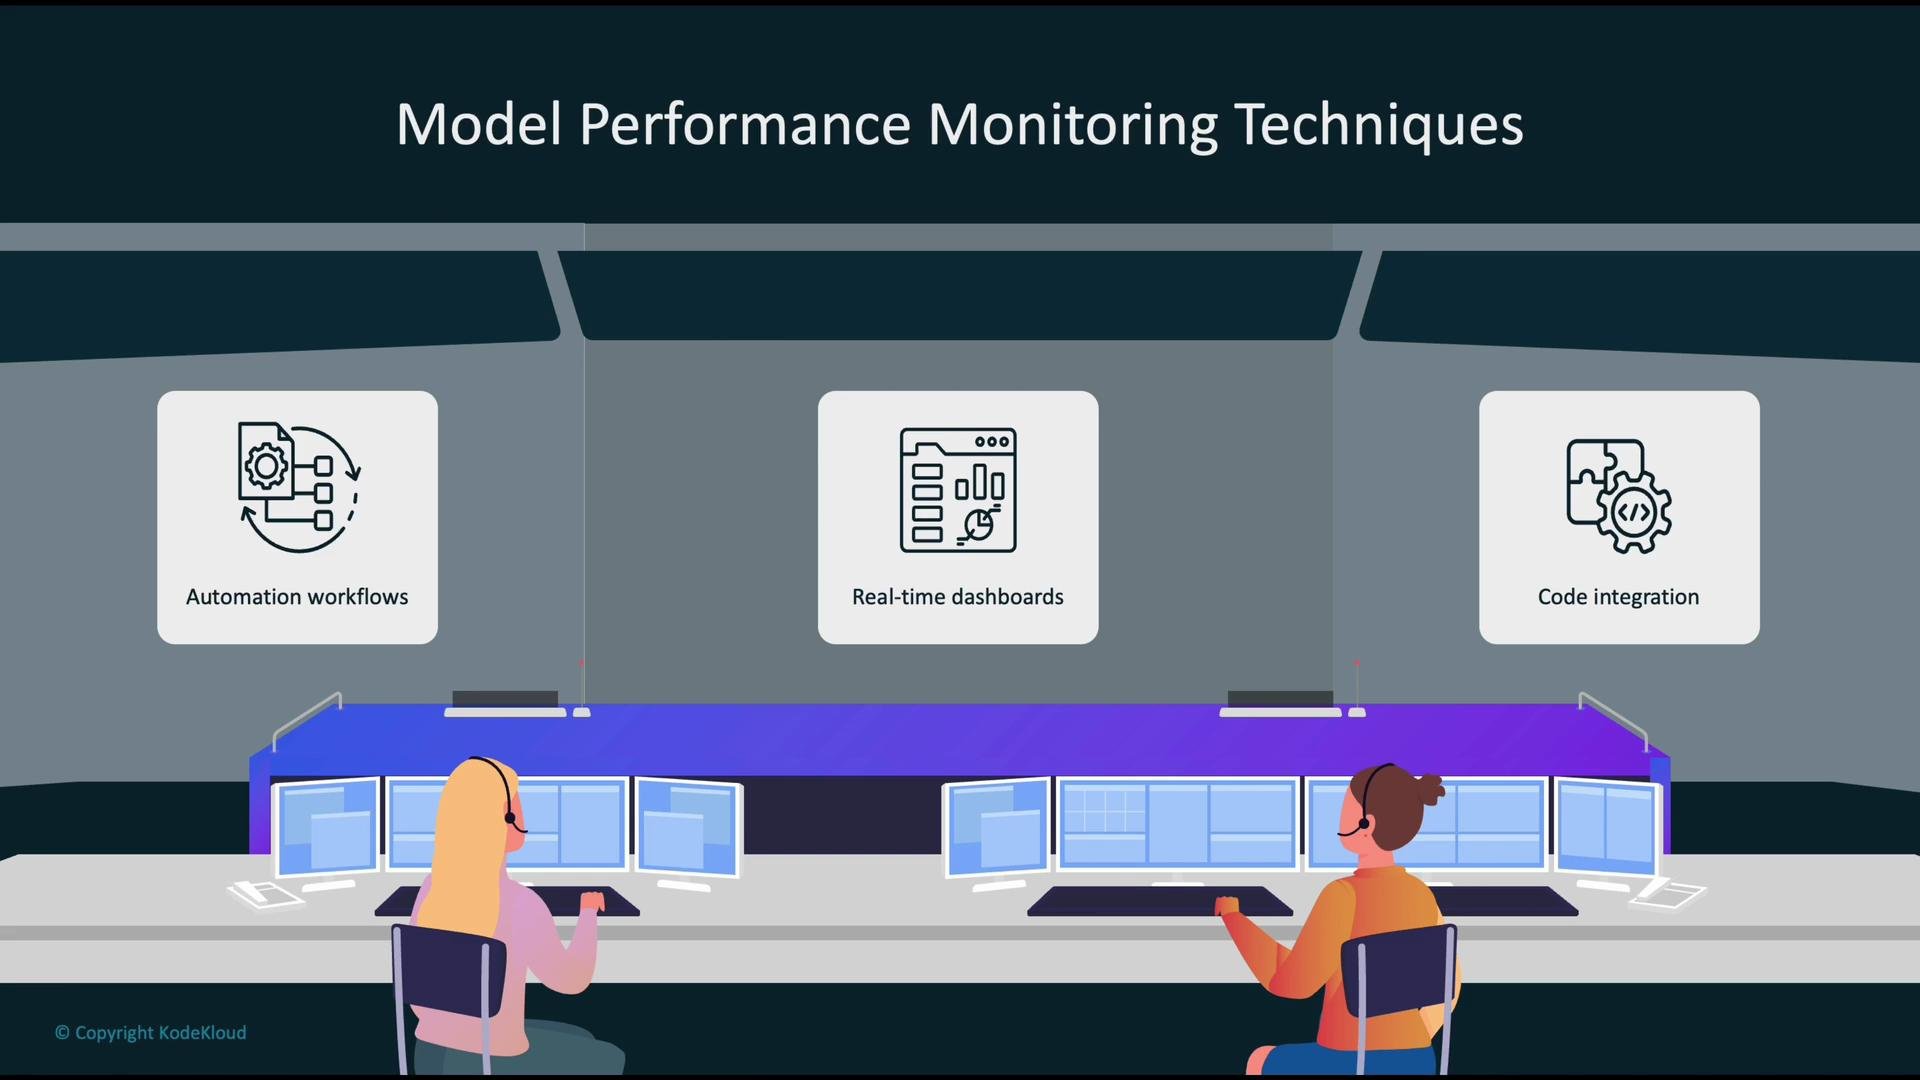
1. Automation workflows that continuously evaluate model performance, raise alerts, and trigger retraining or rollback when needed.
2. Real-time dashboards that display critical KPIs and health signals for rapid situational awareness.
3. Code-level integration to collect fine-grained telemetry (inputs, predictions, latency) for diagnostics and root-cause analysis.
Core monitoring approaches to adopt in production:
1. Automation workflows that continuously evaluate model performance, raise alerts, and trigger retraining or rollback when needed.
2. Real-time dashboards that display critical KPIs and health signals for rapid situational awareness.
3. Code-level integration to collect fine-grained telemetry (inputs, predictions, latency) for diagnostics and root-cause analysis.
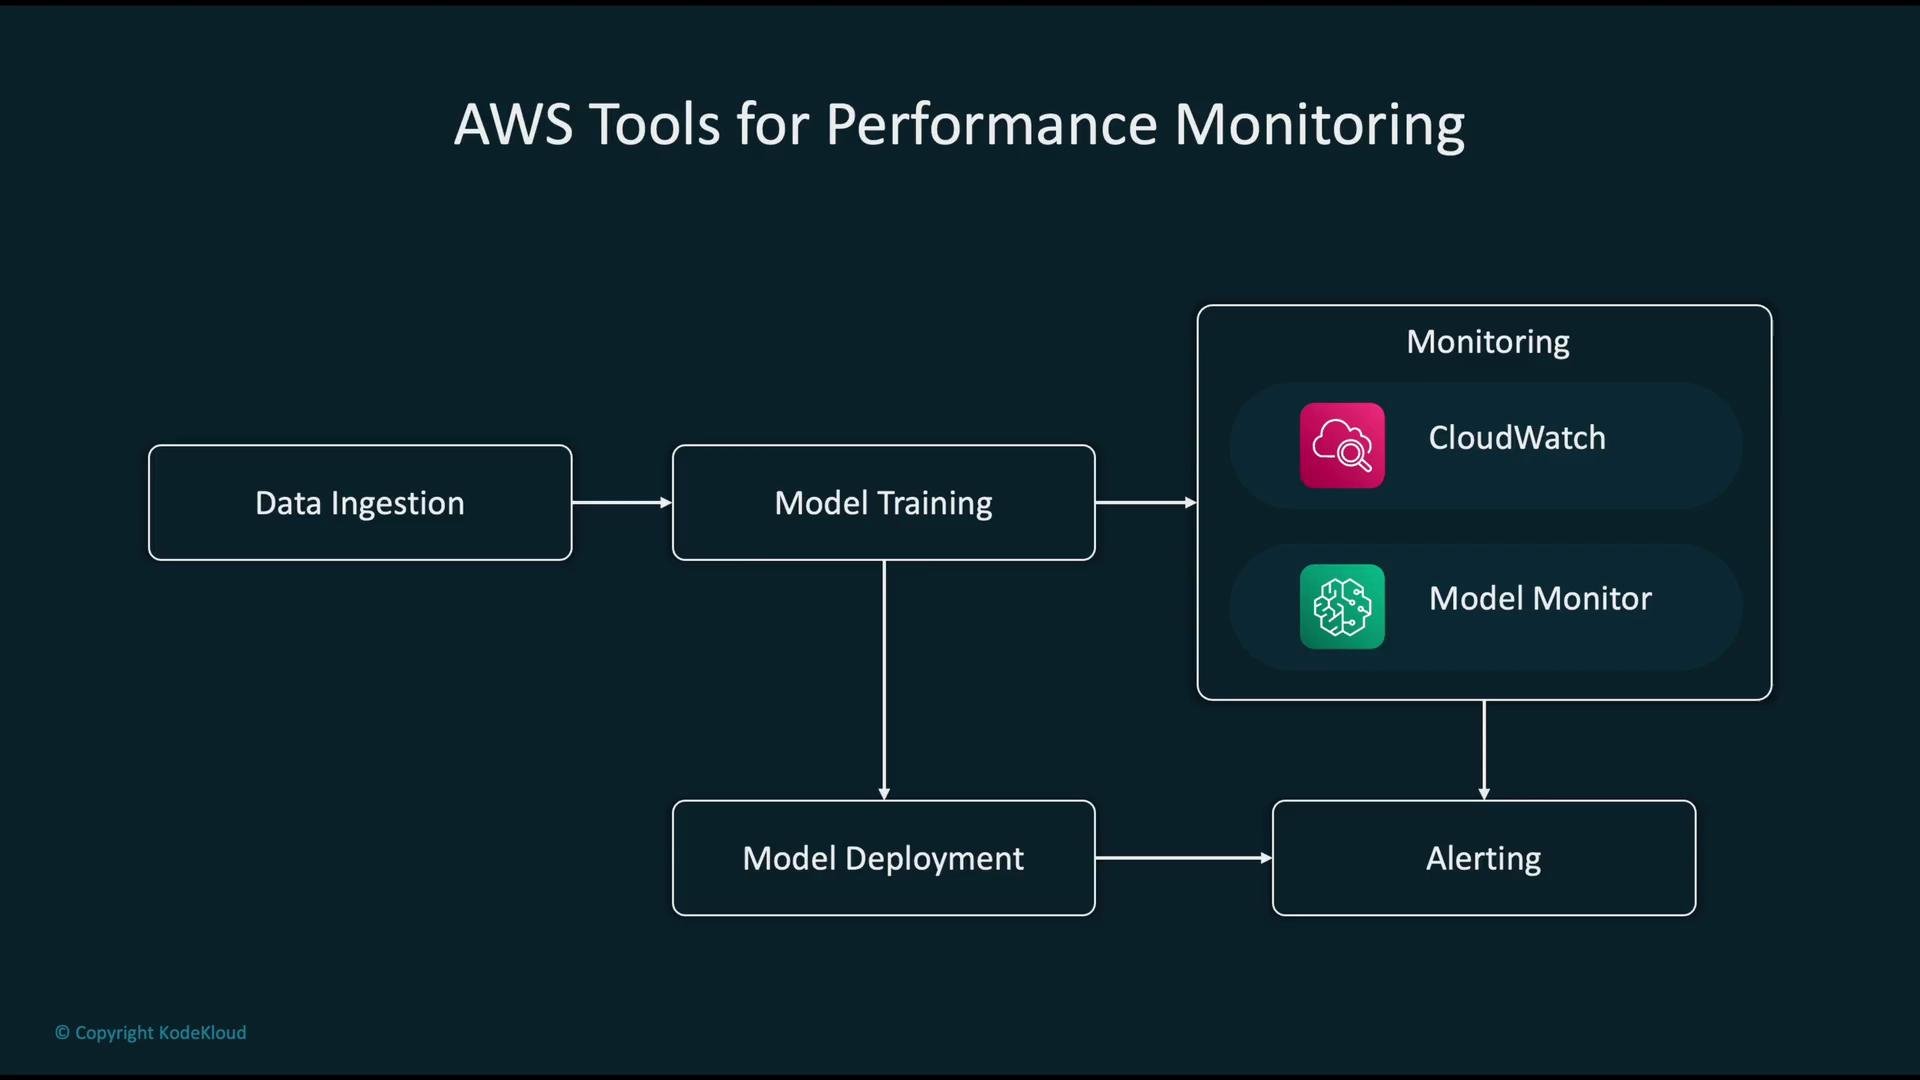
 When monitoring ML workloads on AWS, Model Monitor and CloudWatch are typically paired. Below is a concise mapping of each service to typical use cases.
| AWS Service | Primary Use Case | Notes / Example |
| --------------------------------------------------------------------------------------------- | --------------------------------------------------------- | ------------------------------------------------------------------------------------------------ |
| [Amazon CloudWatch](https://aws.amazon.com/cloudwatch/) | General observability — dashboards, metrics, logs, alarms | Visualize endpoint invocations, latency, error rates; publish custom metrics (e.g., token usage) |
| [SageMaker Model Monitor](https://docs.aws.amazon.com/sagemaker/latest/dg/model-monitor.html) | Model-specific drift and quality monitoring | Detect input distribution changes, label drift, prediction-skew; emits metrics to CloudWatch |
| [AWS CodePipeline / CodeBuild](https://aws.amazon.com/codepipeline/) | CI/CD for models and ML pipelines | Automate training, testing, registry promotion, and safe rollout gates |
| [Amazon S3](https://aws.amazon.com/s3/) | Artifact and telemetry storage | Store model artifacts, dataset snapshots, serialized baseline statistics |
A typical ML lifecycle with monitoring integrated: data ingestion → model training → deployment → monitoring → alerting → (automated) retraining.
When monitoring ML workloads on AWS, Model Monitor and CloudWatch are typically paired. Below is a concise mapping of each service to typical use cases.
| AWS Service | Primary Use Case | Notes / Example |
| --------------------------------------------------------------------------------------------- | --------------------------------------------------------- | ------------------------------------------------------------------------------------------------ |
| [Amazon CloudWatch](https://aws.amazon.com/cloudwatch/) | General observability — dashboards, metrics, logs, alarms | Visualize endpoint invocations, latency, error rates; publish custom metrics (e.g., token usage) |
| [SageMaker Model Monitor](https://docs.aws.amazon.com/sagemaker/latest/dg/model-monitor.html) | Model-specific drift and quality monitoring | Detect input distribution changes, label drift, prediction-skew; emits metrics to CloudWatch |
| [AWS CodePipeline / CodeBuild](https://aws.amazon.com/codepipeline/) | CI/CD for models and ML pipelines | Automate training, testing, registry promotion, and safe rollout gates |
| [Amazon S3](https://aws.amazon.com/s3/) | Artifact and telemetry storage | Store model artifacts, dataset snapshots, serialized baseline statistics |
A typical ML lifecycle with monitoring integrated: data ingestion → model training → deployment → monitoring → alerting → (automated) retraining.
 CloudWatch-centric production monitoring (practical workflow):
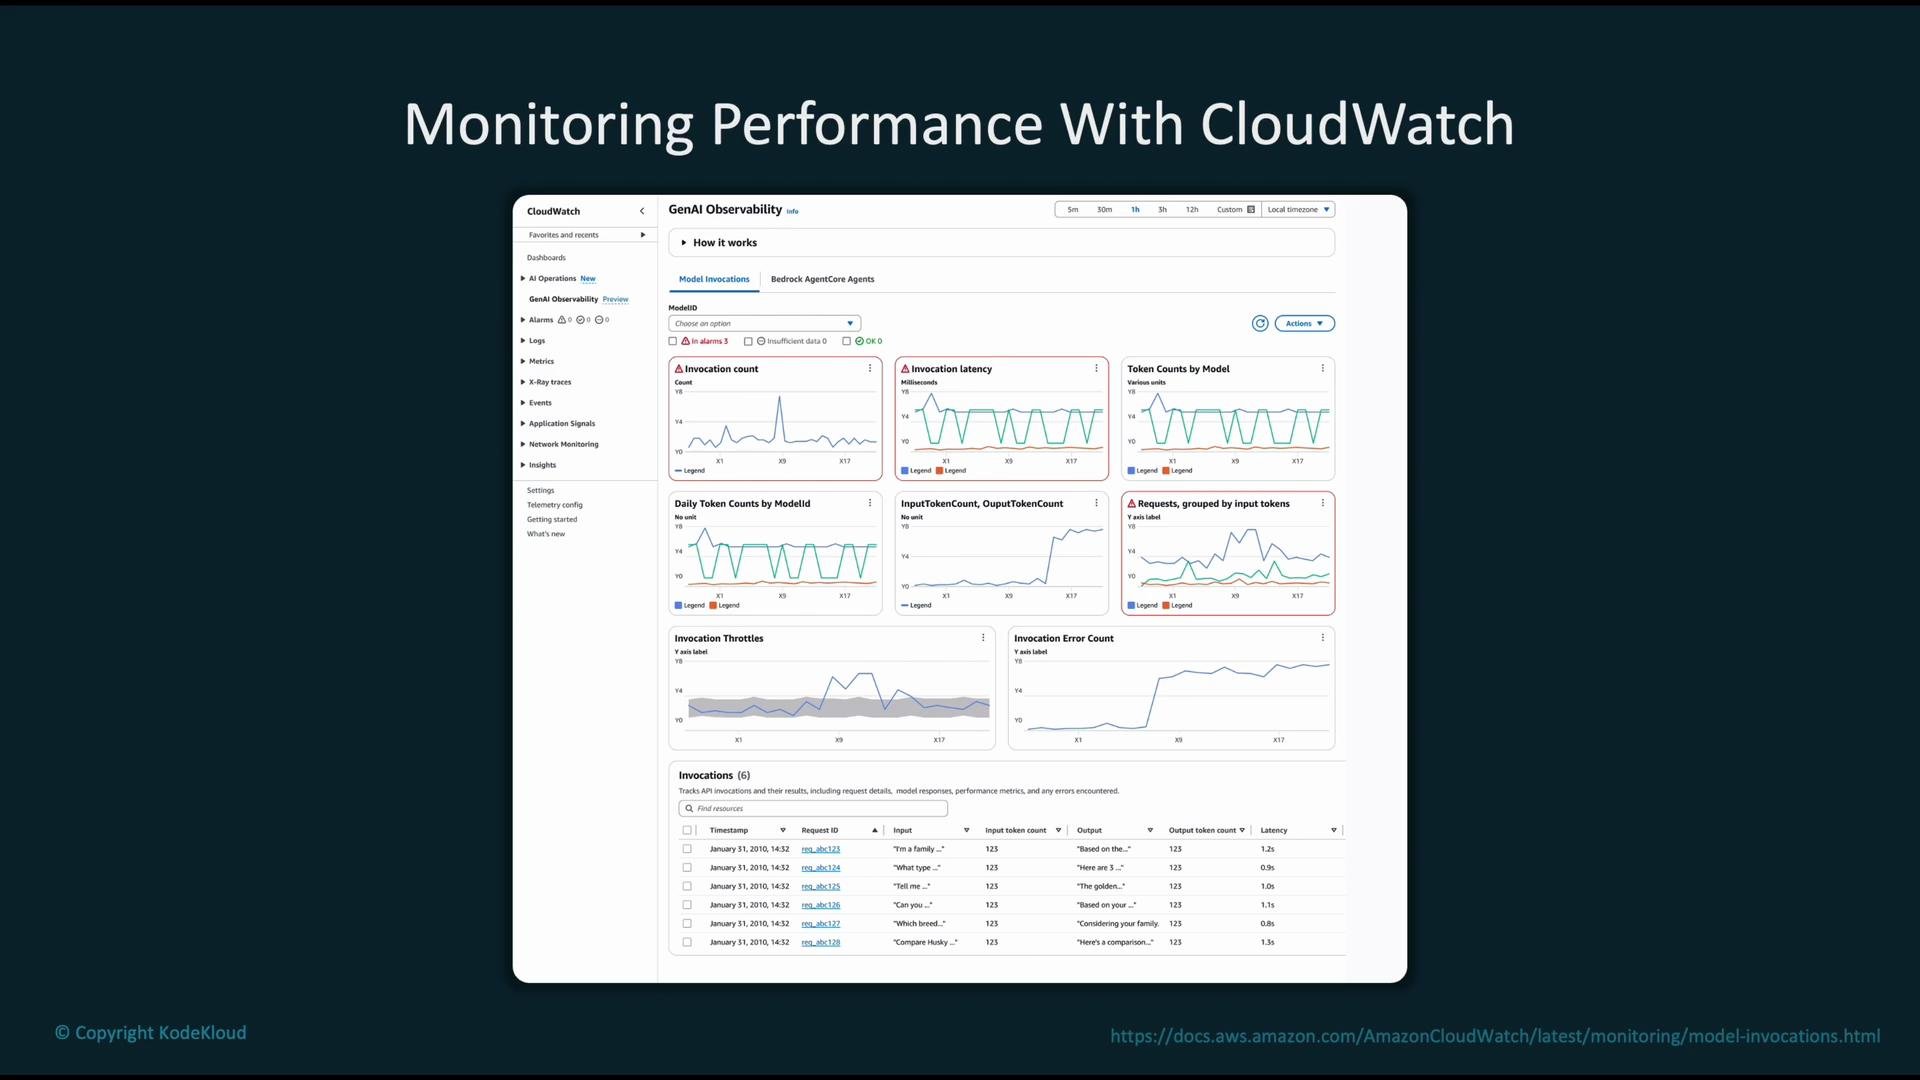
* Emit and collect performance metrics from [SageMaker endpoints](https://docs.aws.amazon.com/sagemaker/latest/dg/endpoints.html): invocation counts, latency (p50/p95/p99), success/error counts, and custom application metrics.
* Aggregate and visualize metrics on a centralized [CloudWatch dashboard](https://docs.aws.amazon.com/AmazonCloudWatch/latest/monitoring/CloudWatch_Dashboards.html) for operations and business stakeholders.
* Configure automated alarms and notifications to inform teams (SNS, Lambda, or ticketing integrations) when thresholds or anomaly patterns are observed.
* Drill into logs/traces (if enabled) to inspect individual API calls, inputs/outputs, stack traces, and latency breakdowns for root-cause analysis.
CloudWatch dashboards are particularly valuable for generative AI use-cases where token usage, throughput, and cost metrics should be surfaced alongside latency and error trends.
CloudWatch-centric production monitoring (practical workflow):
* Emit and collect performance metrics from [SageMaker endpoints](https://docs.aws.amazon.com/sagemaker/latest/dg/endpoints.html): invocation counts, latency (p50/p95/p99), success/error counts, and custom application metrics.
* Aggregate and visualize metrics on a centralized [CloudWatch dashboard](https://docs.aws.amazon.com/AmazonCloudWatch/latest/monitoring/CloudWatch_Dashboards.html) for operations and business stakeholders.
* Configure automated alarms and notifications to inform teams (SNS, Lambda, or ticketing integrations) when thresholds or anomaly patterns are observed.
* Drill into logs/traces (if enabled) to inspect individual API calls, inputs/outputs, stack traces, and latency breakdowns for root-cause analysis.
CloudWatch dashboards are particularly valuable for generative AI use-cases where token usage, throughput, and cost metrics should be surfaced alongside latency and error trends.
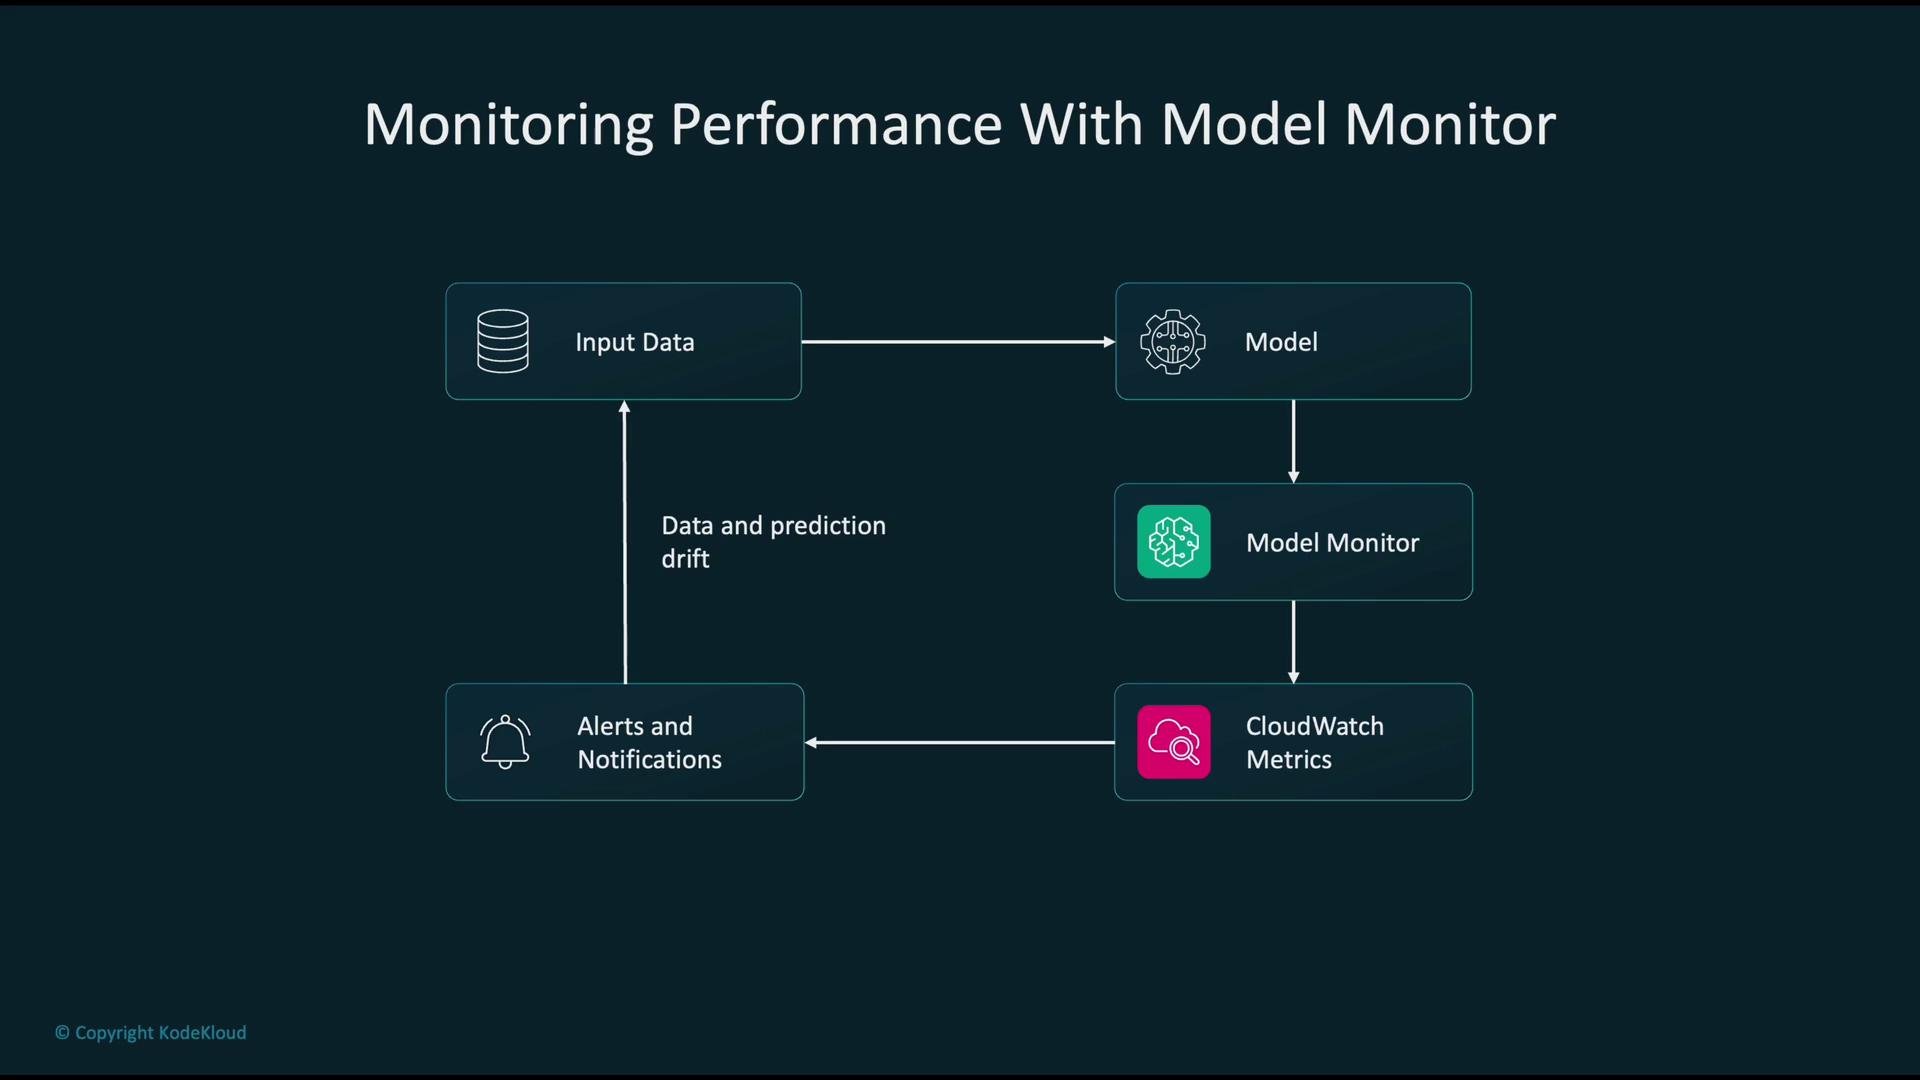
 Model Monitor-based workflow (model-quality focused):
* Route a sample or all live input requests to a monitoring pipeline (via inference logging, event streaming, or scheduled capture).
* Continuously analyze input feature distributions and model outputs using [SageMaker Model Monitor](https://docs.aws.amazon.com/sagemaker/latest/dg/model-monitor.html).
* Model Monitor can emit metrics and anomaly signals that are published to [CloudWatch](https://aws.amazon.com/cloudwatch/) for centralized alerting and visualization.
* When drift or anomalies are detected, trigger automated investigation steps (snapshot data, notify teams, start drift analysis jobs) and, if configured, initiate retraining pipelines.
This approach helps detect data drift, label drift, prediction-skew, and other quality degradations early so you can respond before customer impact grows.
Model Monitor-based workflow (model-quality focused):
* Route a sample or all live input requests to a monitoring pipeline (via inference logging, event streaming, or scheduled capture).
* Continuously analyze input feature distributions and model outputs using [SageMaker Model Monitor](https://docs.aws.amazon.com/sagemaker/latest/dg/model-monitor.html).
* Model Monitor can emit metrics and anomaly signals that are published to [CloudWatch](https://aws.amazon.com/cloudwatch/) for centralized alerting and visualization.
* When drift or anomalies are detected, trigger automated investigation steps (snapshot data, notify teams, start drift analysis jobs) and, if configured, initiate retraining pipelines.
This approach helps detect data drift, label drift, prediction-skew, and other quality degradations early so you can respond before customer impact grows.
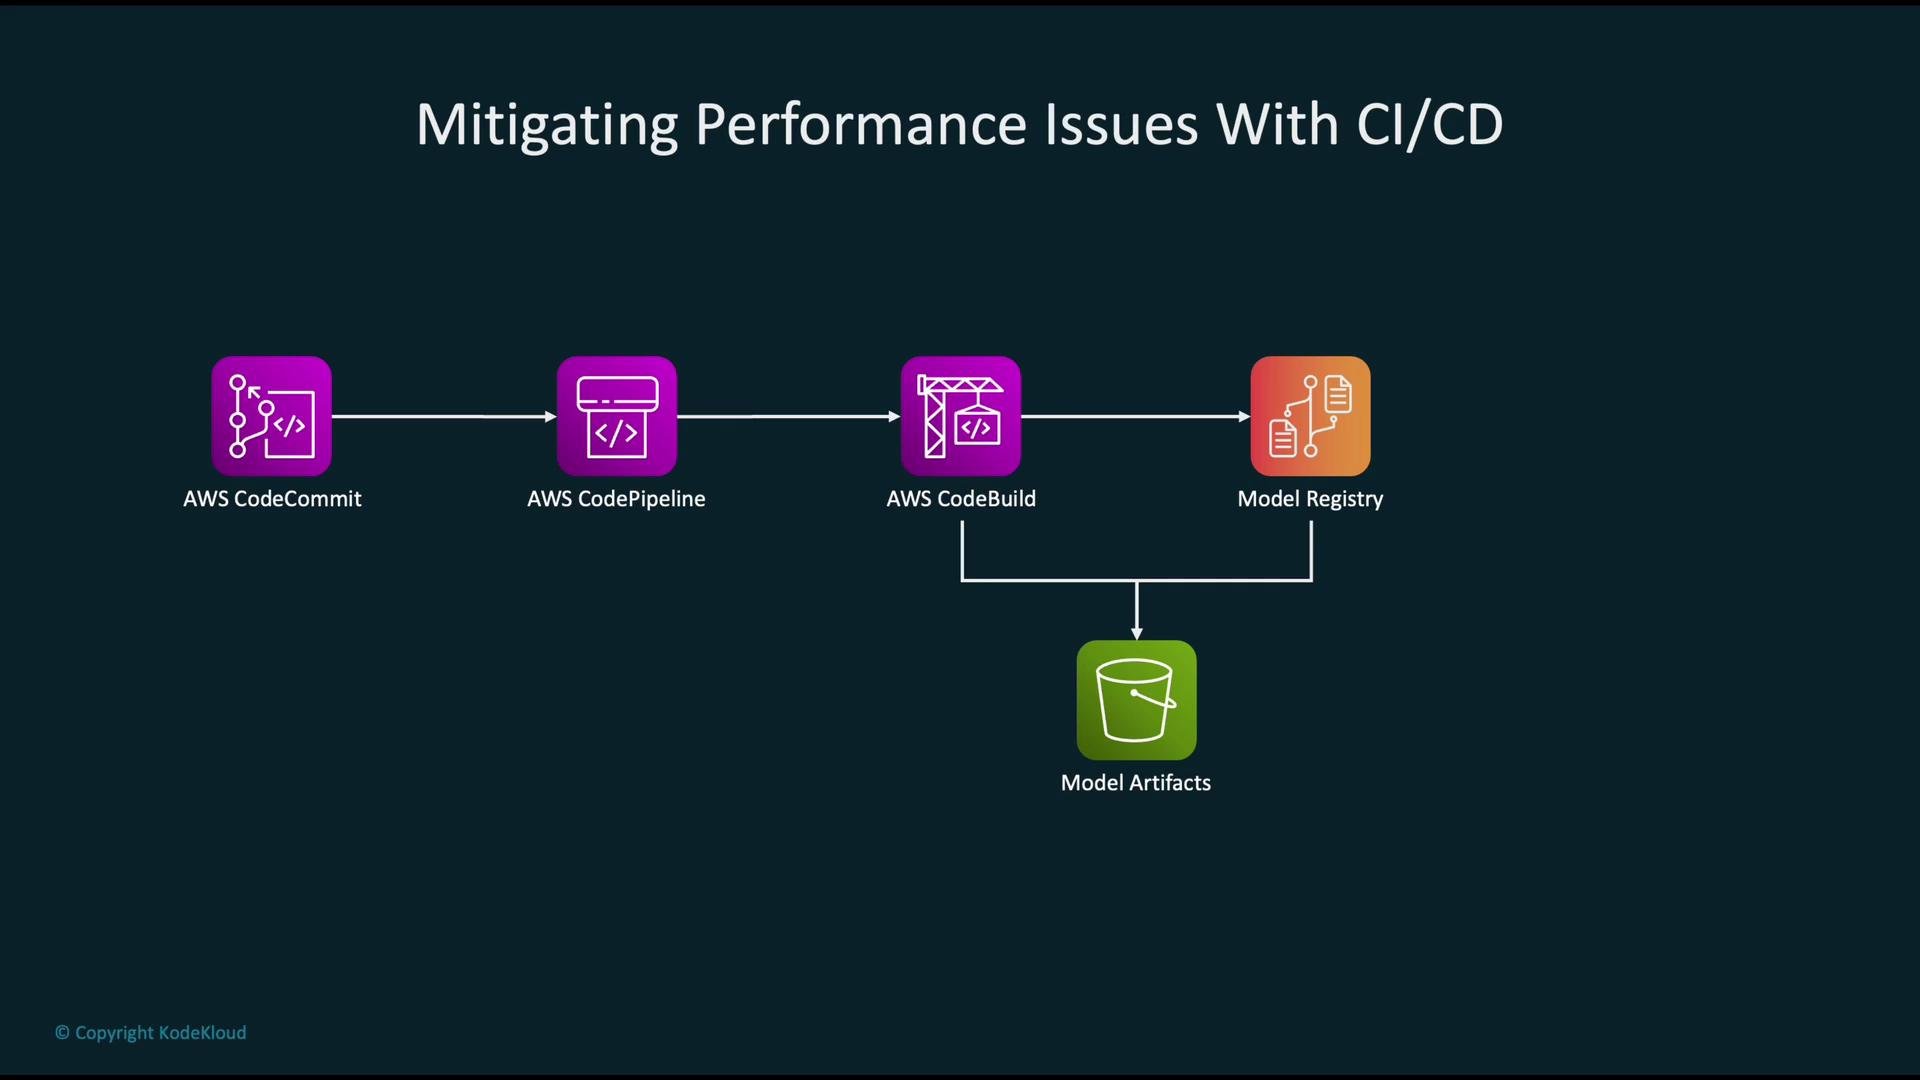
 CI/CD + Monitoring: operationalizing safe model updates
* Developer pushes code or model changes to a source repository (e.g., [AWS CodeCommit](https://aws.amazon.com/codecommit/) or GitHub).
* A change triggers an [AWS CodePipeline](https://aws.amazon.com/codepipeline/) workflow.
* [AWS CodeBuild](https://aws.amazon.com/codebuild/) or managed training jobs execute training/testing and produce model artifacts.
* Artifacts are versioned and stored (e.g., in `S3`) and optionally registered in a SageMaker [model registry](https://docs.aws.amazon.com/sagemaker/latest/dg/model-registry.html).
* Release pipelines promote models through stages (staging → canary → production) with automated tests, performance gates, and monitoring checks before full rollout.
Automation enforces repeatability, reduces human error, and enables safe rollback or gradual rollout strategies when monitoring detects regressions.
CI/CD + Monitoring: operationalizing safe model updates
* Developer pushes code or model changes to a source repository (e.g., [AWS CodeCommit](https://aws.amazon.com/codecommit/) or GitHub).
* A change triggers an [AWS CodePipeline](https://aws.amazon.com/codepipeline/) workflow.
* [AWS CodeBuild](https://aws.amazon.com/codebuild/) or managed training jobs execute training/testing and produce model artifacts.
* Artifacts are versioned and stored (e.g., in `S3`) and optionally registered in a SageMaker [model registry](https://docs.aws.amazon.com/sagemaker/latest/dg/model-registry.html).
* Release pipelines promote models through stages (staging → canary → production) with automated tests, performance gates, and monitoring checks before full rollout.
Automation enforces repeatability, reduces human error, and enables safe rollback or gradual rollout strategies when monitoring detects regressions.
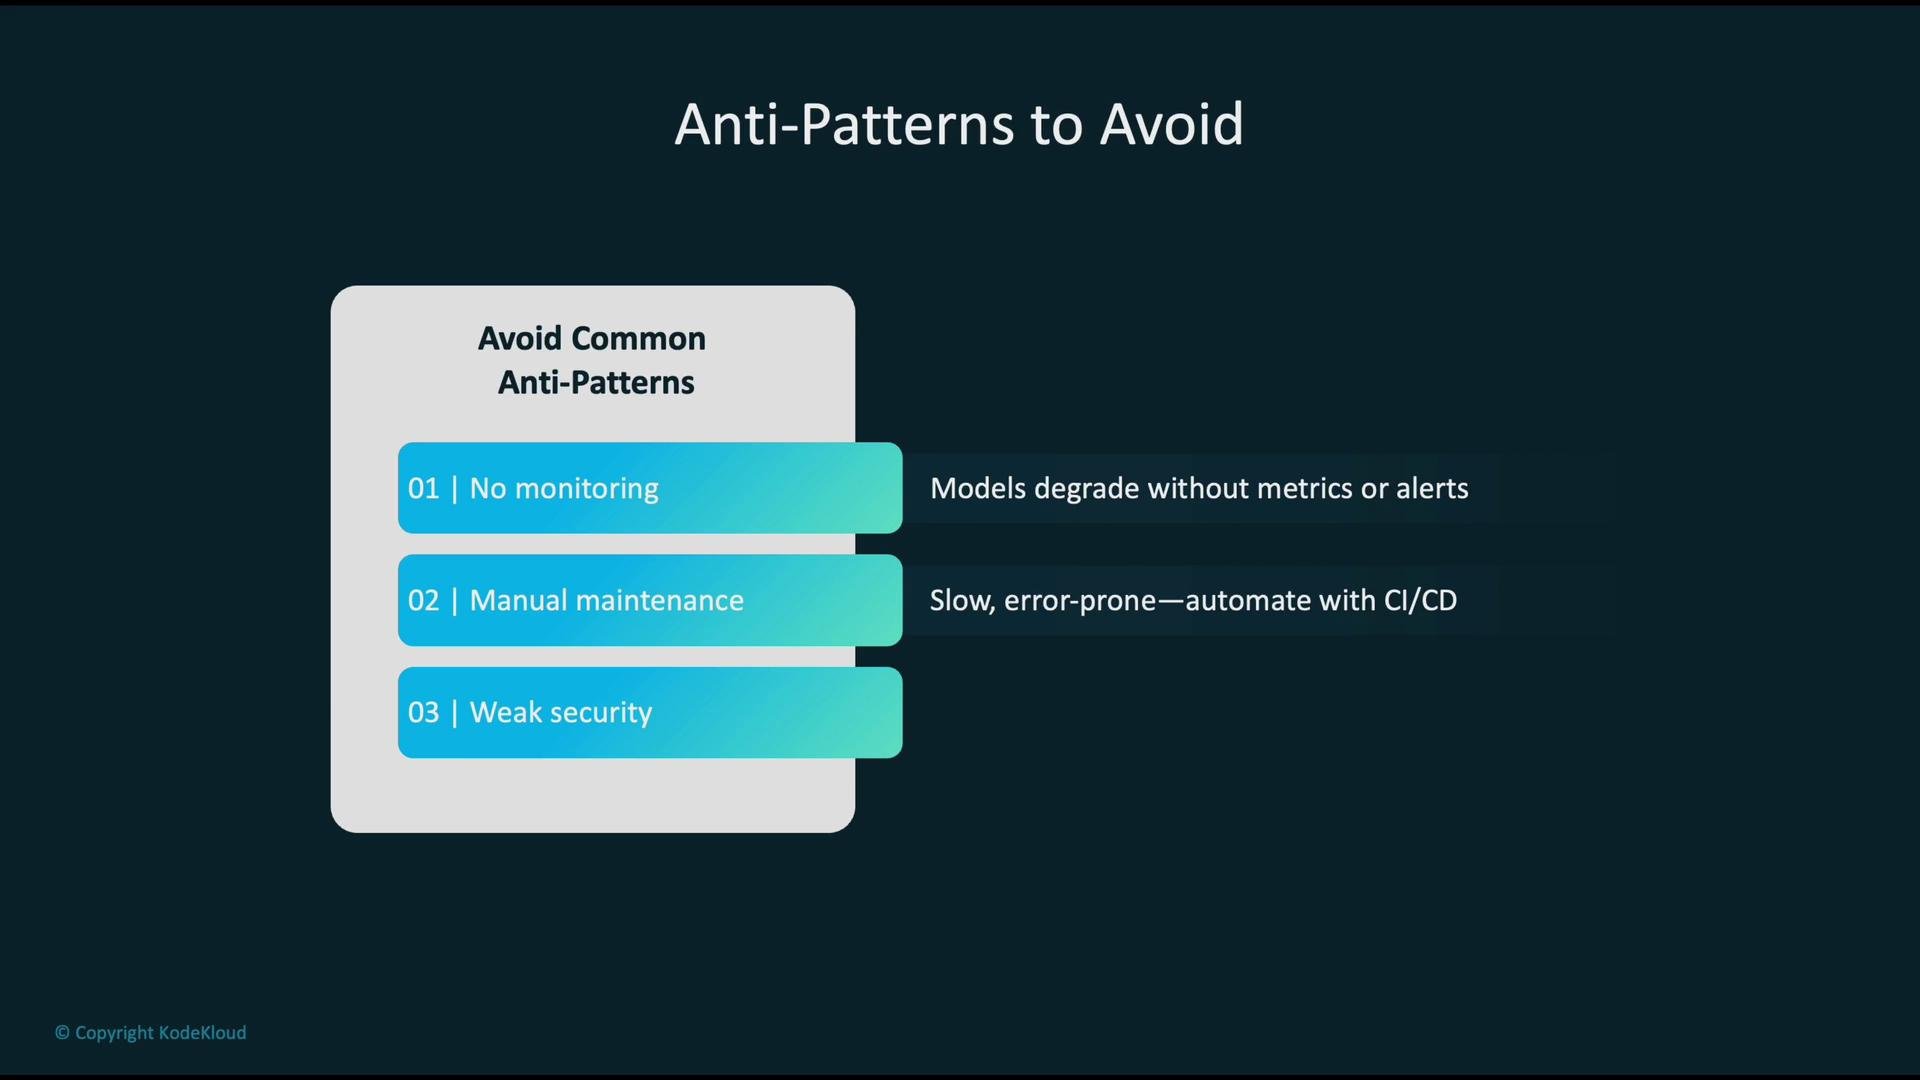
 Common operational anti-patterns to avoid:
* No monitoring: models deployed without metrics or alerts will degrade silently.
* Manual maintenance: relying on human-driven retraining/deployment processes is slow and error-prone — automate with CI/CD.
* Weak security: insufficient access controls, missing encryption, or exposed networks increase risk of data leakage or tampering — use [IAM](https://aws.amazon.com/iam/), encryption at rest/in transit, and [VPCs](https://aws.amazon.com/vpc/).
Common operational anti-patterns to avoid:
* No monitoring: models deployed without metrics or alerts will degrade silently.
* Manual maintenance: relying on human-driven retraining/deployment processes is slow and error-prone — automate with CI/CD.
* Weak security: insufficient access controls, missing encryption, or exposed networks increase risk of data leakage or tampering — use [IAM](https://aws.amazon.com/iam/), encryption at rest/in transit, and [VPCs](https://aws.amazon.com/vpc/).
 Avoid relying solely on human inspection. Automated, measurable monitoring with alerting and retraining automation is essential to maintain production model quality.
Key operational recommendations and best practices:
* Define clear performance metrics and SLAs (accuracy, precision/recall, latency percentiles, throughput, token usage, cost per inference).
* Establish baselines using validation data and initial production traffic to detect meaningful deviation.
* Instrument models at the code-level to capture essential telemetry (input schema, outputs, prediction probabilities/confidences, request metadata).
* Continuously monitor both system and model-level metrics to detect drift and degradation early.
* Configure alerting so the right teams are notified with actionable context (metric, threshold, recent trends, sample data).
* Automate retraining, evaluation, and promotion via CI/CD pipelines, and include monitoring gates in your release process.
* Secure the pipeline with least-privilege IAM roles, encrypted S3 buckets, and VPC endpoints for private network traffic.
Common monitoring metrics and why they matter:
| Metric | Why it matters | Example sources |
| ----------------------------------- | ------------------------------------------- | ---------------------------------------------- |
| Latency (p50/p95/p99) | Detects slowdowns affecting user experience | CloudWatch metrics from endpoints |
| Invocation / throughput | Capacity and scaling signals | CloudWatch, Application logs |
| Error rate / HTTP 5xx | Failures in the inference path | Endpoint metrics, logs |
| Prediction confidence / probability | Signals model uncertainty or drift | Model output telemetry |
| Feature distribution stats | Detect input data drift | SageMaker Model Monitor baselines and monitors |
| Token usage / request cost | Important for LLM-driven workloads | Application instrumentation → CloudWatch |
Checklist: define metrics, set baselines, instrument models ([Model Monitor](https://docs.aws.amazon.com/sagemaker/latest/dg/model-monitor.html) + [CloudWatch](https://aws.amazon.com/cloudwatch/)), automate CI/CD retraining and deployment, and secure the pipeline ([IAM](https://aws.amazon.com/iam/), encryption, [VPCs](https://aws.amazon.com/vpc/)).
Further reading and references
* [Amazon SageMaker Model Monitor documentation](https://docs.aws.amazon.com/sagemaker/latest/dg/model-monitor.html)
* [Amazon CloudWatch documentation](https://aws.amazon.com/cloudwatch/)
* [SageMaker model registry overview](https://docs.aws.amazon.com/sagemaker/latest/dg/model-registry.html)
* [CI/CD for machine learning on AWS (best practices)](https://aws.amazon.com/blogs/machine-learning/)
Avoid relying solely on human inspection. Automated, measurable monitoring with alerting and retraining automation is essential to maintain production model quality.
Key operational recommendations and best practices:
* Define clear performance metrics and SLAs (accuracy, precision/recall, latency percentiles, throughput, token usage, cost per inference).
* Establish baselines using validation data and initial production traffic to detect meaningful deviation.
* Instrument models at the code-level to capture essential telemetry (input schema, outputs, prediction probabilities/confidences, request metadata).
* Continuously monitor both system and model-level metrics to detect drift and degradation early.
* Configure alerting so the right teams are notified with actionable context (metric, threshold, recent trends, sample data).
* Automate retraining, evaluation, and promotion via CI/CD pipelines, and include monitoring gates in your release process.
* Secure the pipeline with least-privilege IAM roles, encrypted S3 buckets, and VPC endpoints for private network traffic.
Common monitoring metrics and why they matter:
| Metric | Why it matters | Example sources |
| ----------------------------------- | ------------------------------------------- | ---------------------------------------------- |
| Latency (p50/p95/p99) | Detects slowdowns affecting user experience | CloudWatch metrics from endpoints |
| Invocation / throughput | Capacity and scaling signals | CloudWatch, Application logs |
| Error rate / HTTP 5xx | Failures in the inference path | Endpoint metrics, logs |
| Prediction confidence / probability | Signals model uncertainty or drift | Model output telemetry |
| Feature distribution stats | Detect input data drift | SageMaker Model Monitor baselines and monitors |
| Token usage / request cost | Important for LLM-driven workloads | Application instrumentation → CloudWatch |
Checklist: define metrics, set baselines, instrument models ([Model Monitor](https://docs.aws.amazon.com/sagemaker/latest/dg/model-monitor.html) + [CloudWatch](https://aws.amazon.com/cloudwatch/)), automate CI/CD retraining and deployment, and secure the pipeline ([IAM](https://aws.amazon.com/iam/), encryption, [VPCs](https://aws.amazon.com/vpc/)).
Further reading and references
* [Amazon SageMaker Model Monitor documentation](https://docs.aws.amazon.com/sagemaker/latest/dg/model-monitor.html)
* [Amazon CloudWatch documentation](https://aws.amazon.com/cloudwatch/)
* [SageMaker model registry overview](https://docs.aws.amazon.com/sagemaker/latest/dg/model-registry.html)
* [CI/CD for machine learning on AWS (best practices)](https://aws.amazon.com/blogs/machine-learning/)