> ## Documentation Index
> Fetch the complete documentation index at: https://notes.kodekloud.com/llms.txt
> Use this file to discover all available pages before exploring further.
# Using SageMaker Model Monitor
> Guide to using Amazon SageMaker Model Monitor to detect data drift, monitor model quality, and automate alerts plus CI/CD-driven retraining and deployment
In this lesson we cover Amazon SageMaker Model Monitor — a core tool for maintaining production ML model quality. Model Monitor automatically detects data drift, distribution changes, and other issues so you can maintain model accuracy and reliability over time.
We’ll also outline how Model Monitor fits into an automated remediation pipeline using CloudWatch, Lambda, and CI/CD tools (CodeCommit, CodeBuild, CodePipeline).
Why use SageMaker Model Monitor?
* Detect data drift and distributional changes as new data arrives.
* Identify model quality regressions (accuracy, AUC, precision, recall).
* Surface data-quality problems (missing values, invalid ranges) before they cause business impact.
* Emit CloudWatch metrics and write detailed violation reports for auditing and automated responses.
Compare two workflows:
* Unmonitored: Data is preprocessed and a model is deployed without tracking incoming data or predictions. Drift and degradation may go unnoticed until there’s a visible business impact.
* Monitored: Model Monitor captures inputs and outputs, compares them to a training baseline, and raises alerts when violations or drift are detected — creating a closed loop for observability and remediation.
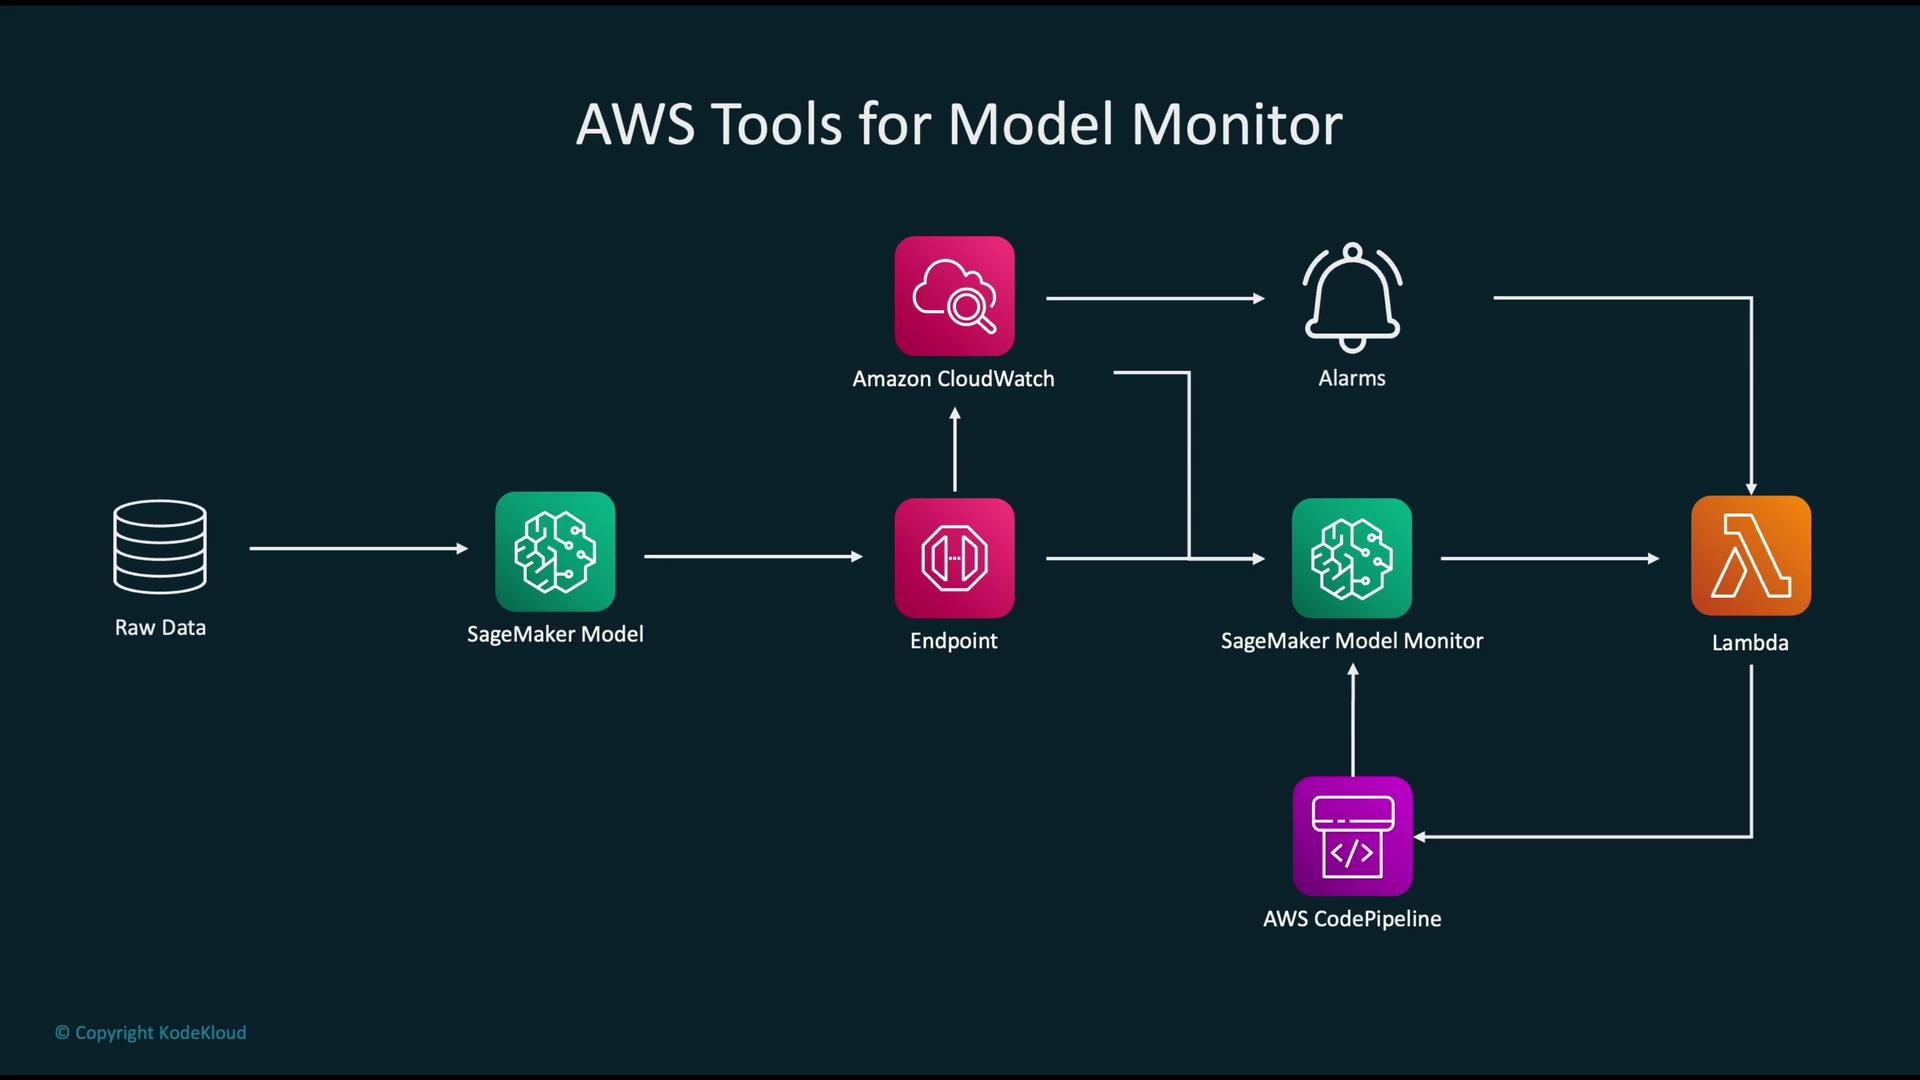 When Model Monitor detects a violation or CloudWatch raises an alarm, you can trigger automation (Lambda or SNS). This automation can start a CI/CD pipeline that retrains, validates, and redeploys models — enabling continuous improvement.
High-level setup walkthrough
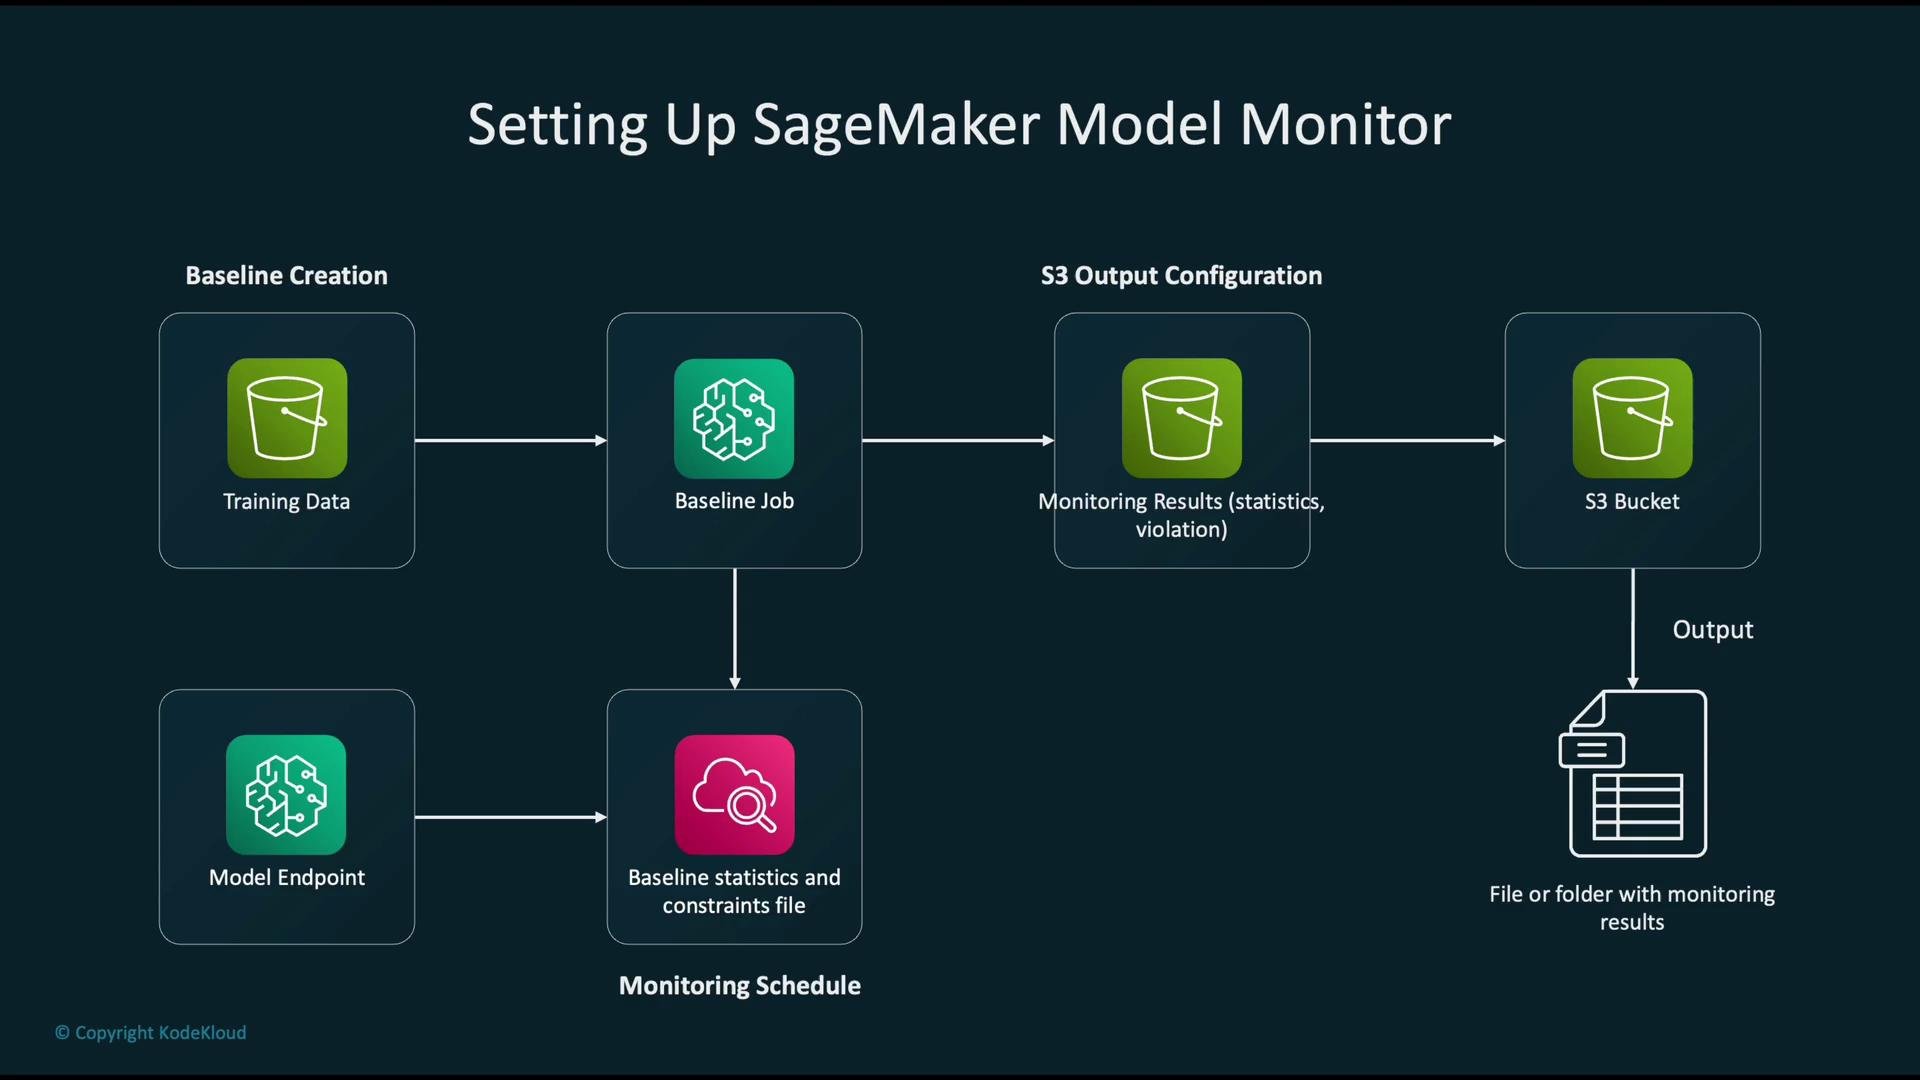
1. Create a baseline — compute representative statistics and constraints from training data (this establishes “normal”).
2. Run a baseline job — produce summary statistics and constraint JSON used for comparisons.
3. Schedule monitoring — run Model Monitor on a cadence (hourly, daily) to analyze captured inference data.
4. Capture results — monitoring jobs write statistics and violation reports to an S3 output location.
5. Alert & automate — use CloudWatch metrics/alarms or SNS to trigger remediation pipelines.
When Model Monitor detects a violation or CloudWatch raises an alarm, you can trigger automation (Lambda or SNS). This automation can start a CI/CD pipeline that retrains, validates, and redeploys models — enabling continuous improvement.
High-level setup walkthrough
1. Create a baseline — compute representative statistics and constraints from training data (this establishes “normal”).
2. Run a baseline job — produce summary statistics and constraint JSON used for comparisons.
3. Schedule monitoring — run Model Monitor on a cadence (hourly, daily) to analyze captured inference data.
4. Capture results — monitoring jobs write statistics and violation reports to an S3 output location.
5. Alert & automate — use CloudWatch metrics/alarms or SNS to trigger remediation pipelines.
 Key AWS components and typical responsibilities
| Service | Typical Use Case |
| ----------------------------------------------- | ------------------------------------------------------------------------------------ |
| Amazon SageMaker Model Monitor | Generate baselines, schedule monitoring jobs, compare live data to training baseline |
| Amazon SageMaker (Endpoints) | Host models; capture inputs/outputs for monitoring |
| Amazon CloudWatch | Observe metrics, create alarms from Model Monitor metrics |
| AWS Lambda | Orchestrate automation, trigger pipelines or remediation workflows |
| Amazon SNS | Alerting and notification fan-out |
| AWS CodeCommit / CodeBuild / CodePipeline | Automated retraining, testing, validation, and deployment |
| Amazon S3 | Store baselines, monitoring outputs, violation reports, and artifacts |
| Model registry (e.g., SageMaker Model Registry) | Versioning, promotion, rollback of model artifacts |
Monitoring for data drift
A practical monitoring configuration includes:
* Define statistical tests or thresholds for drift (PSI, KL-divergence, KS-test, feature-wise tests).
* Configure operational thresholds for infra metrics (e.g., latency > 100 ms) that generate CloudWatch alarms.
* Send SNS notifications or invoke Lambda functions when thresholds are breached.
* Store monitoring outputs and violation reports in S3 for audits and investigation.
Model Monitor compares baseline statistics against live inference data on schedule. When drift or constraint violations occur, Model Monitor emits CloudWatch metrics and writes detailed reports to your configured S3 output.
Key AWS components and typical responsibilities
| Service | Typical Use Case |
| ----------------------------------------------- | ------------------------------------------------------------------------------------ |
| Amazon SageMaker Model Monitor | Generate baselines, schedule monitoring jobs, compare live data to training baseline |
| Amazon SageMaker (Endpoints) | Host models; capture inputs/outputs for monitoring |
| Amazon CloudWatch | Observe metrics, create alarms from Model Monitor metrics |
| AWS Lambda | Orchestrate automation, trigger pipelines or remediation workflows |
| Amazon SNS | Alerting and notification fan-out |
| AWS CodeCommit / CodeBuild / CodePipeline | Automated retraining, testing, validation, and deployment |
| Amazon S3 | Store baselines, monitoring outputs, violation reports, and artifacts |
| Model registry (e.g., SageMaker Model Registry) | Versioning, promotion, rollback of model artifacts |
Monitoring for data drift
A practical monitoring configuration includes:
* Define statistical tests or thresholds for drift (PSI, KL-divergence, KS-test, feature-wise tests).
* Configure operational thresholds for infra metrics (e.g., latency > 100 ms) that generate CloudWatch alarms.
* Send SNS notifications or invoke Lambda functions when thresholds are breached.
* Store monitoring outputs and violation reports in S3 for audits and investigation.
Model Monitor compares baseline statistics against live inference data on schedule. When drift or constraint violations occur, Model Monitor emits CloudWatch metrics and writes detailed reports to your configured S3 output.
 Monitoring dashboard and operational metrics
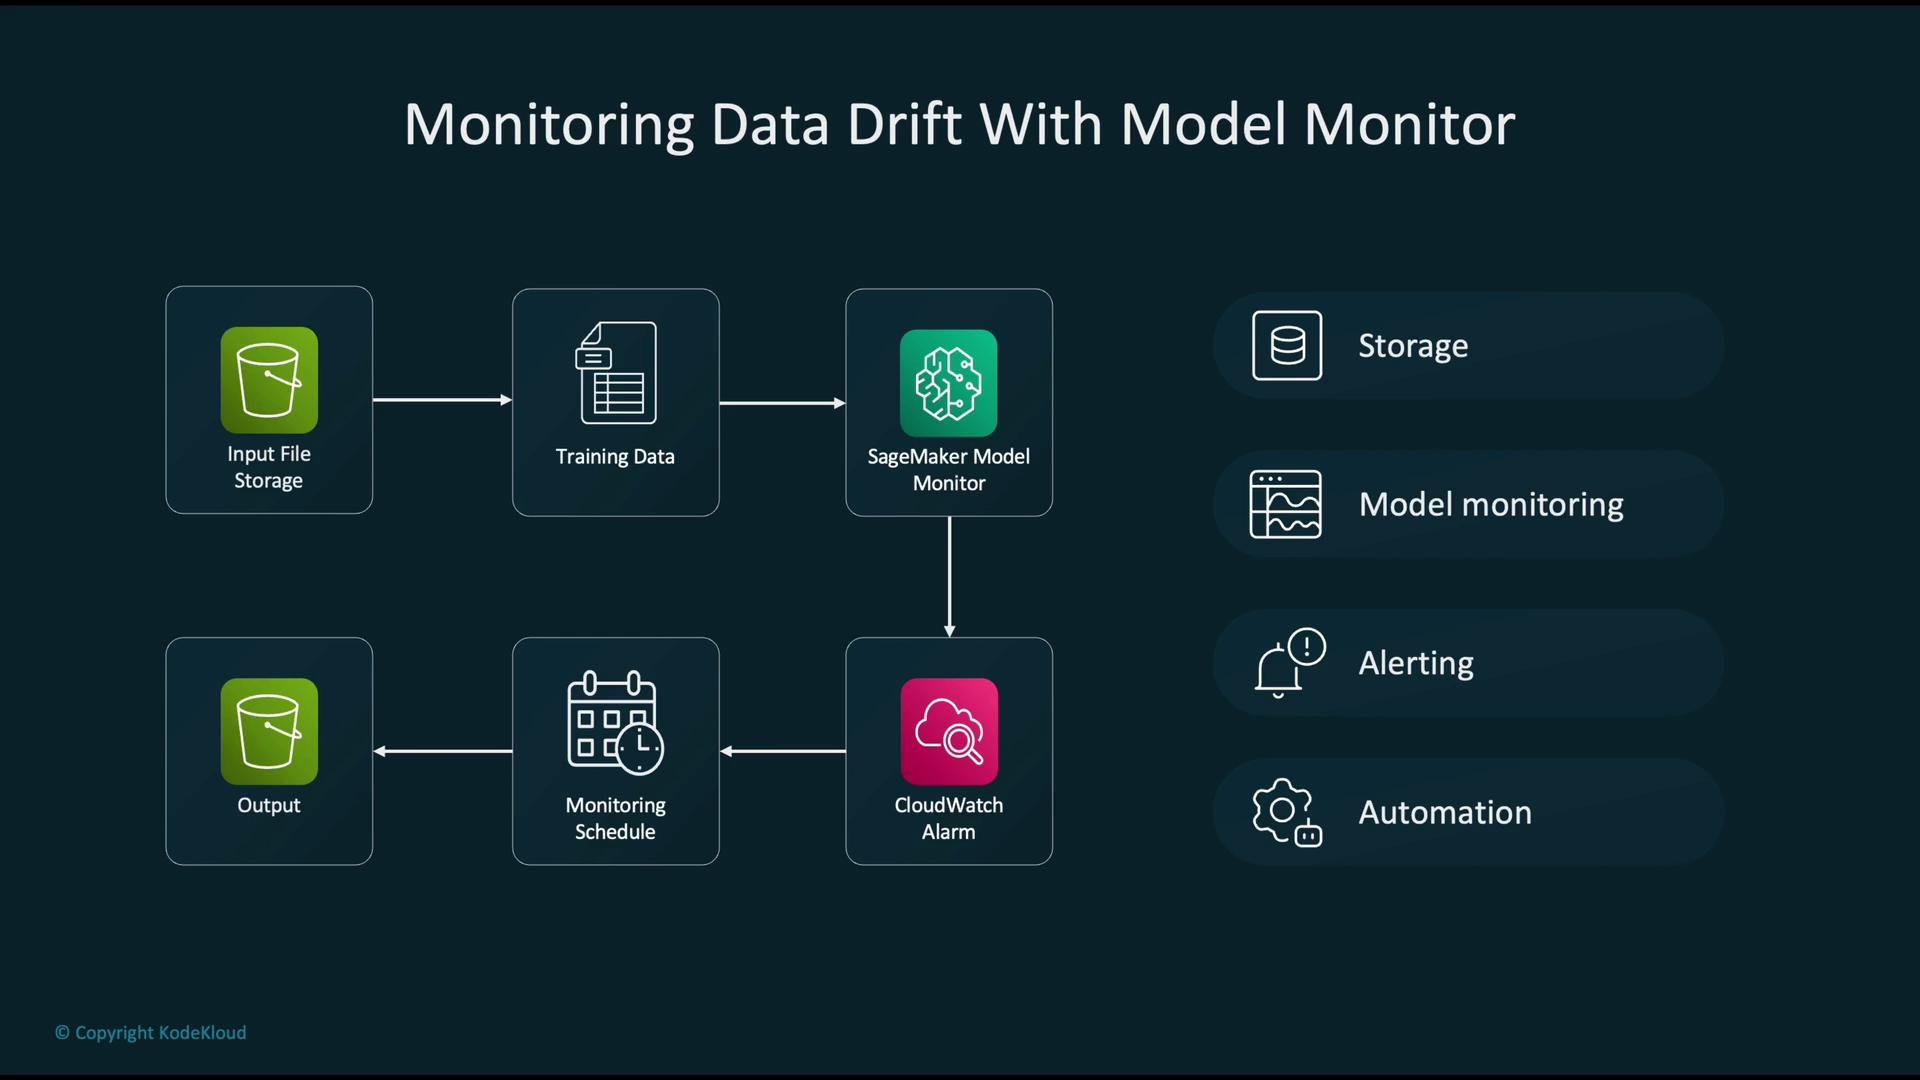
Use a consolidated dashboard to view model and infrastructure health in one place. Track:
* Model metrics: accuracy, AUC, precision/recall, prediction distribution
* Infrastructure metrics: request latency, CPU, memory, disk usage
* Monitoring metrics: number of constraint violations, drift scores
These indicators help teams prioritize remediation and detect regressions quickly.
Monitoring dashboard and operational metrics
Use a consolidated dashboard to view model and infrastructure health in one place. Track:
* Model metrics: accuracy, AUC, precision/recall, prediction distribution
* Infrastructure metrics: request latency, CPU, memory, disk usage
* Monitoring metrics: number of constraint violations, drift scores
These indicators help teams prioritize remediation and detect regressions quickly.
 Monitoring loop and feedback
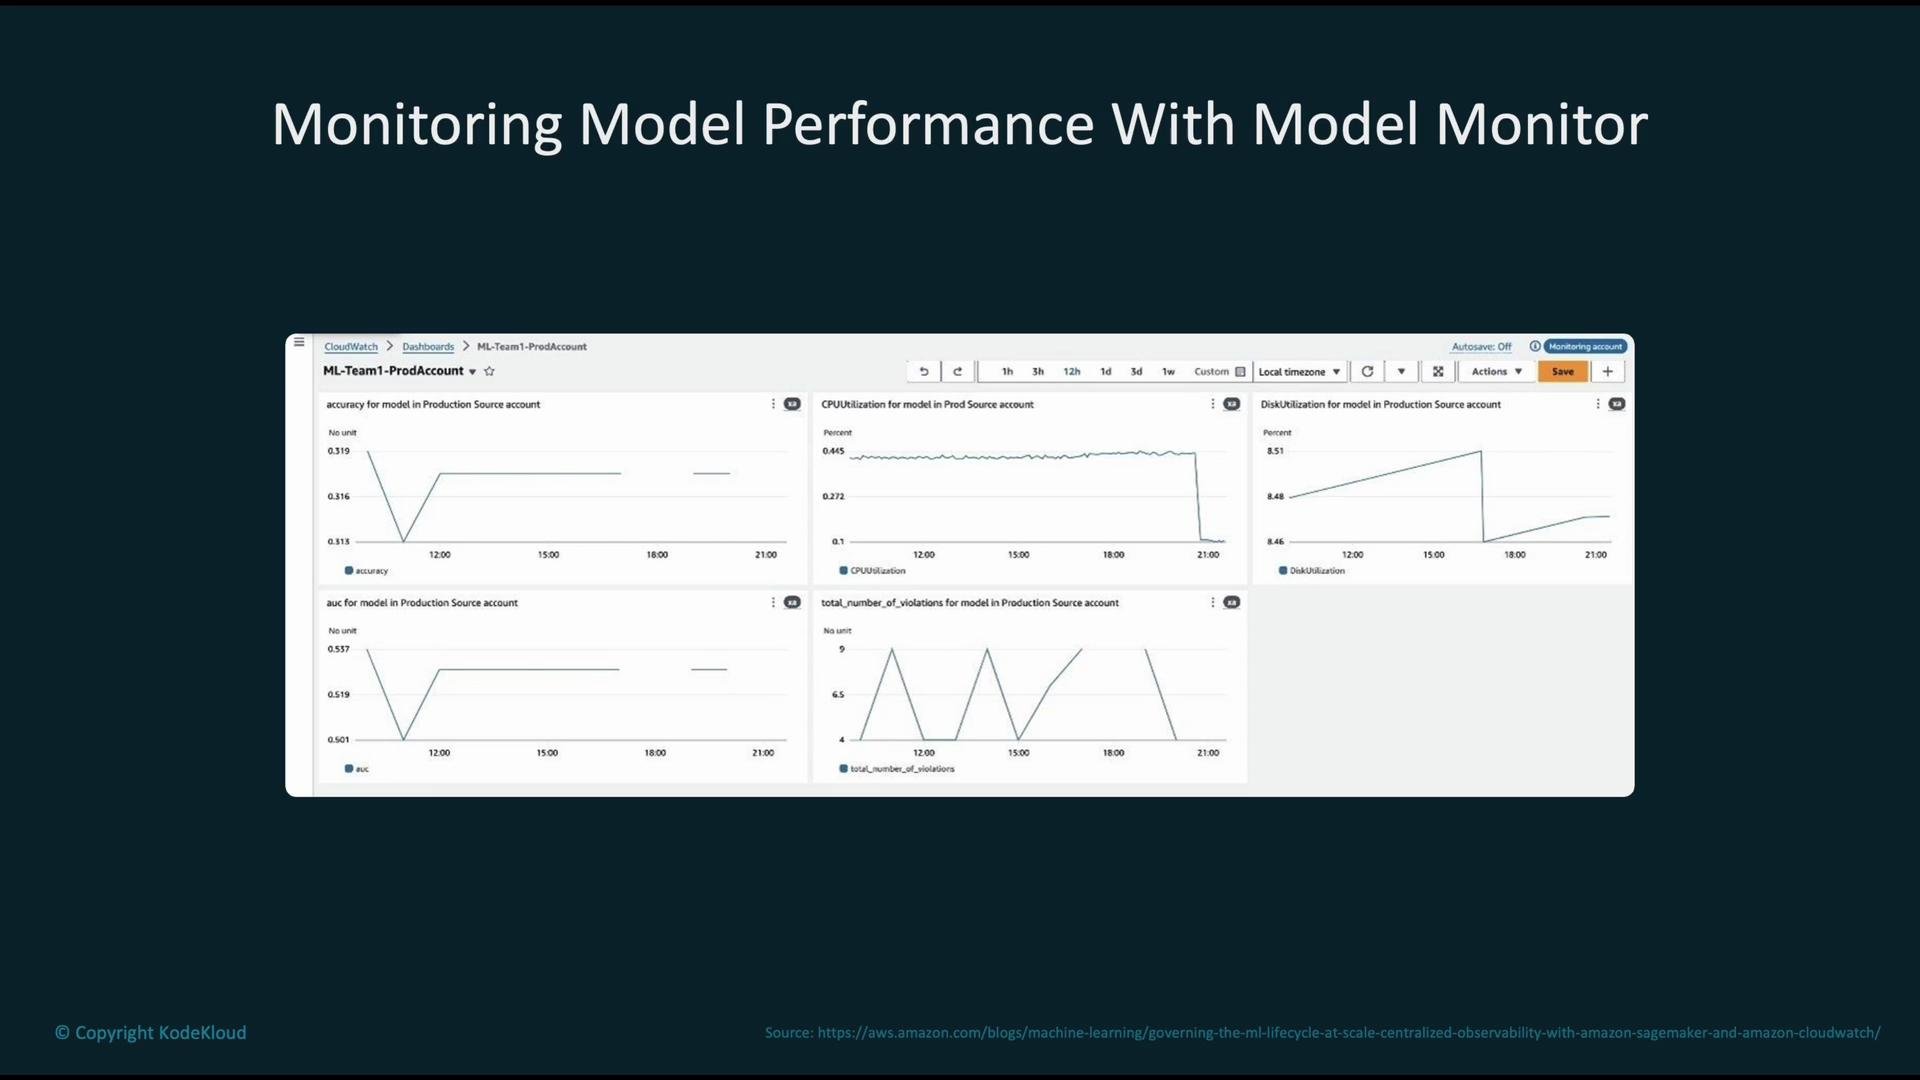
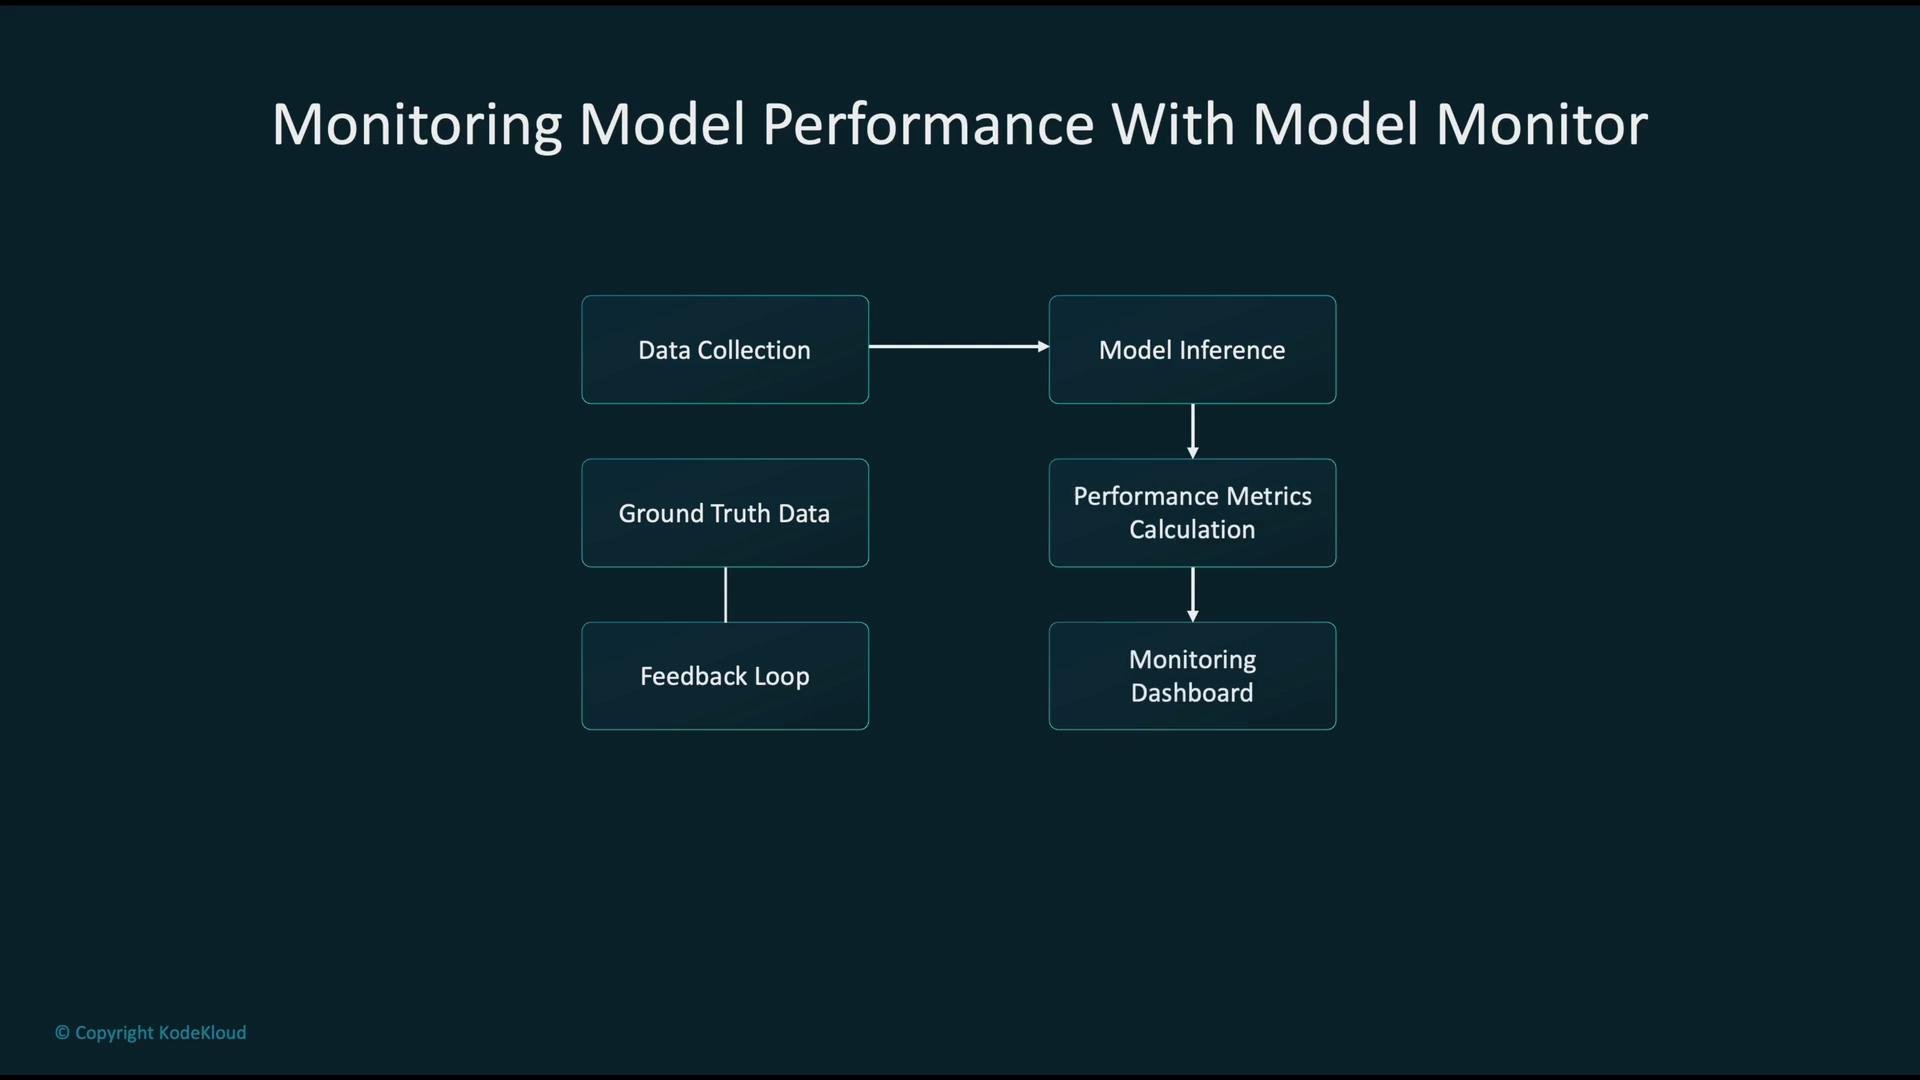
Typical monitoring feedback loop:
1. Collect production inputs and capture endpoint inputs/outputs.
2. Calculate performance metrics from inference data and ground truth (when available).
3. Surface metrics on dashboards and compare against baselines or SLAs.
4. If metrics cross thresholds, generate alerts and run automated remediation.
5. Use ground truth labels to validate predictions and trigger retraining if needed.
Monitoring loop and feedback
Typical monitoring feedback loop:
1. Collect production inputs and capture endpoint inputs/outputs.
2. Calculate performance metrics from inference data and ground truth (when available).
3. Surface metrics on dashboards and compare against baselines or SLAs.
4. If metrics cross thresholds, generate alerts and run automated remediation.
5. Use ground truth labels to validate predictions and trigger retraining if needed.
 Model Monitor capabilities
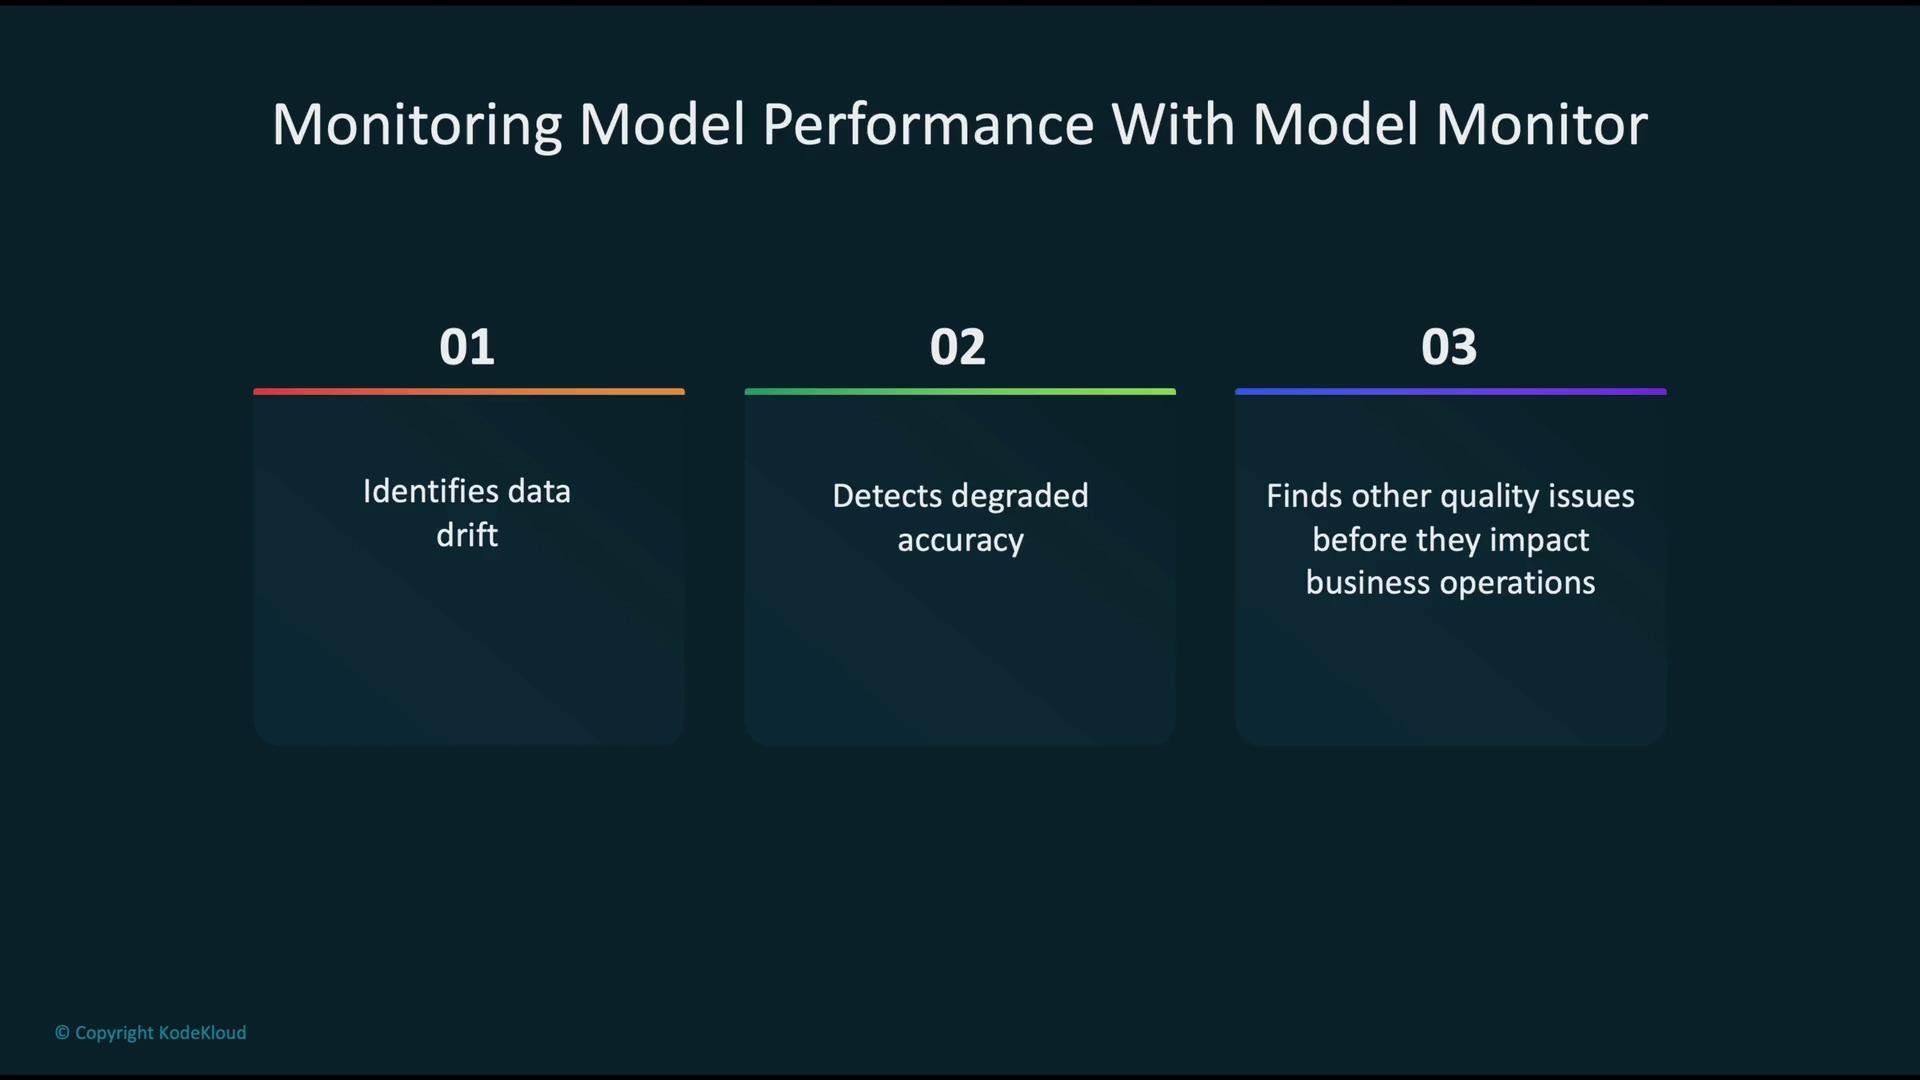
SageMaker Model Monitor delivers three core functions for production ML quality:
* Detect data drift: spotlight shifts in feature distributions vs the training baseline.
* Detect model quality degradation: identify falling accuracy, AUC, or other business metrics.
* Catch data-quality issues: missing or invalid values and constraint violations prior to production impact.
Model Monitor capabilities
SageMaker Model Monitor delivers three core functions for production ML quality:
* Detect data drift: spotlight shifts in feature distributions vs the training baseline.
* Detect model quality degradation: identify falling accuracy, AUC, or other business metrics.
* Catch data-quality issues: missing or invalid values and constraint violations prior to production impact.
 Automated CI/CD retraining and deployment
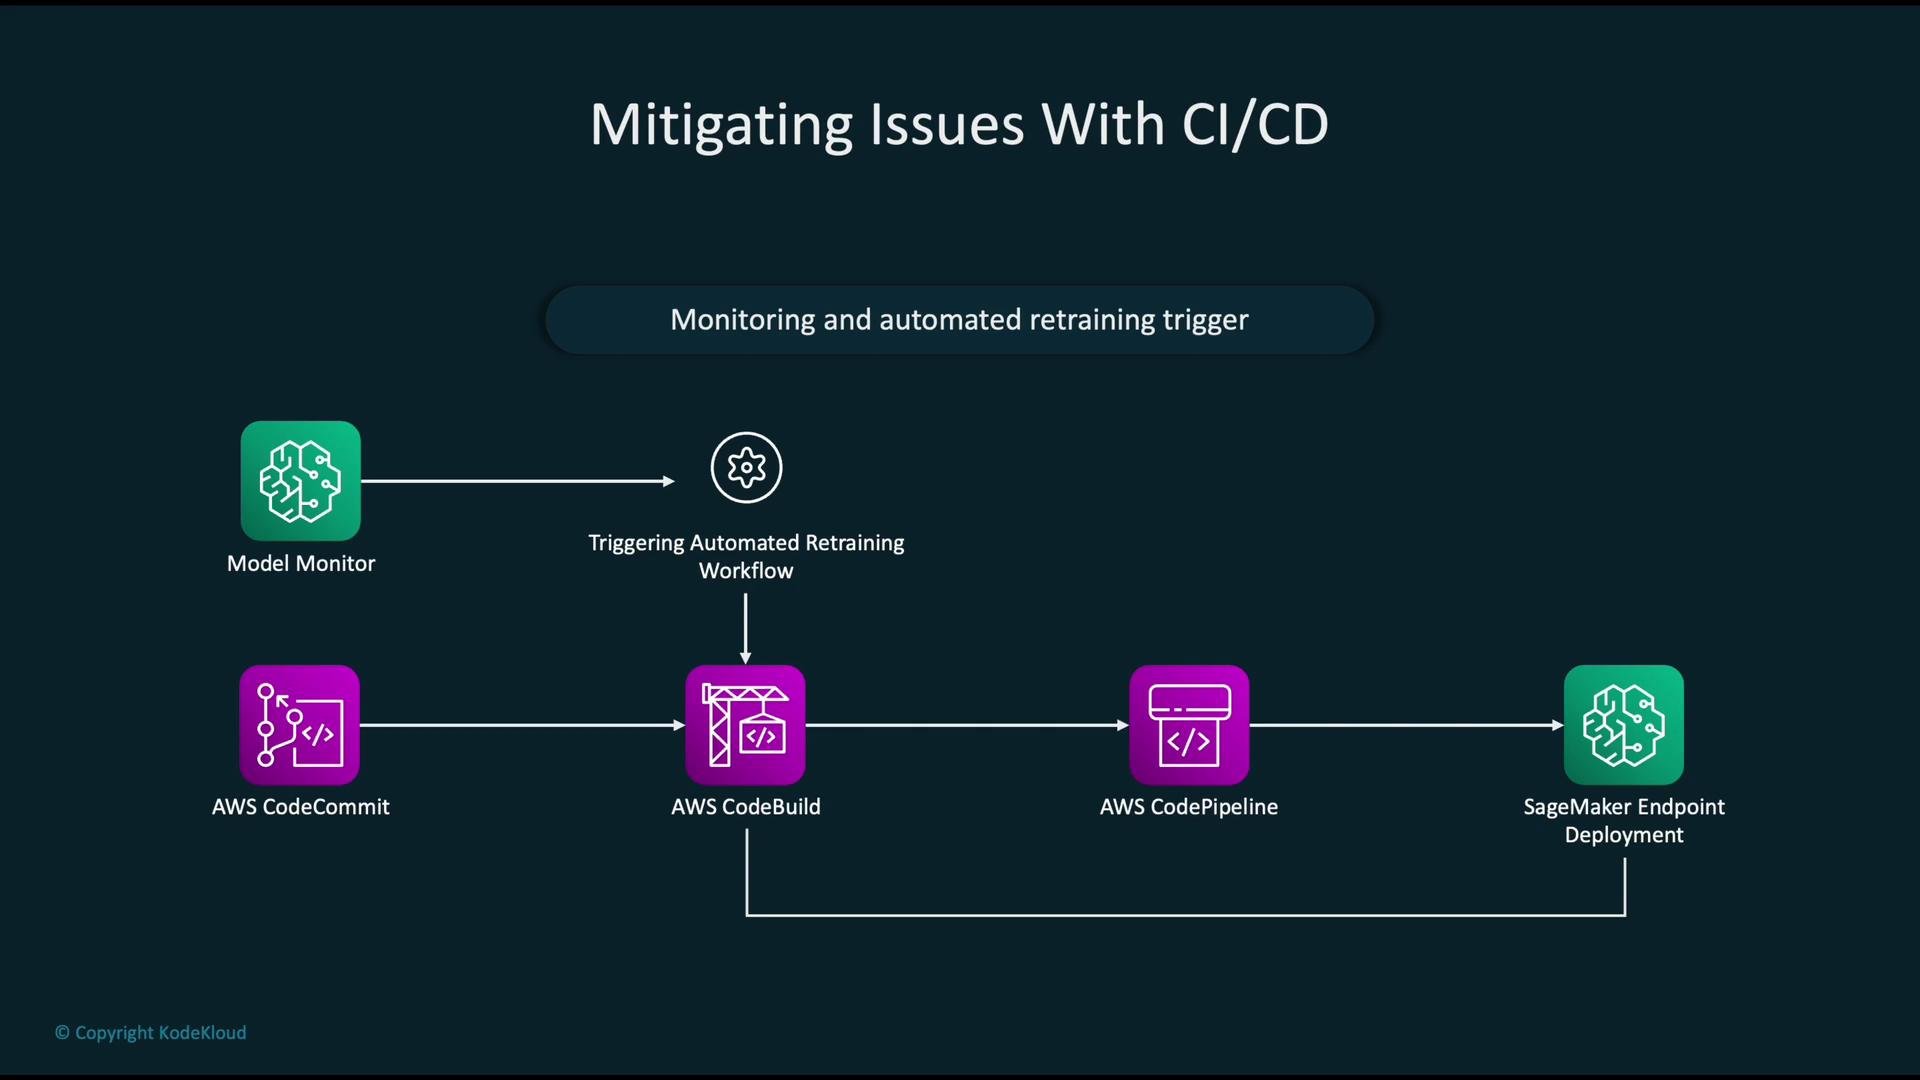
Integrate Model Monitor into CI/CD to remediate issues automatically:
1. Model Monitor or CloudWatch raises an event.
2. Lambda or SNS triggers a pipeline.
3. CodeBuild pulls training code and data from CodeCommit (or another repo).
4. Retraining runs and produces a new model artifact.
5. CodePipeline orchestrates validation tests and deploys the model to staging/production.
6. A model registry (versioning) tracks artifacts for promotion or rollback.
Automated CI/CD retraining and deployment
Integrate Model Monitor into CI/CD to remediate issues automatically:
1. Model Monitor or CloudWatch raises an event.
2. Lambda or SNS triggers a pipeline.
3. CodeBuild pulls training code and data from CodeCommit (or another repo).
4. Retraining runs and produces a new model artifact.
5. CodePipeline orchestrates validation tests and deploys the model to staging/production.
6. A model registry (versioning) tracks artifacts for promotion or rollback.
 Typical pipeline stages
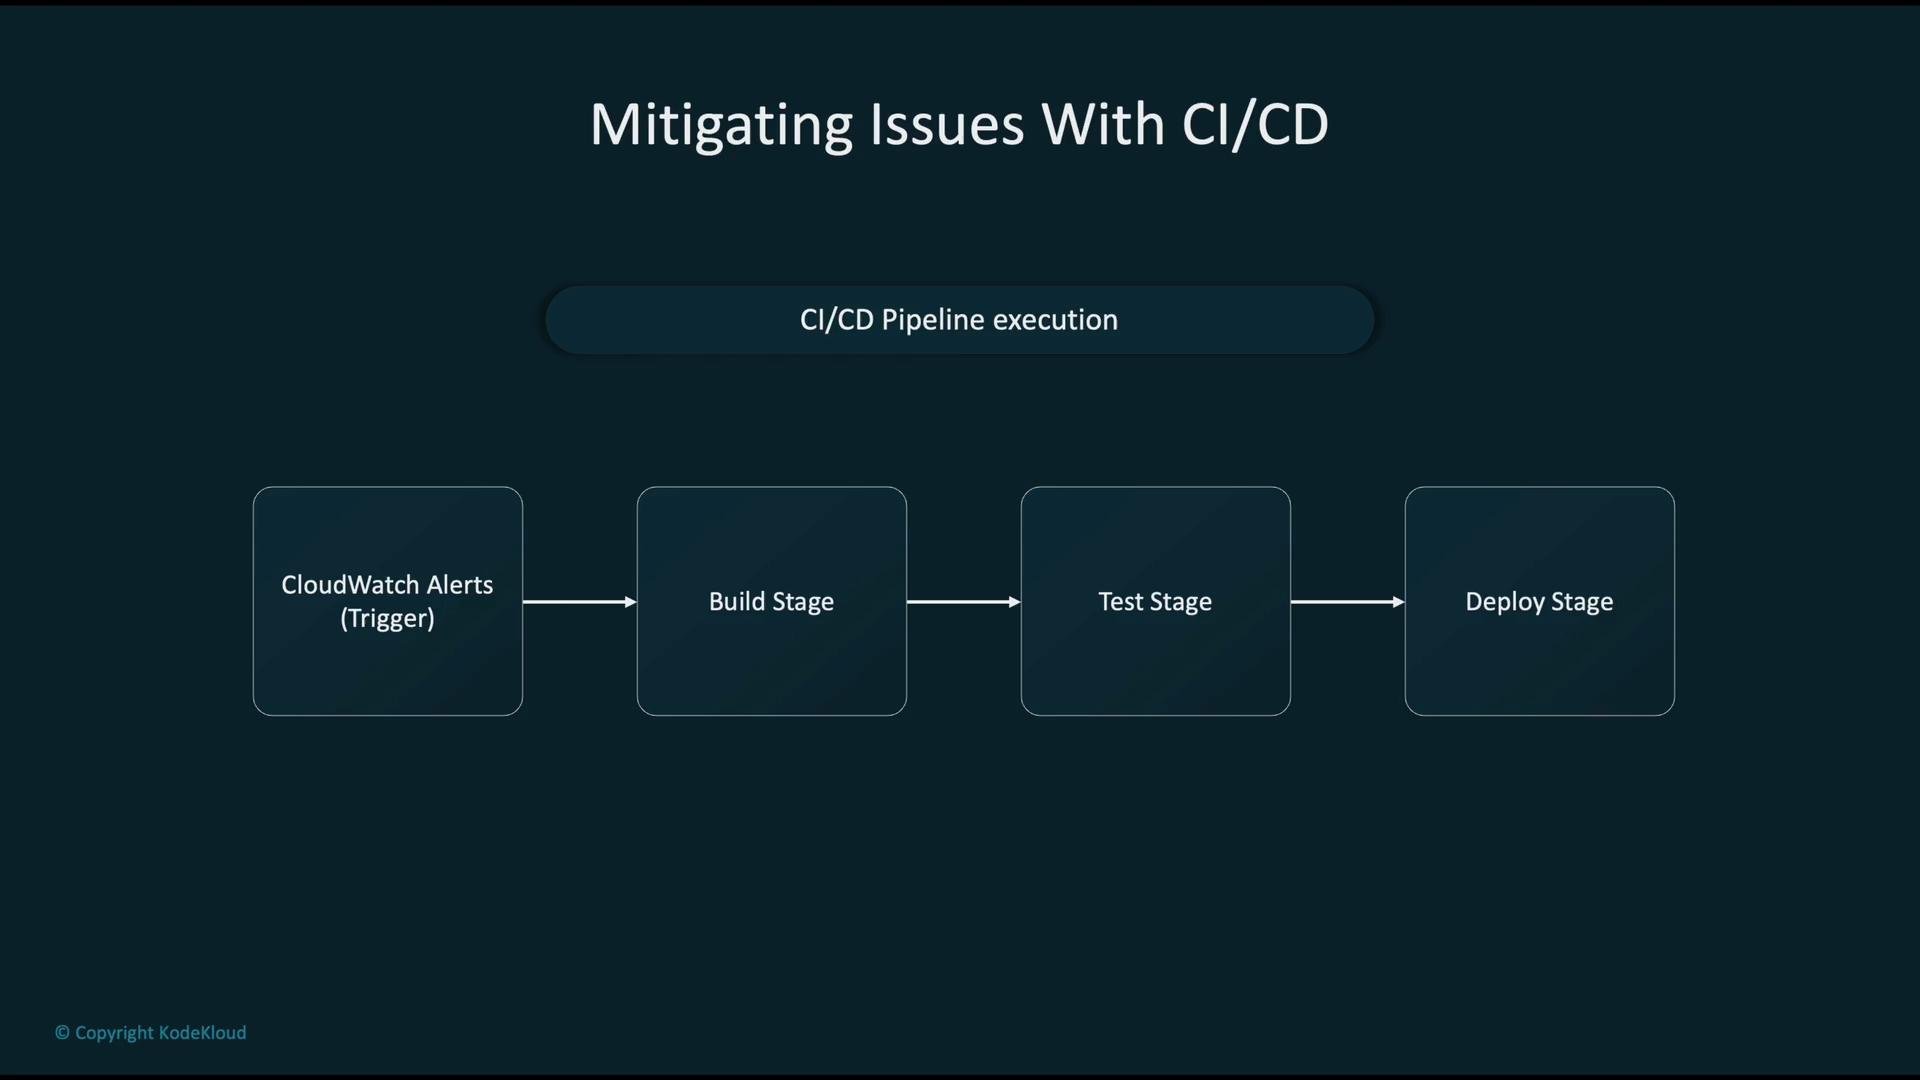
* Trigger: CloudWatch alarm or Model Monitor event.
* Build: Run tests and retraining in CodeBuild.
* Test: Validate the new model against acceptance criteria (performance and stability).
* Deploy: Promote the validated model to production (or rollback if issues are detected).
Typical pipeline stages
* Trigger: CloudWatch alarm or Model Monitor event.
* Build: Run tests and retraining in CodeBuild.
* Test: Validate the new model against acceptance criteria (performance and stability).
* Deploy: Promote the validated model to production (or rollback if issues are detected).
 Model registry and promotion strategy
Use a model registry to version every trained model (V1, V2, …). Typical flow:
* Deploy to staging for integration and performance testing.
* Promote validated models to production.
* Enable automatic rollback to a previously validated version if post-deployment issues appear.
Benefits of CI/CD for model remediation
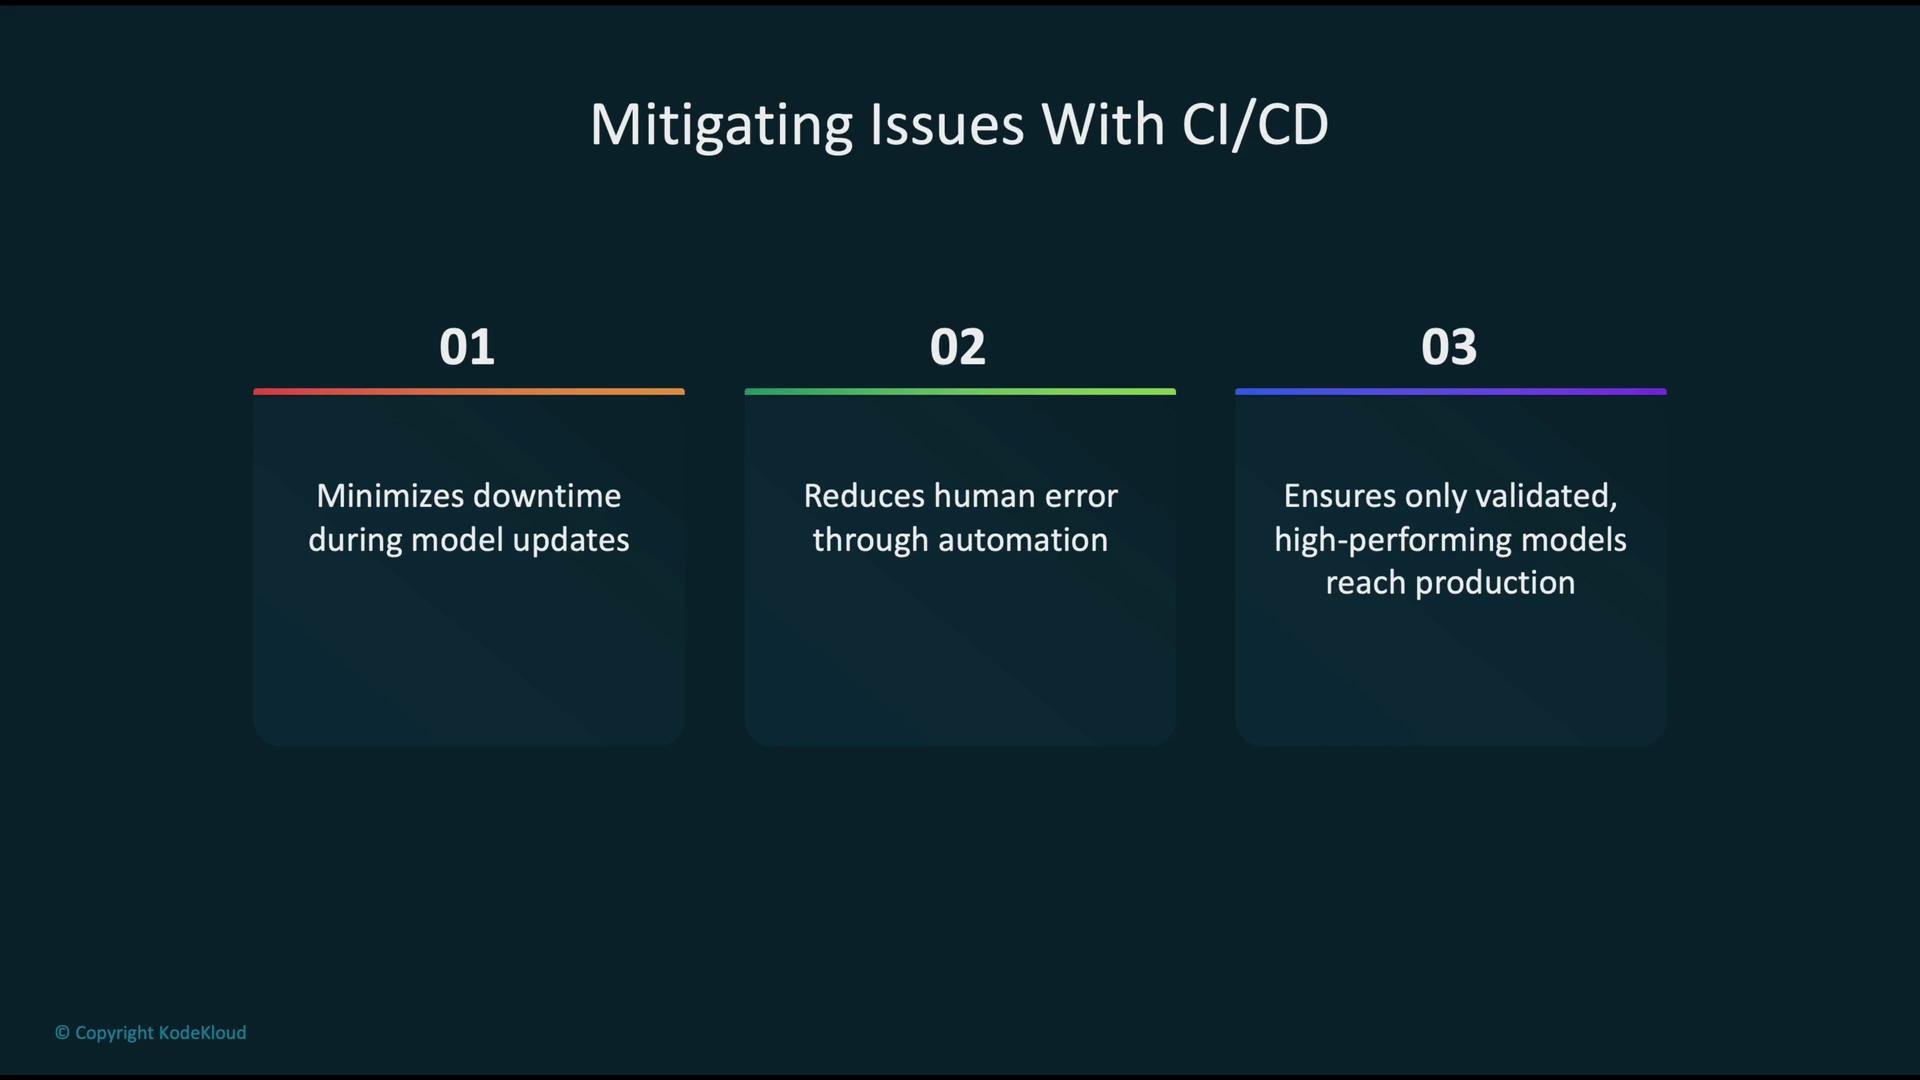
* Minimized downtime via automated rollouts and monitoring.
* Fewer human errors thanks to repeatable, auditable pipelines.
* Quality gates ensure only validated, high-performing models reach production.
Model registry and promotion strategy
Use a model registry to version every trained model (V1, V2, …). Typical flow:
* Deploy to staging for integration and performance testing.
* Promote validated models to production.
* Enable automatic rollback to a previously validated version if post-deployment issues appear.
Benefits of CI/CD for model remediation
* Minimized downtime via automated rollouts and monitoring.
* Fewer human errors thanks to repeatable, auditable pipelines.
* Quality gates ensure only validated, high-performing models reach production.
 Anti-patterns to avoid in MLOps
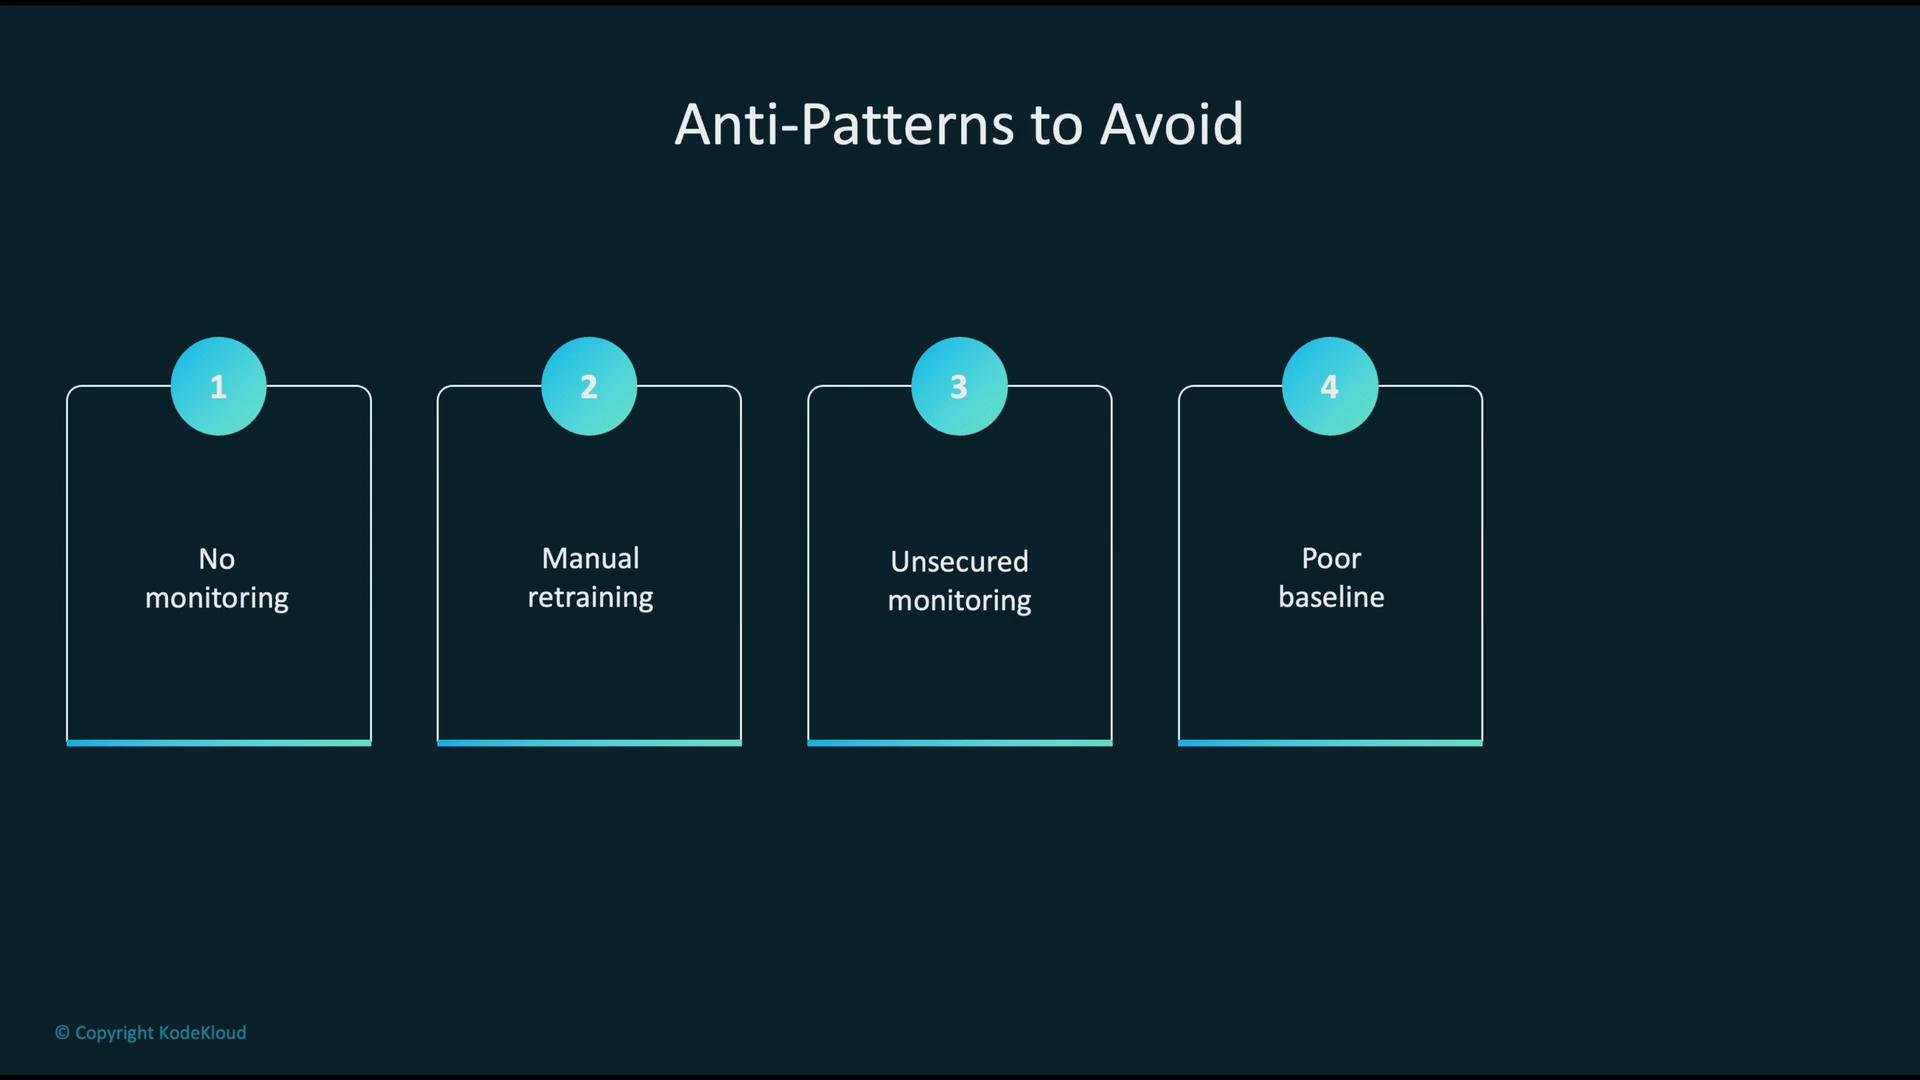
* No monitoring: blind to regressions and risky to operate.
* Manual retraining: not scalable and error-prone.
* Unsecured monitoring: insufficient access controls can leak sensitive data.
* Poor or missing baselines: you cannot reliably detect degradation without representative baselines.
* Untagged resources: makes management, auditing, and cost tracking difficult.
Anti-patterns to avoid in MLOps
* No monitoring: blind to regressions and risky to operate.
* Manual retraining: not scalable and error-prone.
* Unsecured monitoring: insufficient access controls can leak sensitive data.
* Poor or missing baselines: you cannot reliably detect degradation without representative baselines.
* Untagged resources: makes management, auditing, and cost tracking difficult.
 Operational checklist (summary)
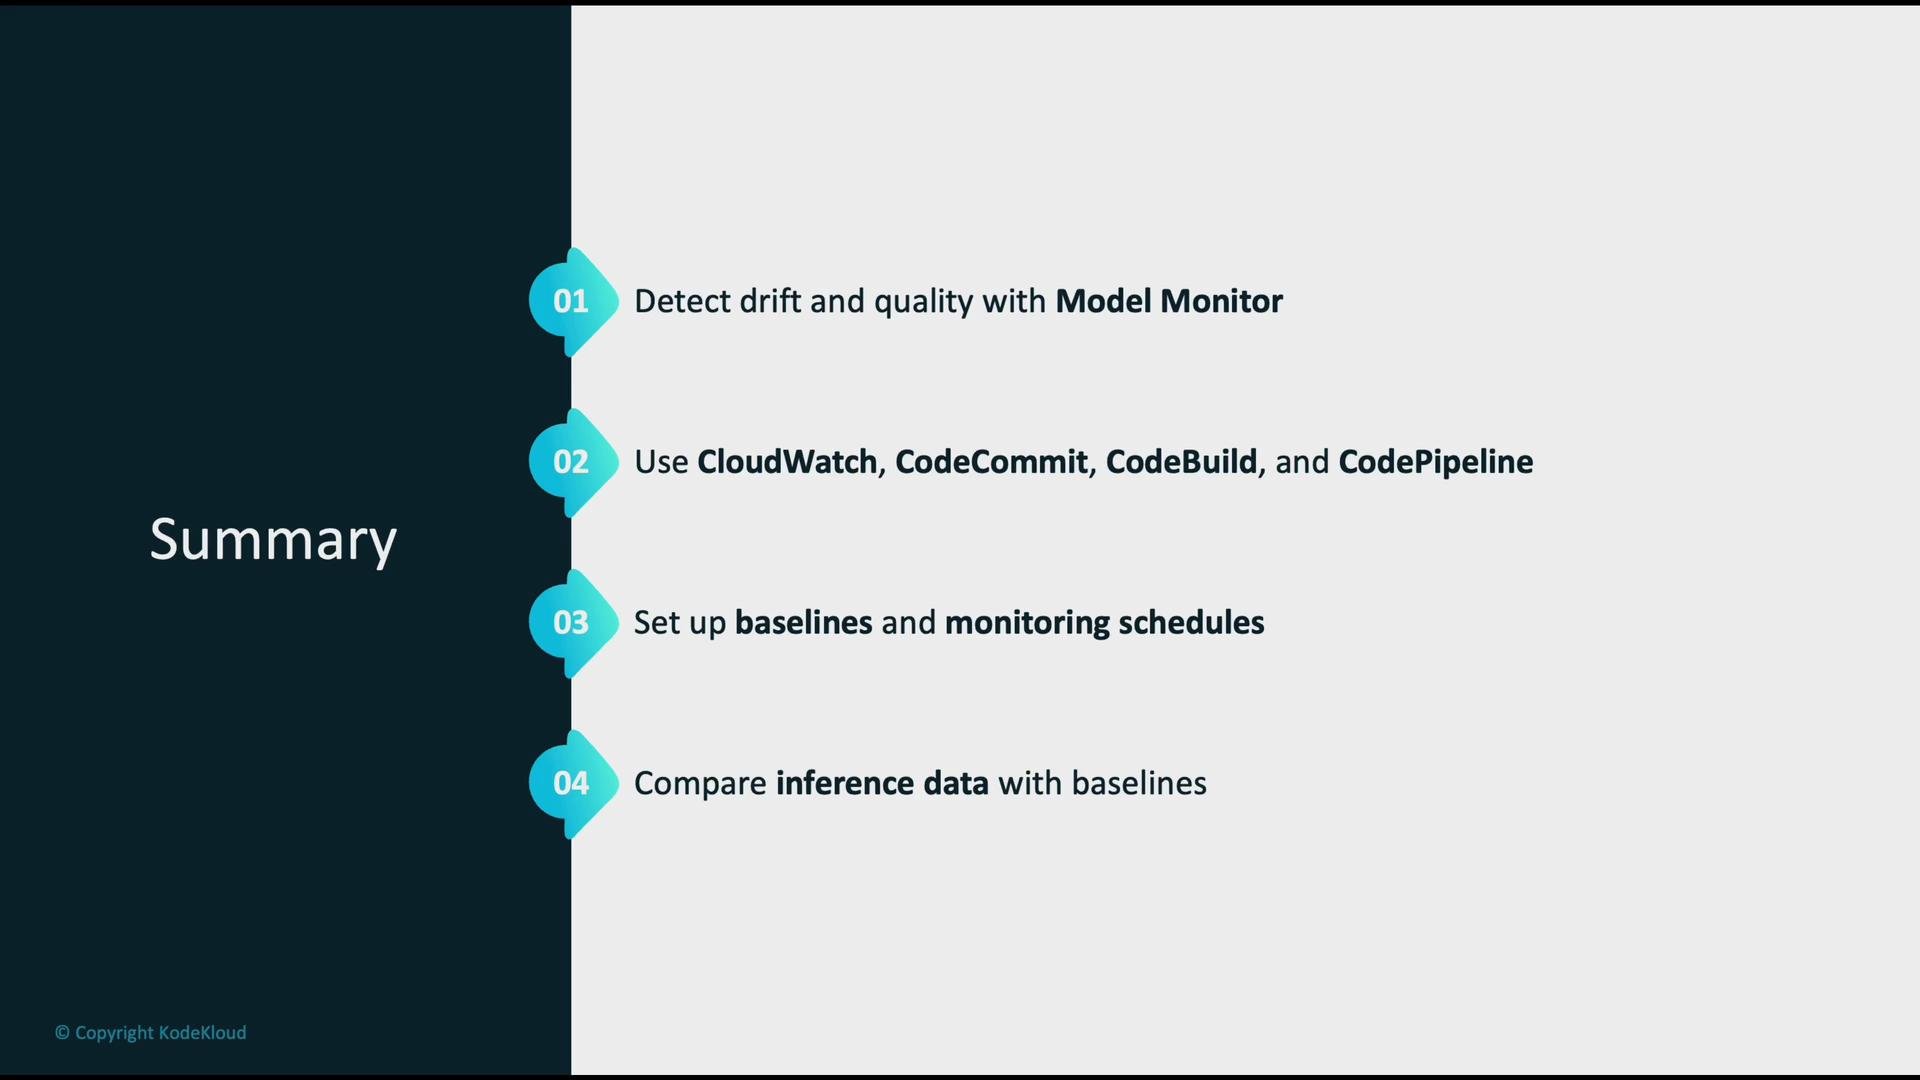
* Use SageMaker Model Monitor to detect drift and monitor model quality.
* Automate alerting and remediation with CloudWatch, Lambda, and CI/CD (CodeCommit/CodeBuild/CodePipeline).
* Establish a representative baseline and schedule regular monitoring jobs.
* Compare live inference data against the baseline and log monitoring outputs to S3 for auditing.
* Maintain a model registry and automate promotion/rollback in CI/CD.
Operational checklist (summary)
* Use SageMaker Model Monitor to detect drift and monitor model quality.
* Automate alerting and remediation with CloudWatch, Lambda, and CI/CD (CodeCommit/CodeBuild/CodePipeline).
* Establish a representative baseline and schedule regular monitoring jobs.
* Compare live inference data against the baseline and log monitoring outputs to S3 for auditing.
* Maintain a model registry and automate promotion/rollback in CI/CD.
 Best practices
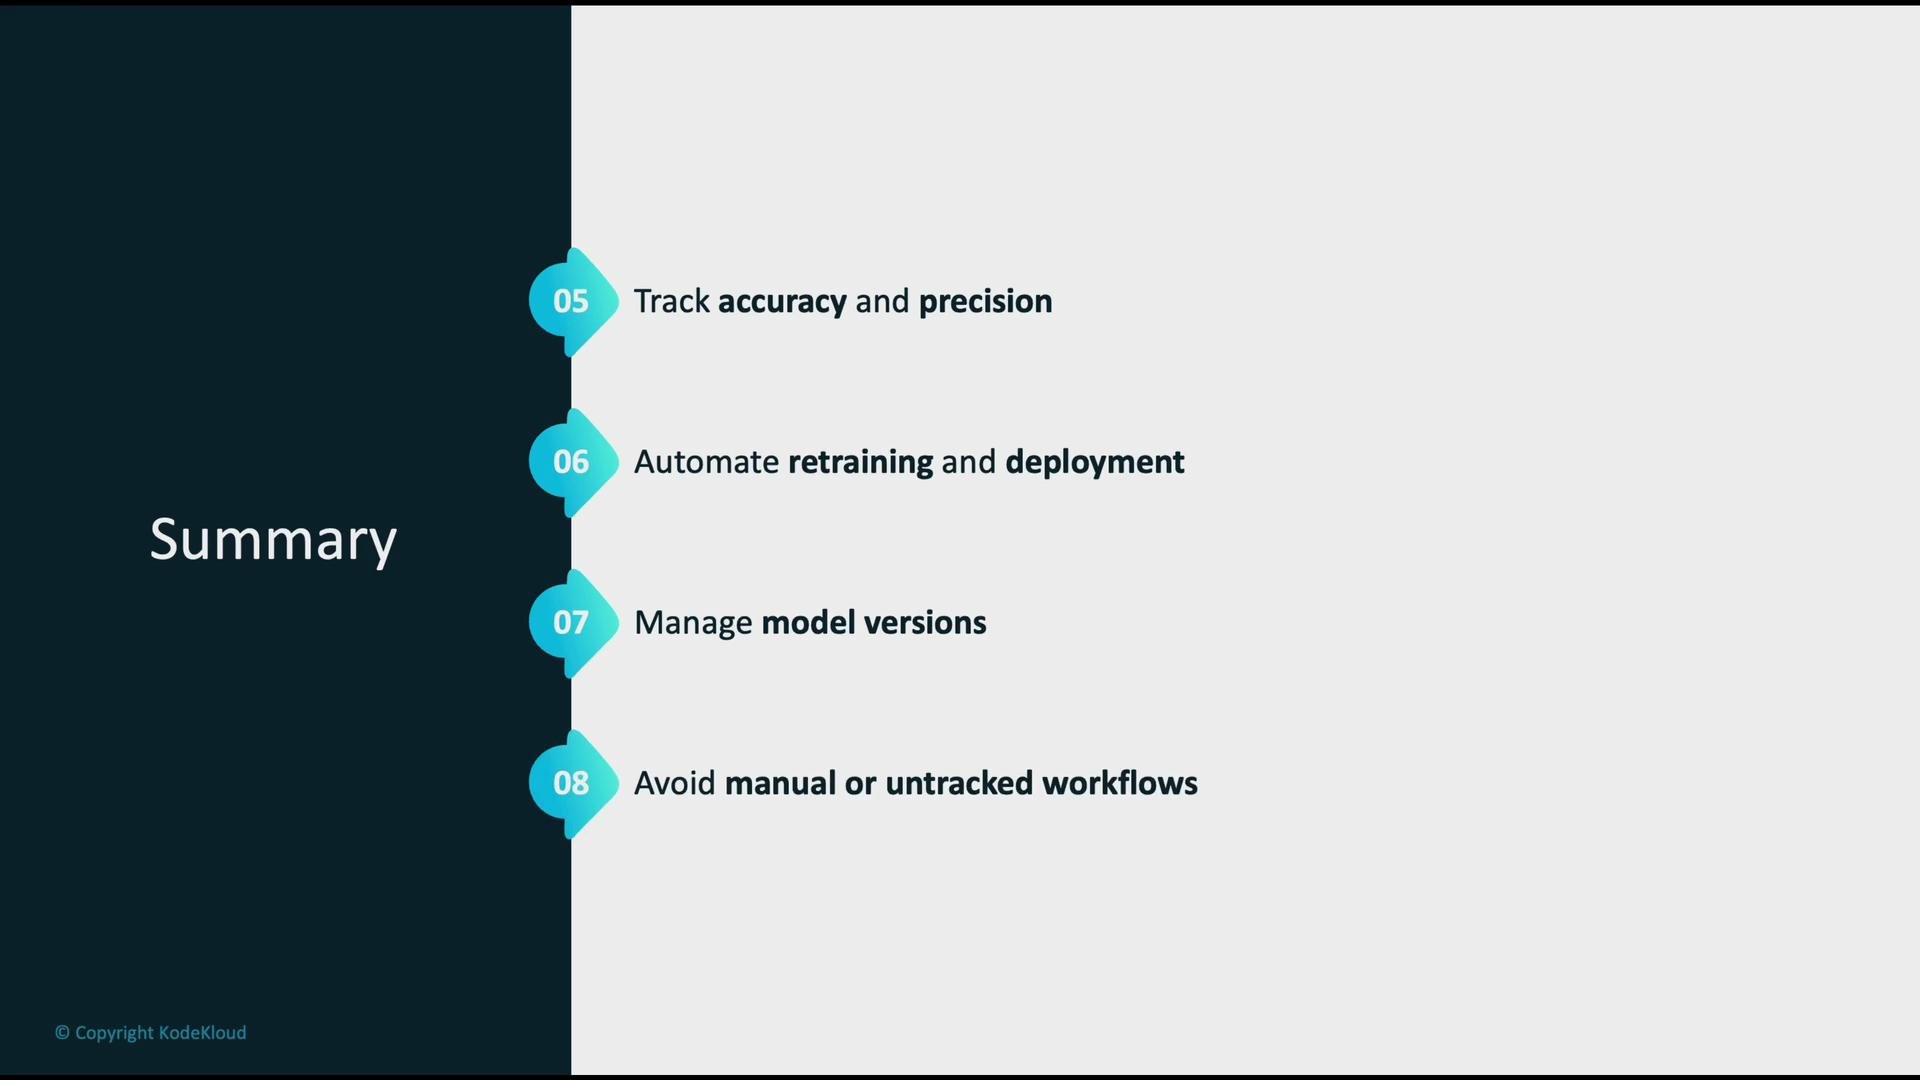
* Continuously track model metrics (accuracy, precision, recall, AUC) and infra metrics (latency, CPU, memory).
* Automate retraining and deployment pipelines wherever practical.
* Version and manage models centrally in a model registry.
* Avoid manual, untracked procedures that reduce reproducibility and increase risk.
Best practices
* Continuously track model metrics (accuracy, precision, recall, AUC) and infra metrics (latency, CPU, memory).
* Automate retraining and deployment pipelines wherever practical.
* Version and manage models centrally in a model registry.
* Avoid manual, untracked procedures that reduce reproducibility and increase risk.
 Practical examples
Example: create a CloudWatch alarm for Model Monitor violations (CLI)
```bash theme={null}
aws cloudwatch put-metric-alarm \
--alarm-name "ModelDriftAlarm" \
--metric-name "ViolationCount" \
--namespace "SageMaker/ModelMonitor" \
--statistic Sum \
--period 3600 \
--threshold 1 \
--comparison-operator GreaterThanOrEqualToThreshold \
--evaluation-periods 1 \
--alarm-actions `arn:aws:sns:us-east-1:123456789012:MyTopic`
```
Replace the SNS topic ARN above with your own value.
Tip: baseline selection and scheduling
Choose a baseline dataset that matches production traffic (seasonality, user cohorts). Schedule monitoring cadence to match business needs — frequent for real-time services, daily for batch processes. Store baselines and reports in S3 with clear prefixes and lifecycle rules.
Links and references
* [SageMaker Model Monitor documentation](https://docs.aws.amazon.com/sagemaker/latest/dg/model-monitor.html)
* [Amazon CloudWatch alarms](https://docs.aws.amazon.com/AmazonCloudWatch/latest/monitoring/AlarmThatSendsEmail.html)
* [AWS CI/CD documentation (CodeCommit, CodeBuild, CodePipeline)](https://aws.amazon.com/devops/continuous-delivery/)
Automate monitoring, enforce baselines, and gate deployments with a registry and CI/CD. This combination ensures fast detection of issues, reproducible remediation, and safer production rollouts.
Practical examples
Example: create a CloudWatch alarm for Model Monitor violations (CLI)
```bash theme={null}
aws cloudwatch put-metric-alarm \
--alarm-name "ModelDriftAlarm" \
--metric-name "ViolationCount" \
--namespace "SageMaker/ModelMonitor" \
--statistic Sum \
--period 3600 \
--threshold 1 \
--comparison-operator GreaterThanOrEqualToThreshold \
--evaluation-periods 1 \
--alarm-actions `arn:aws:sns:us-east-1:123456789012:MyTopic`
```
Replace the SNS topic ARN above with your own value.
Tip: baseline selection and scheduling
Choose a baseline dataset that matches production traffic (seasonality, user cohorts). Schedule monitoring cadence to match business needs — frequent for real-time services, daily for batch processes. Store baselines and reports in S3 with clear prefixes and lifecycle rules.
Links and references
* [SageMaker Model Monitor documentation](https://docs.aws.amazon.com/sagemaker/latest/dg/model-monitor.html)
* [Amazon CloudWatch alarms](https://docs.aws.amazon.com/AmazonCloudWatch/latest/monitoring/AlarmThatSendsEmail.html)
* [AWS CI/CD documentation (CodeCommit, CodeBuild, CodePipeline)](https://aws.amazon.com/devops/continuous-delivery/)
Automate monitoring, enforce baselines, and gate deployments with a registry and CI/CD. This combination ensures fast detection of issues, reproducible remediation, and safer production rollouts.