Deploying the CloudFormation Stack
Template Overview
The CloudFormation template below launches threet2.micro EC2 instances across different Availability Zones. It automatically retrieves the latest Amazon Linux 2 AMI ID from the AWS Systems Manager (SSM) Parameter Store.
Ensure you replace the
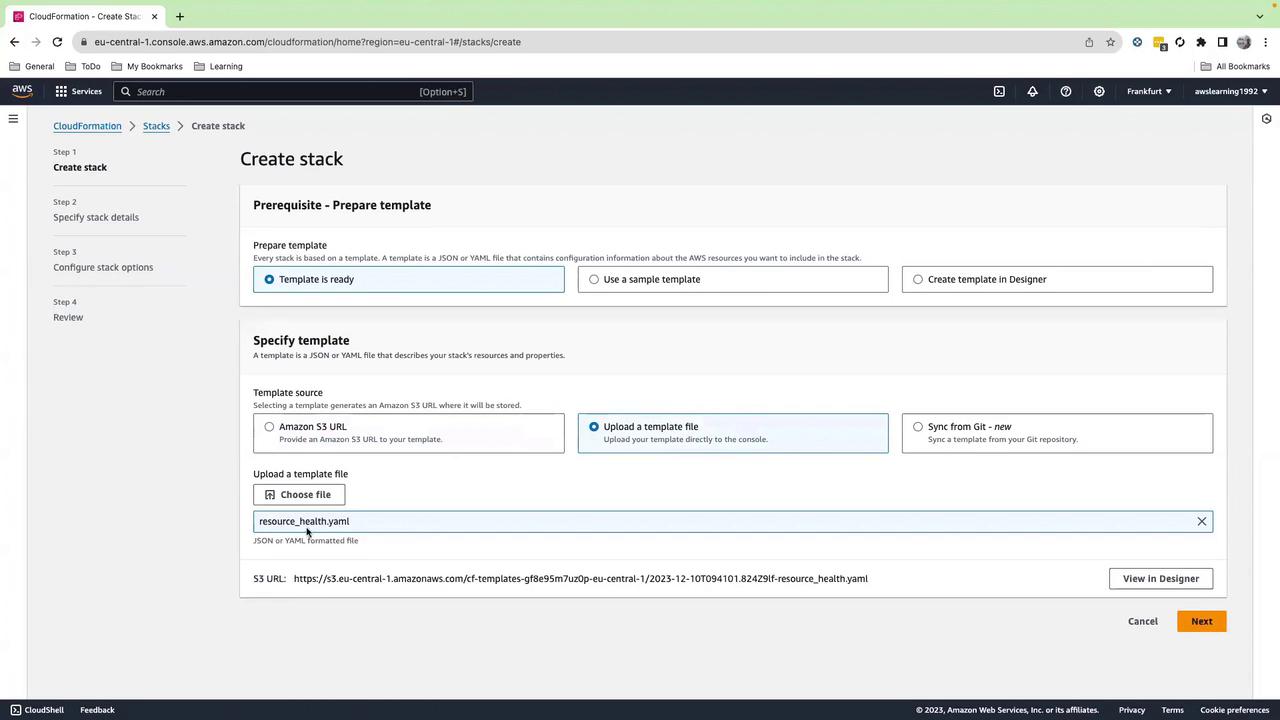
subnet-xxxxxxx values with valid subnet IDs from your VPC before deployment.- Open the AWS Management Console and navigate to CloudFormation.
- Choose Create stack > With new resources (standard).
- Under Template source, select Upload a template file and upload
resource_health.yaml. - Click Next, name your stack (e.g.,
resource-health-demo), then proceed through the configuration pages. - Review and click Create stack to launch the resources.
Verifying Stack Creation
Return to the CloudFormation dashboard and monitor the stack status. Deployment completes when the status changes to CREATE_COMPLETE.Stack creation can take several minutes. Do not interrupt the process or delete the stack until it reaches
CREATE_COMPLETE.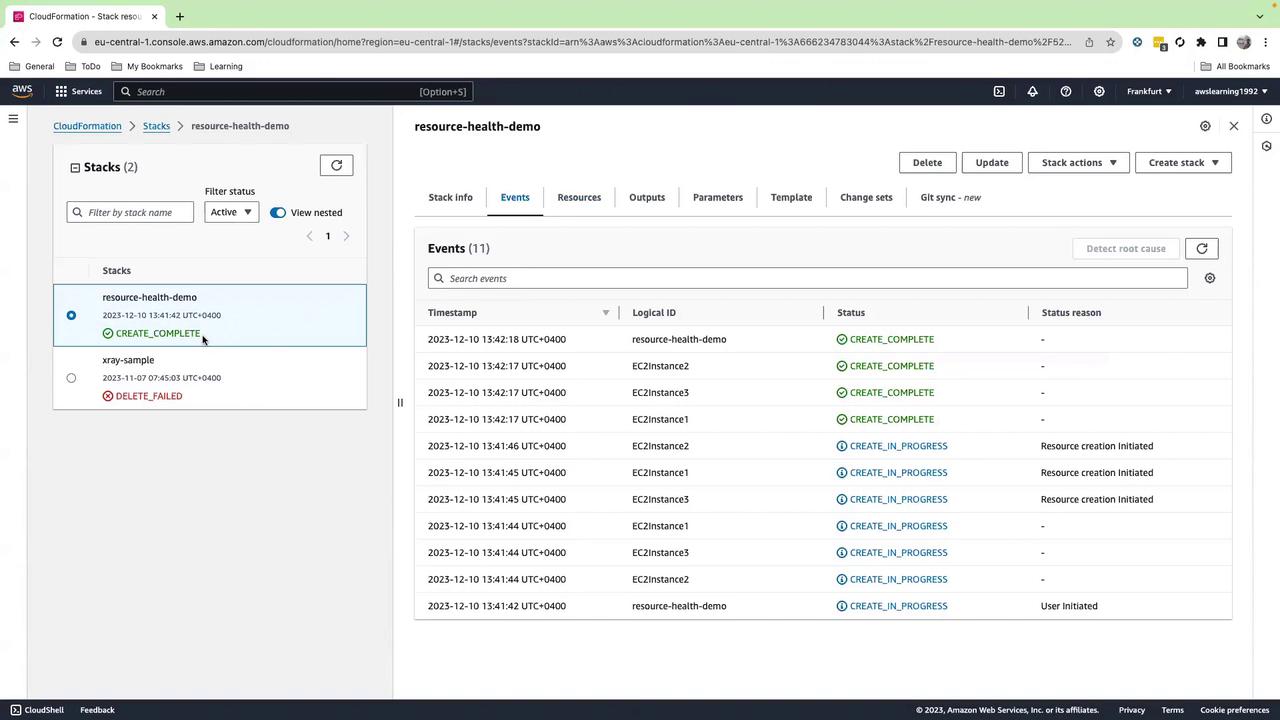
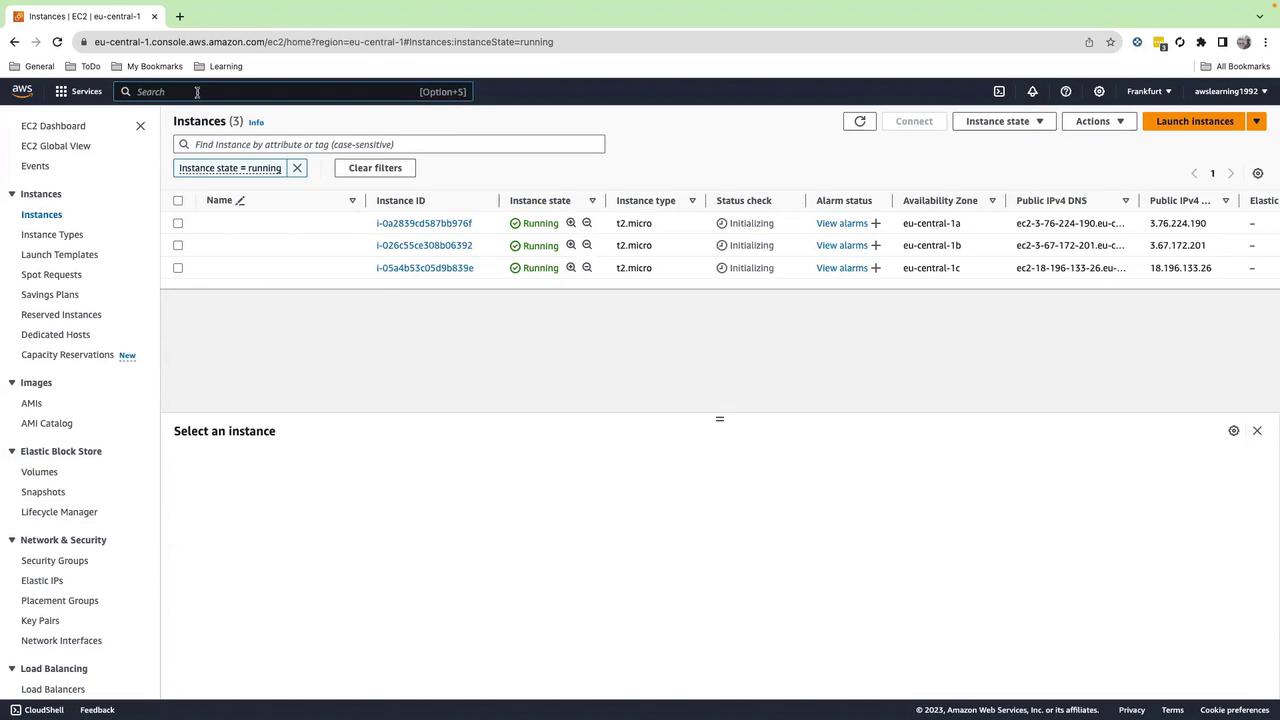
Confirming EC2 Instances
Once the stack reachesCREATE_COMPLETE, go to the EC2 console. Under Instances, verify that three t2.micro instances are Initializing or Running.
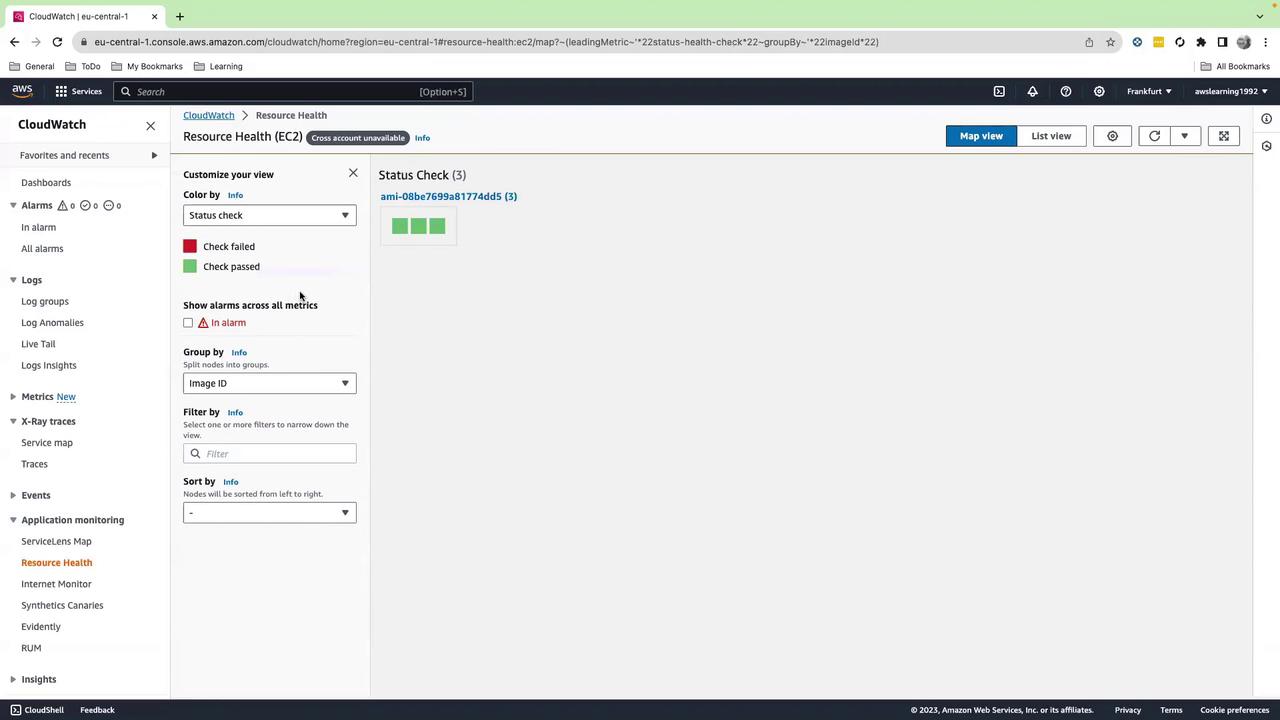
Exploring the CloudWatch Resource Health Dashboard
The CloudWatch Resource Health dashboard gives you a centralized view of instance-level metrics and status checks:- Open the CloudWatch console and select Resource Health.
- Choose EC2 as the resource type.
| Dimension | Options | Use Case |
|---|---|---|
| Metric | CPUUtilization, StatusCheckFailed | Monitor CPU load and health checks |
| Group by | Availability Zone, Instance Type, Image ID | Visualize grouping by AZ or instance |
| Sort by | CPUUtilization, StatusCheckFailed, Instance ID | Quickly identify high-usage instances |
- Blue: < 25%
- Green: 25%–50%
- Yellow: 50%–75%
- Red: > 75%
- CPU and memory usage (Memory requires [CloudWatch Agent] installation)
- Alarm state
- System and instance status checks
For large environments (hundreds of instances), use filters and grouping by tags, subnets, or Auto Scaling groups to quickly narrow down potential issues.
Conclusion
You’ve learned how to:- Deploy EC2 instances with AWS CloudFormation
- Retrieve the latest AMI via SSM Parameter Store
- Monitor instance health and metrics using the CloudWatch Resource Health dashboard
References
- AWS CloudFormation Documentation: https://docs.aws.amazon.com/cloudformation/
- Amazon EC2 User Guide: https://docs.aws.amazon.com/ec2/
- Amazon CloudWatch User Guide: https://docs.aws.amazon.com/cloudwatch/
- AWS Systems Manager Parameter Store: https://docs.aws.amazon.com/systems-manager/maintenance-windows/latest/userguide/parameter-store.html