> ## Documentation Index
> Fetch the complete documentation index at: https://notes.kodekloud.com/llms.txt
> Use this file to discover all available pages before exploring further.
# Internet Monitor
> Enhance observability of applications by tracking public internet performance with CloudWatch Internet Monitor to diagnose latency issues and integrate insights into monitoring workflows.
Enhance observability of your applications by tracking public internet performance with CloudWatch Internet Monitor. Learn how to diagnose latency issues, leverage anomaly detection, and integrate insights into your monitoring workflows.
## 1. Challenge: Diagnosing Public Internet Latency
Your application is hosted in an AWS US Region, while users in the UK and Europe typically see latencies between 40 ms and 100 ms. Occasionally they experience as low as 5 ms or spikes up to 70 ms. One day, a London user reports 900 ms latency, even though backend health checks remain steady at 100–200 ms.
Since your application metrics are healthy, the issue is likely somewhere on the public internet path. How can you pinpoint and resolve performance problems outside your AWS infrastructure?
## 2. Introducing Internet Monitor
CloudWatch Internet Monitor provides end-to-end visibility into internet traffic for your AWS resources. By analyzing real user network flow data, it helps you quickly identify and troubleshoot routing issues, ISP outages, or misconfigurations.
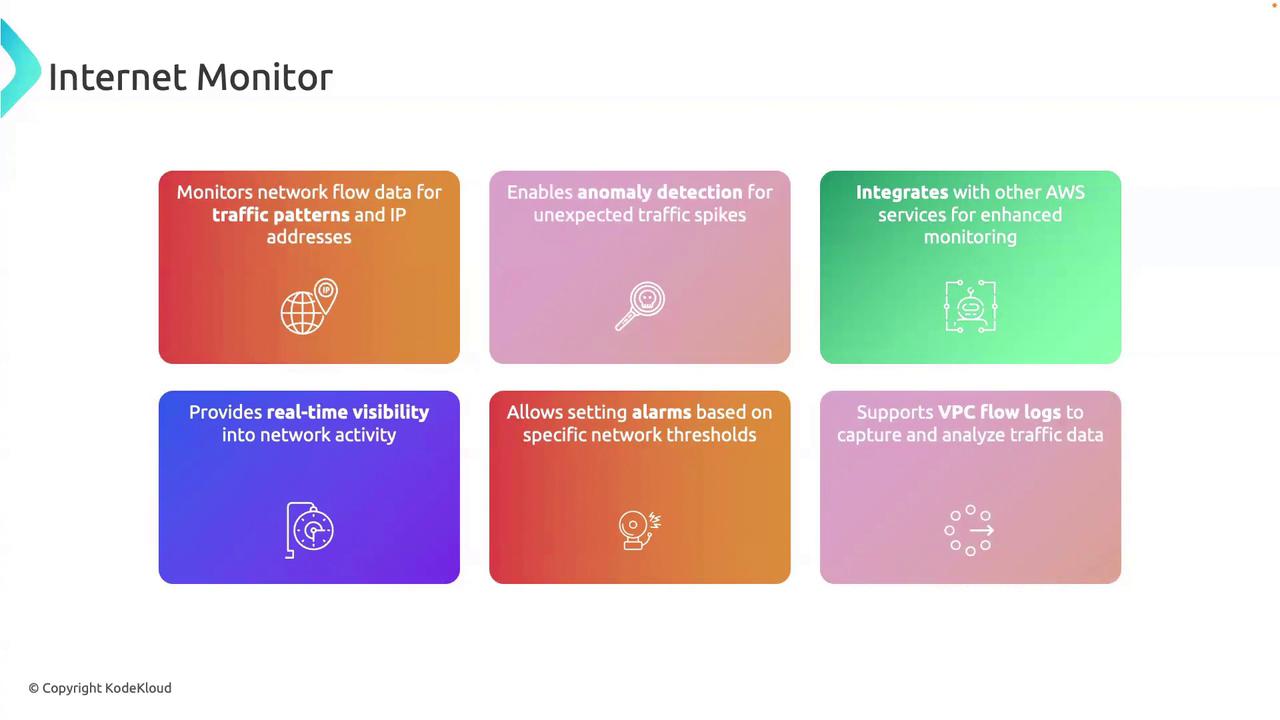
### Key Features
| Feature | Benefit |
| ----------------------------- | -------------------------------------------------------------------------- |
| Monitor Network Flow | Track traffic patterns and performance across the public internet. |
| Source & Destination Analysis | Identify IP prefixes and autonomous systems affecting your traffic. |
| Anomaly Detection | Automatically surface spikes in latency, packet loss, or throughput. |
| AWS Service Integration | Correlate internet-path data with CloudWatch dashboards, alarms, and Logs. |
| Real-Time Visibility | View live network performance to troubleshoot issues immediately. |
| Thresholds & Alarms | Set custom alerts on latency, bandwidth, or active connections. |
| Detailed Traffic Records | Aggregate IP traffic data for security audits and compliance. |
Ensure VPC Flow Logs are enabled and your IAM role has `internetmonitor:*` permissions before creating a monitor. See the [CloudWatch IAM Policies](https://docs.aws.amazon.com/IAM/latest/UserGuide/list_amazoncloudwatch.html) for details.
### Example: Enable Internet Monitor via AWS CLI
Replace the placeholders with your resource ARN and desired settings:
```bash theme={null}
aws internetmonitor create-monitor \
--monitor-name MyInternetMonitor \
--resources "arn:aws:ec2:us-east-1:123456789012:vpc/vpc-0a1b2c3d4e5f6g7h" \
--traffic-visibility "ALL" \
--client-token "$(uuidgen)"
```
## 3. Real-World Use Case: Troubleshooting a Latency Spike
1. **Alert Triggered**\
A CloudWatch alarm notifies you when latency exceeds 200 ms.
2. **Path Analysis**\
Internet Monitor shows a European ISP with elevated packet loss and latency.
3. **AWS Correlation**\
You confirm via CloudWatch metrics (ELB latency, EC2 network stats) that your backend is healthy.
4. **Remediation**\
You coordinate with the ISP to resolve routing issues or update Route 53 to reroute traffic through a different edge location.
Continuous monitoring may incur additional data processing and transfer charges. Review [CloudWatch Pricing](https://aws.amazon.com/cloudwatch/pricing/) to estimate costs.
## References
* [AWS CloudWatch Internet Monitor Documentation](https://docs.aws.amazon.com/AmazonCloudWatch/latest/monitoring/CloudWatch-Internet-Monitor.html)
* [CloudWatch Metrics and Dimensions](https://docs.aws.amazon.com/AmazonCloudWatch/latest/monitoring/CW_Support_For_AWS.html)
* [VPC Flow Logs Overview](https://docs.aws.amazon.com/vpc/latest/userguide/flow-logs.html)