> ## Documentation Index
> Fetch the complete documentation index at: https://notes.kodekloud.com/llms.txt
> Use this file to discover all available pages before exploring further.
# Real Time User Monitoring RUM
> AWS CloudWatch Real-Time User Monitoring captures and analyzes client-side performance data to optimize user experience and detect issues as they occur.
AWS CloudWatch Real-Time User Monitoring (RUM) captures, visualizes, and analyzes client-side performance data from browsers and mobile devices. By instrumenting your web or mobile application with RUM, you can detect issues as they happen, optimize user experience, and make data-driven decisions.
## Why Use Real-Time User Monitoring?
Modern applications must deliver fast, reliable experiences across a variety of devices and network conditions. With AWS CloudWatch RUM, you can:
* **Understand actual user experience** in real time
* **Detect performance regressions** and errors immediately
* **Correlate frontend telemetry** with backend metrics and logs
## Use Case Example
Imagine your customers browse your e-commerce site from desktops, tablets, and smartphones. A sudden spike in page load times on mobile may signal a CDN misconfiguration or a heavy third-party script. RUM lets you spot these anomalies in minutes and take corrective action.
## Getting Started with AWS CloudWatch RUM
1. Create a RUM app monitor in the Amazon CloudWatch console
2. Add the provided JavaScript snippet to your website or mobile SDK to begin collecting data
3. View client-side metrics and user sessions in the CloudWatch RUM dashboard
Before deploying to production, verify user consent and compliance with data-privacy regulations when collecting client-side telemetry.
## Key Features
| Feature | Description | Benefit |
| -------------------------------- | ----------------------------------------------------------------------------------------- | -------------------------------------------------------------- |
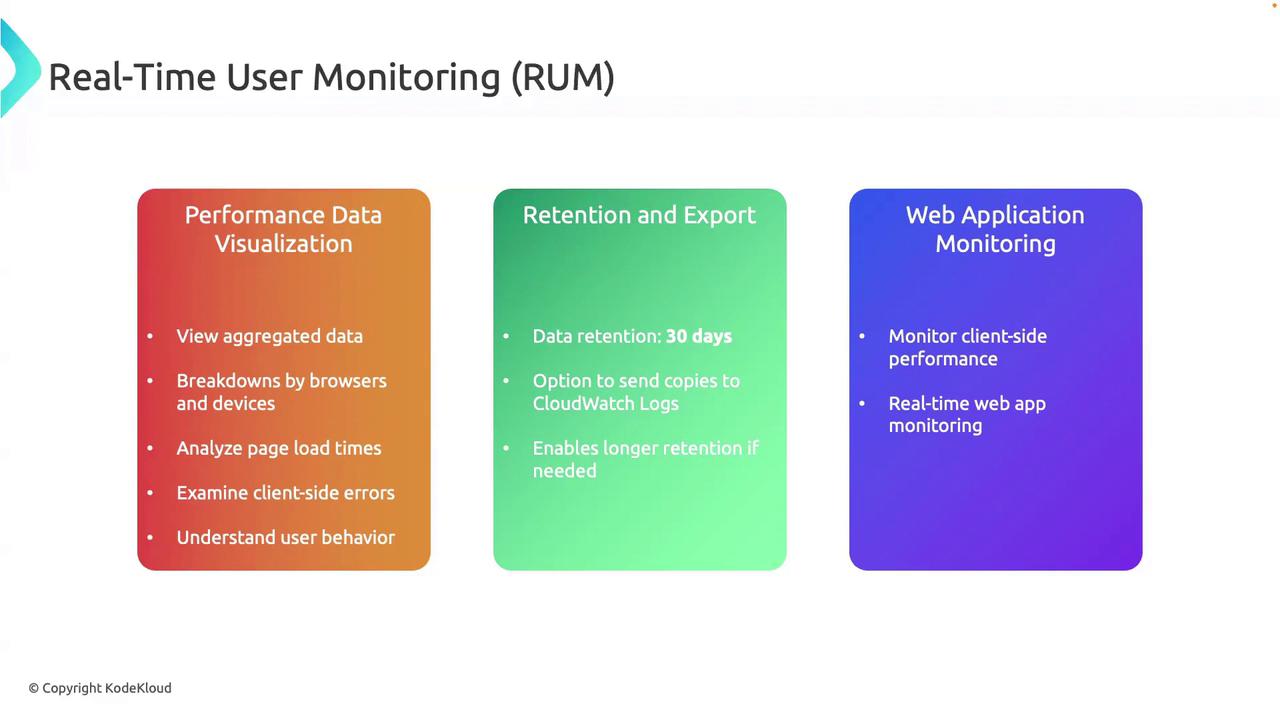
| Performance Data Visualization | Aggregated charts for page load times, user interactions, and resource timings. | Quickly identify slow pages and resource bottlenecks. |
| Breakdowns by Browser & Device | Slice and dice metrics by browser type, device model, or geography. | Understand performance discrepancies across user environments. |
| Client-side Error Tracking | Capture JavaScript errors and stack traces directly from the user’s session. | Speed up debugging by pinpointing error sources. |
| Data Retention & Export | Default 30-day retention in CloudWatch, with optional export to CloudWatch Logs or S3. | Maintain historical data for audits or deep analysis. |
| Real-Time Alerts & Notifications | Configure alerts for performance thresholds or error rates via Amazon SNS or AWS Chatbot. | Respond immediately to performance degradations. |
### Retention and Long-Term Storage
* **30-Day Default**: RUM data is stored in CloudWatch Metrics for 30 days.
* **Export Options**: Send RUM data to CloudWatch Logs or S3 for extended retention.
* **Lifecycle Policies**: Configure S3 lifecycle rules to archive or delete old data.
Exporting large volumes of RUM data to S3 can incur storage costs. Review your retention policies to control expenses.
### Real-Time Monitoring & Analytics
* **Instant Detection**: Dashboards refresh in seconds, so you can spot issues as they emerge.
* **User Session Replay**: Inspect individual sessions to understand the exact user journey.
* **Data-Driven Improvements**: Use RUM insights to prioritize frontend optimizations and feature rollouts.
## Conclusion
AWS CloudWatch RUM empowers development and operations teams with end-to-end visibility into client-side performance. From detailed visualizations and real-time alerts to long-term data retention and export capabilities, RUM helps you maintain a smooth, responsive experience for your users.
***
## Links and References
* [AWS CloudWatch RUM Documentation](https://docs.aws.amazon.com/AmazonCloudWatch/latest/monitoring/CloudWatch-RUM.html)
* [Getting Started with CloudWatch RUM](https://docs.aws.amazon.com/AmazonCloudWatch/latest/monitoring/CloudWatch-RUM-GettingStarted.html)
* [Amazon CloudWatch Pricing](https://aws.amazon.com/cloudwatch/pricing/)