> ## Documentation Index
> Fetch the complete documentation index at: https://notes.kodekloud.com/llms.txt
> Use this file to discover all available pages before exploring further.
# Alarm States
> This article explains the states of AWS CloudWatch alarms and their configuration settings for monitoring metrics against defined thresholds.
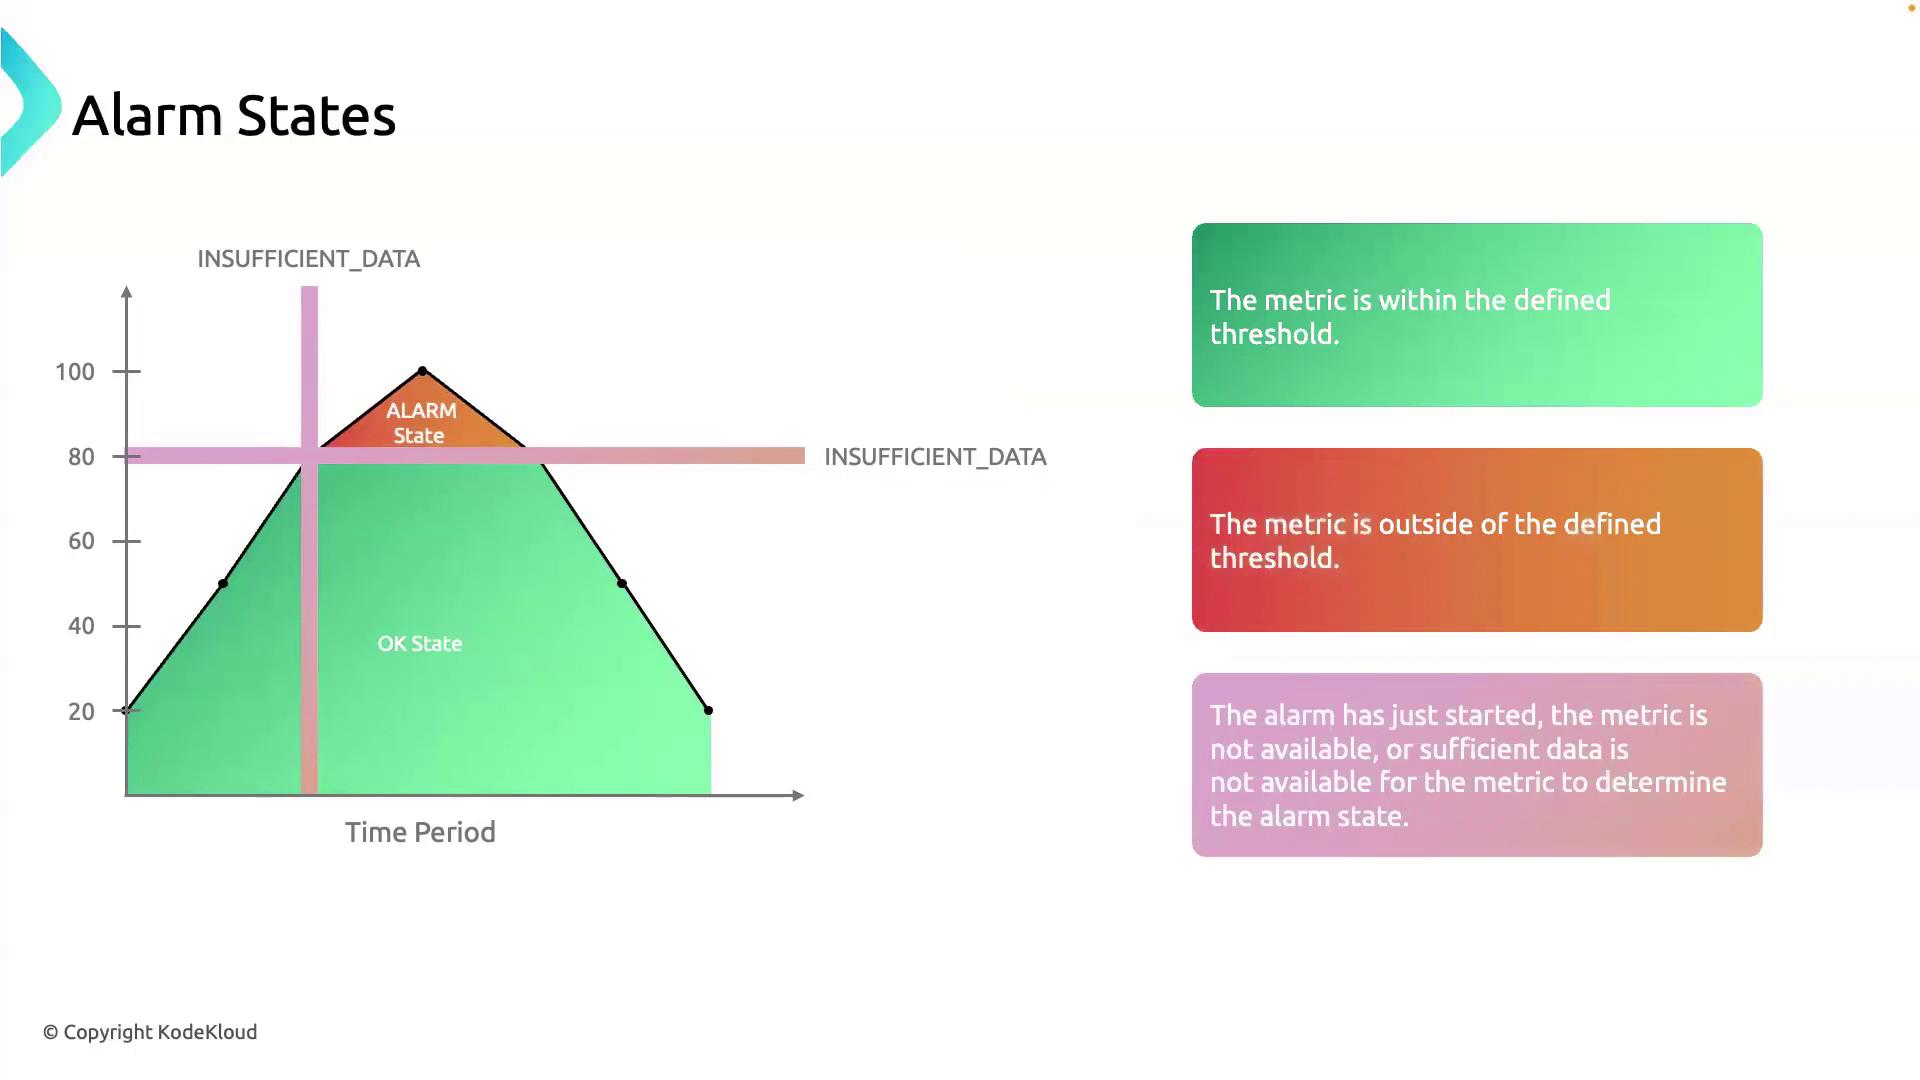
AWS CloudWatch alarms continuously monitor metrics and compare them against your defined thresholds. An alarm can reside in one of three states:
| Alarm State | Description |
| ---------------------- | ---------------------------------------------------------------------------------- |
| **OK** | Metric value is within the defined threshold. |
| **ALARM** | Metric value breaches the threshold for the required number of evaluation periods. |
| **INSUFFICIENT\_DATA** | Not enough datapoints yet to determine the state. |
## Core Configuration Settings
CloudWatch evaluates your metrics based on three key parameters:
| Setting | Definition |
| ---------------------- | -------------------------------------------------------------- |
| **Threshold** | The metric limit that triggers the alarm (e.g., > 70% CPU). |
| **Period** | The duration for each datapoint aggregation (e.g., 5 minutes). |
| **Evaluation Periods** | Number of consecutive periods that must breach the threshold. |
When an alarm has fewer datapoints than the specified evaluation periods (for example, at startup or during missing metrics), it transitions to **INSUFFICIENT\_DATA** until it can fully evaluate the threshold.
## How States Transition
Imagine you set up an alarm on an RDS instance to fire when CPU utilization exceeds 70%, with:
* Period = 5 minutes
* Evaluation Periods = 3
1. **Period 1**: CPU spikes to 80% → only one breach datapoint → state moves to **INSUFFICIENT\_DATA**
2. **Period 2**: CPU remains above 70% → second breach datapoint → still **INSUFFICIENT\_DATA**
3. **Period 3**: CPU stays above 70% → third breach datapoint → state transitions to **ALARM**
If the CPU then drops below 70% for three consecutive periods, the alarm returns to **OK**.
## References
* [AWS CloudWatch Alarms Documentation](https://docs.aws.amazon.com/AmazonCloudWatch/latest/monitoring/AlarmThatSendsEmail.html)
* [AWS CloudWatch Metrics and Dimensions](https://docs.aws.amazon.com/AmazonCloudWatch/latest/monitoring/CW_Support_For_AWS.html)
* [Working with Datapoints and Statistics](https://docs.aws.amazon.com/AmazonCloudWatch/latest/monitoring/cloudwatch_concepts.html#Statistic)