> ## Documentation Index
> Fetch the complete documentation index at: https://notes.kodekloud.com/llms.txt
> Use this file to discover all available pages before exploring further.
# Built in and Custom Metrics
> This guide explores AWS CloudWatchs built-in, custom, and usage metrics for monitoring RDS instances in a VPC.
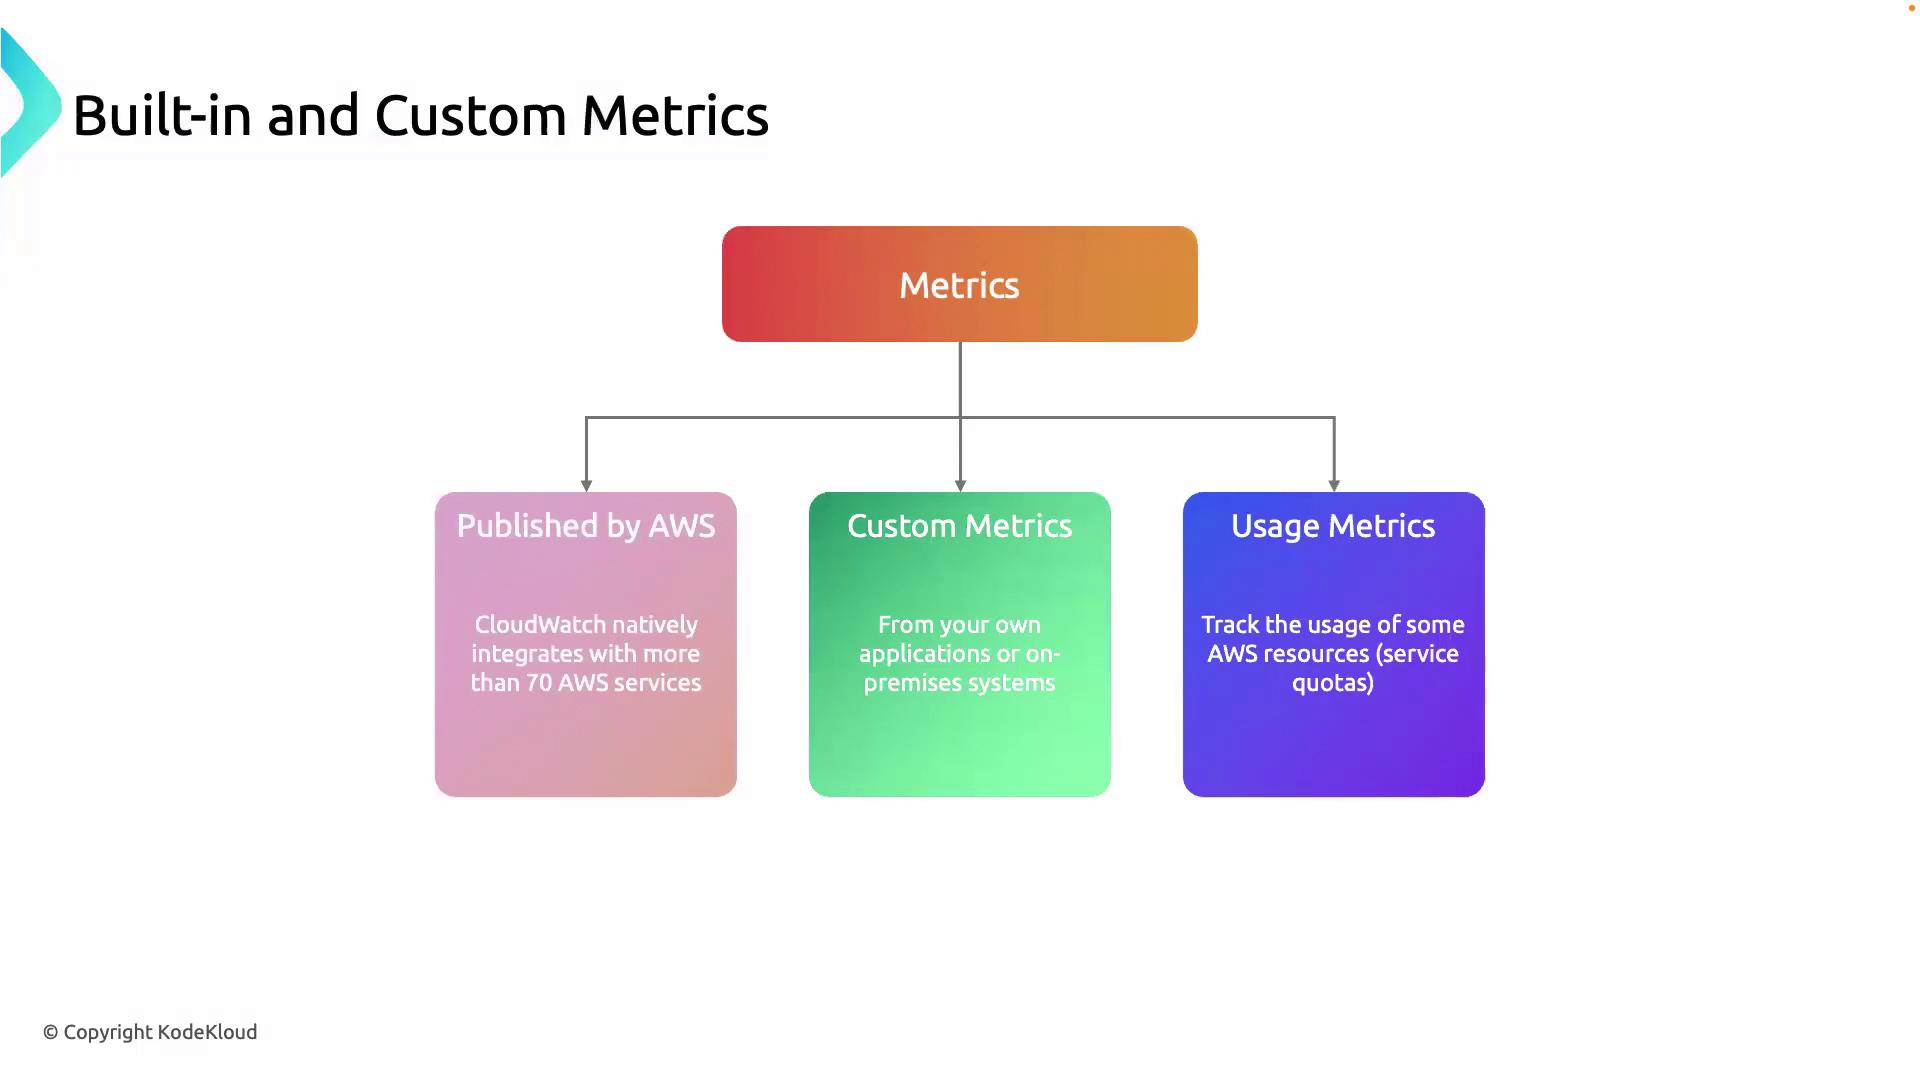
In this guide, we’ll explore the three primary metric types in AWS CloudWatch—**built-in metrics**, **custom metrics**, and **usage metrics**—and demonstrate how to apply them when monitoring an RDS instance in a VPC. By the end, you’ll understand how to gain a comprehensive view of your resource health, application performance, and usage quotas.
## 1. Metric Types Overview
CloudWatch collects and organizes data into different metric categories. Leveraging all three types helps you:
* Track core resource performance
* Gather application-specific insights
* Monitor service consumption against quotas
| Metric Type | Source | Use Case |
| ----------- | --------------------------------------- | ------------------------------------------------------- |
| Built-in | AWS-managed (70+ services) | CPU, disk I/O, network throughput, memory usage |
| Custom | User-defined via API or SDK | Transaction counts, cache hit rates, API response times |
| Usage | AWS service quotas and usage statistics | Track service limits, forecast capacity, avoid overruns |
### 1.1 Built-in Metrics
CloudWatch automatically publishes metrics for over 70 AWS services. Examples include:
* CPUUtilization
* NetworkIn / NetworkOut
* DiskReadBytes / DiskWriteBytes
Built-in metrics have a default 1-minute resolution. To enable 1-second (high-resolution) metrics for supported services, see the [CloudWatch detailed monitoring documentation](https://docs.aws.amazon.com/AmazonCloudWatch/latest/monitoring/WhatIsCloudWatch.html).
### 1.2 Custom Metrics
When default metrics aren’t enough, you can push any numeric data via the *PutMetricData* API. Common examples:
* Order processing rate
* Cache hit ratio
* Endpoint response time
Custom metrics incur additional charges. Review the [CloudWatch pricing page](https://aws.amazon.com/cloudwatch/pricing/) before publishing high-cardinality or high-frequency data.
### 1.3 Usage Metrics
Usage metrics track how close you are to AWS service quotas (limits). These are crucial for:
* Monitoring API call volumes
* Ensuring you don’t exceed resource limits
* Forecasting future capacity needs
## 2. Practical Example: Monitoring RDS in a VPC
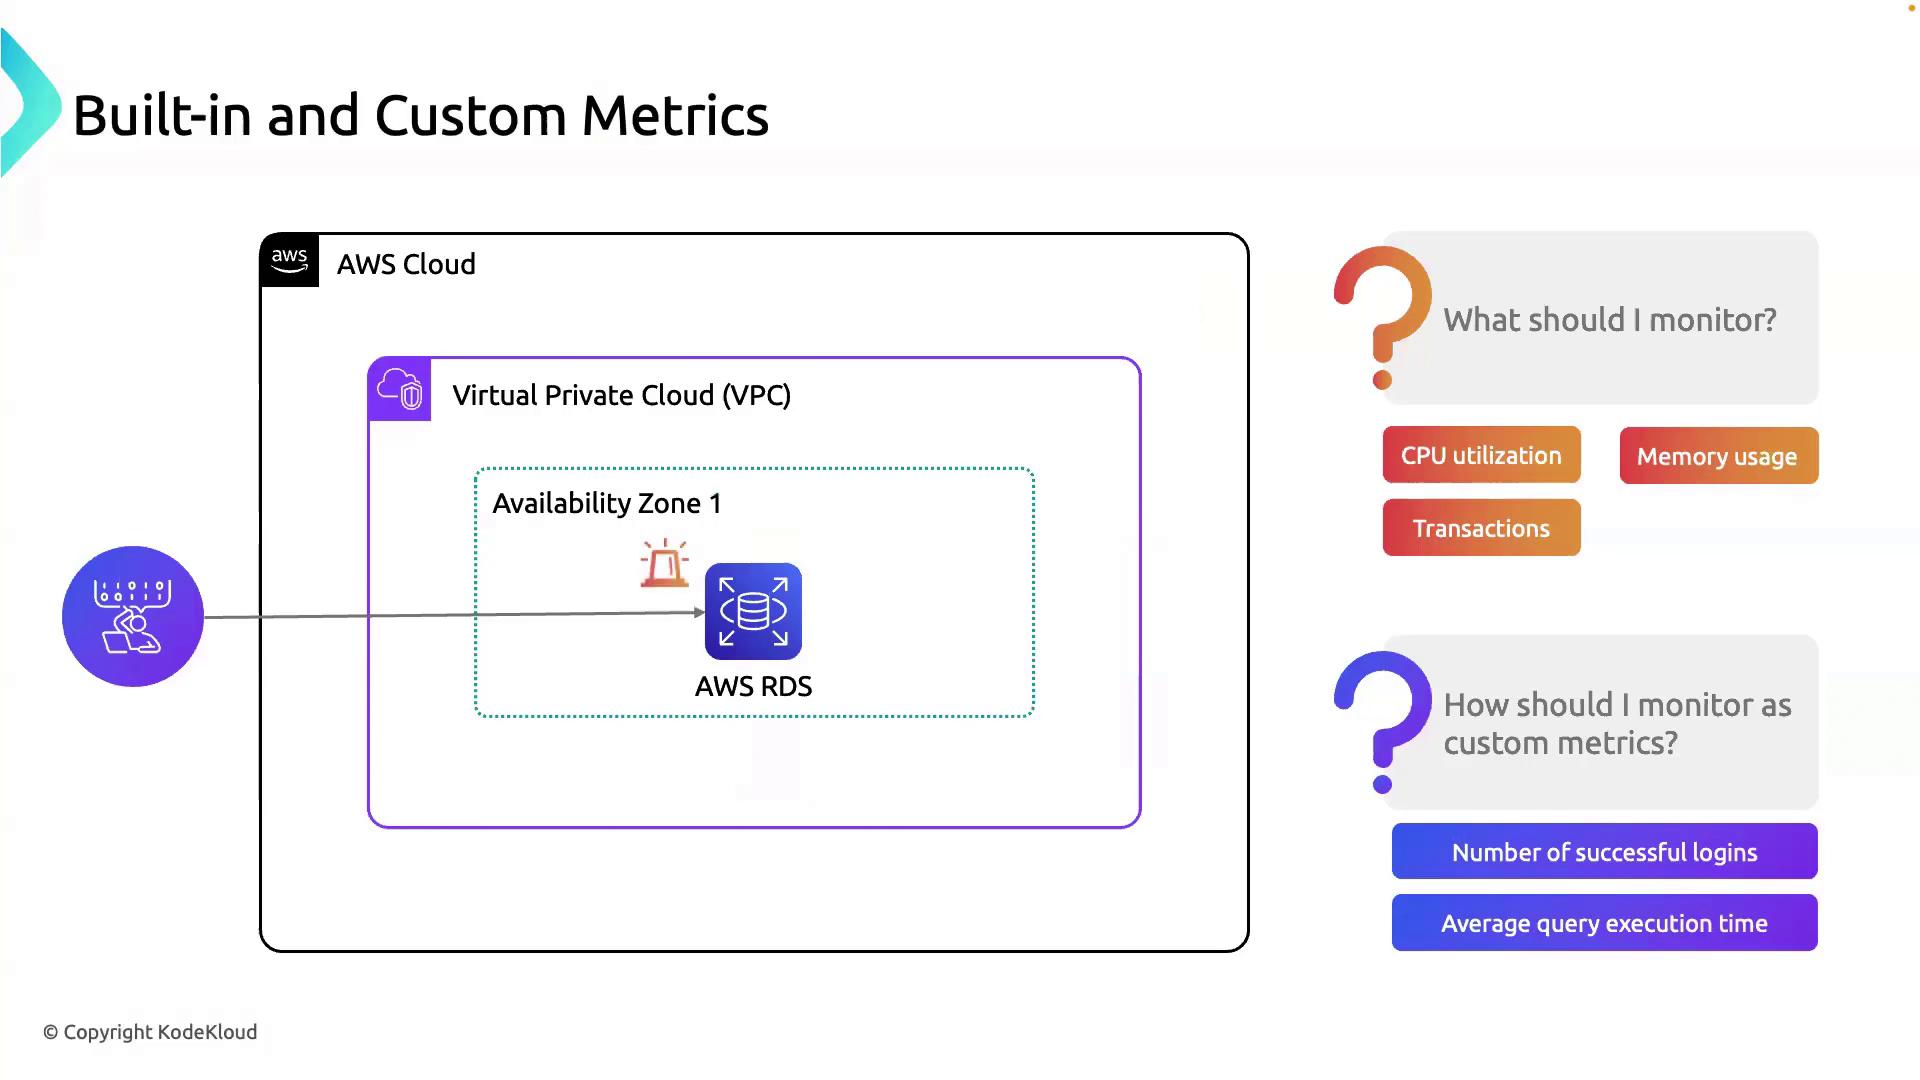
Let’s apply these metric types to an Amazon RDS instance running in a Virtual Private Cloud.
### 2.1 Built-in RDS Metrics
AWS RDS publishes dozens of metrics by default. Key ones include:
| Metric Name | Description | Unit |
| -------------------- | ---------------------------------- | ----------- |
| CPUUtilization | Percentage of CPU in use | Percent (%) |
| FreeableMemory | Available RAM in the instance | Bytes |
| ReadIOPS / WriteIOPS | Disk read/write operations per sec | Count/sec |
| DatabaseConnections | Active connections to the DB | Count |
### 2.2 Custom RDS Metrics
Enhance observability with application-specific data:
| Metric Name | Description | Collection Interval |
| --------------------- | ------------------------------------------- | ------------------- |
| LoginsPerMinute | Number of successful user logins | 1 minute |
| AvgQueryExecutionTime | Average time to execute SQL queries | 1 minute |
| CacheHitRatio | Percentage of cache hits vs. total requests | 1 minute |
Use the AWS SDK or CLI command `aws cloudwatch put-metric-data` to publish custom metrics from your application or monitoring scripts.
## 3. Next Steps
With metrics in place, you can now:
* Set up **CloudWatch Alarms** to get notified on thresholds
* Build **CloudWatch Dashboards** for real-time visualization
* Integrate with [AWS CloudWatch Logs](https://docs.aws.amazon.com/AmazonCloudWatch/latest/logs/WhatIsCloudWatchLogs.html) for log monitoring
***
## Links and References
* [AWS CloudWatch Metrics and Dimensions](https://docs.aws.amazon.com/AmazonCloudWatch/latest/monitoring/CW_Support_For_AWS.html)
* [Amazon RDS Monitoring](https://docs.aws.amazon.com/AmazonRDS/latest/UserGuide/MonitoringOverview.html)
* [CloudWatch Pricing](https://aws.amazon.com/cloudwatch/pricing/)
* [AWS SDK for Go CloudWatch Guide](https://docs.aws.amazon.com/sdk-for-go/api/service/cloudwatch/)