> ## Documentation Index
> Fetch the complete documentation index at: https://notes.kodekloud.com/llms.txt
> Use this file to discover all available pages before exploring further.

# Demo Creating and Configuring Alarms with alerting

> This hands-on tutorial teaches launching an EC2 instance, generating load, and setting up CloudWatch alarms with SNS notifications.

In this hands-on tutorial, you’ll learn how to launch an EC2 instance, generate system load, and set up a CloudWatch alarm with SNS notifications. By the end, you’ll have:

* A running EC2 instance under stress
* A CPU utilization alarm
* Email notifications on alarm trigger

## 1. Launch an EC2 Instance

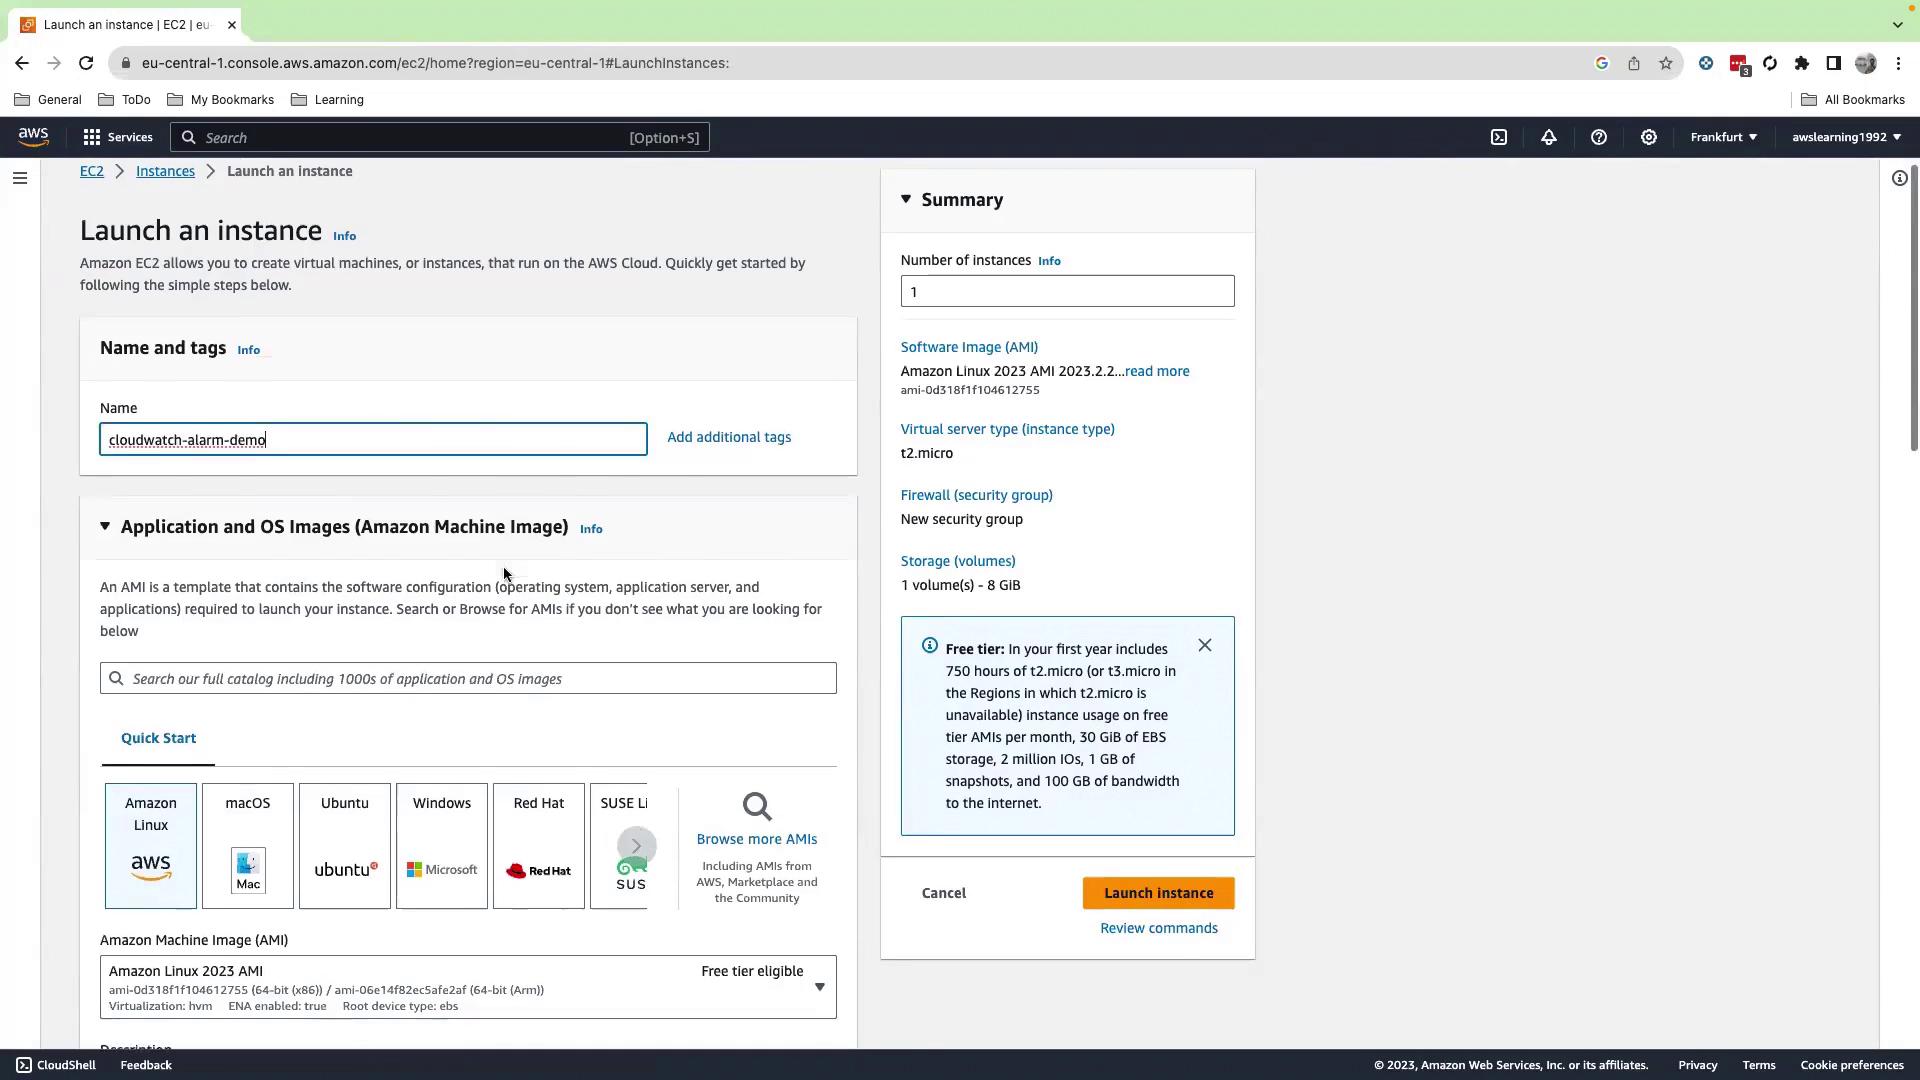
1. Sign in to the AWS Management Console and confirm you’re in the correct region.
2. Navigate to **EC2 → Instances** and click **Launch Instance**.
3. Under **Name**, enter `demo-instance`. Select **Amazon Linux 2023** as your AMI.
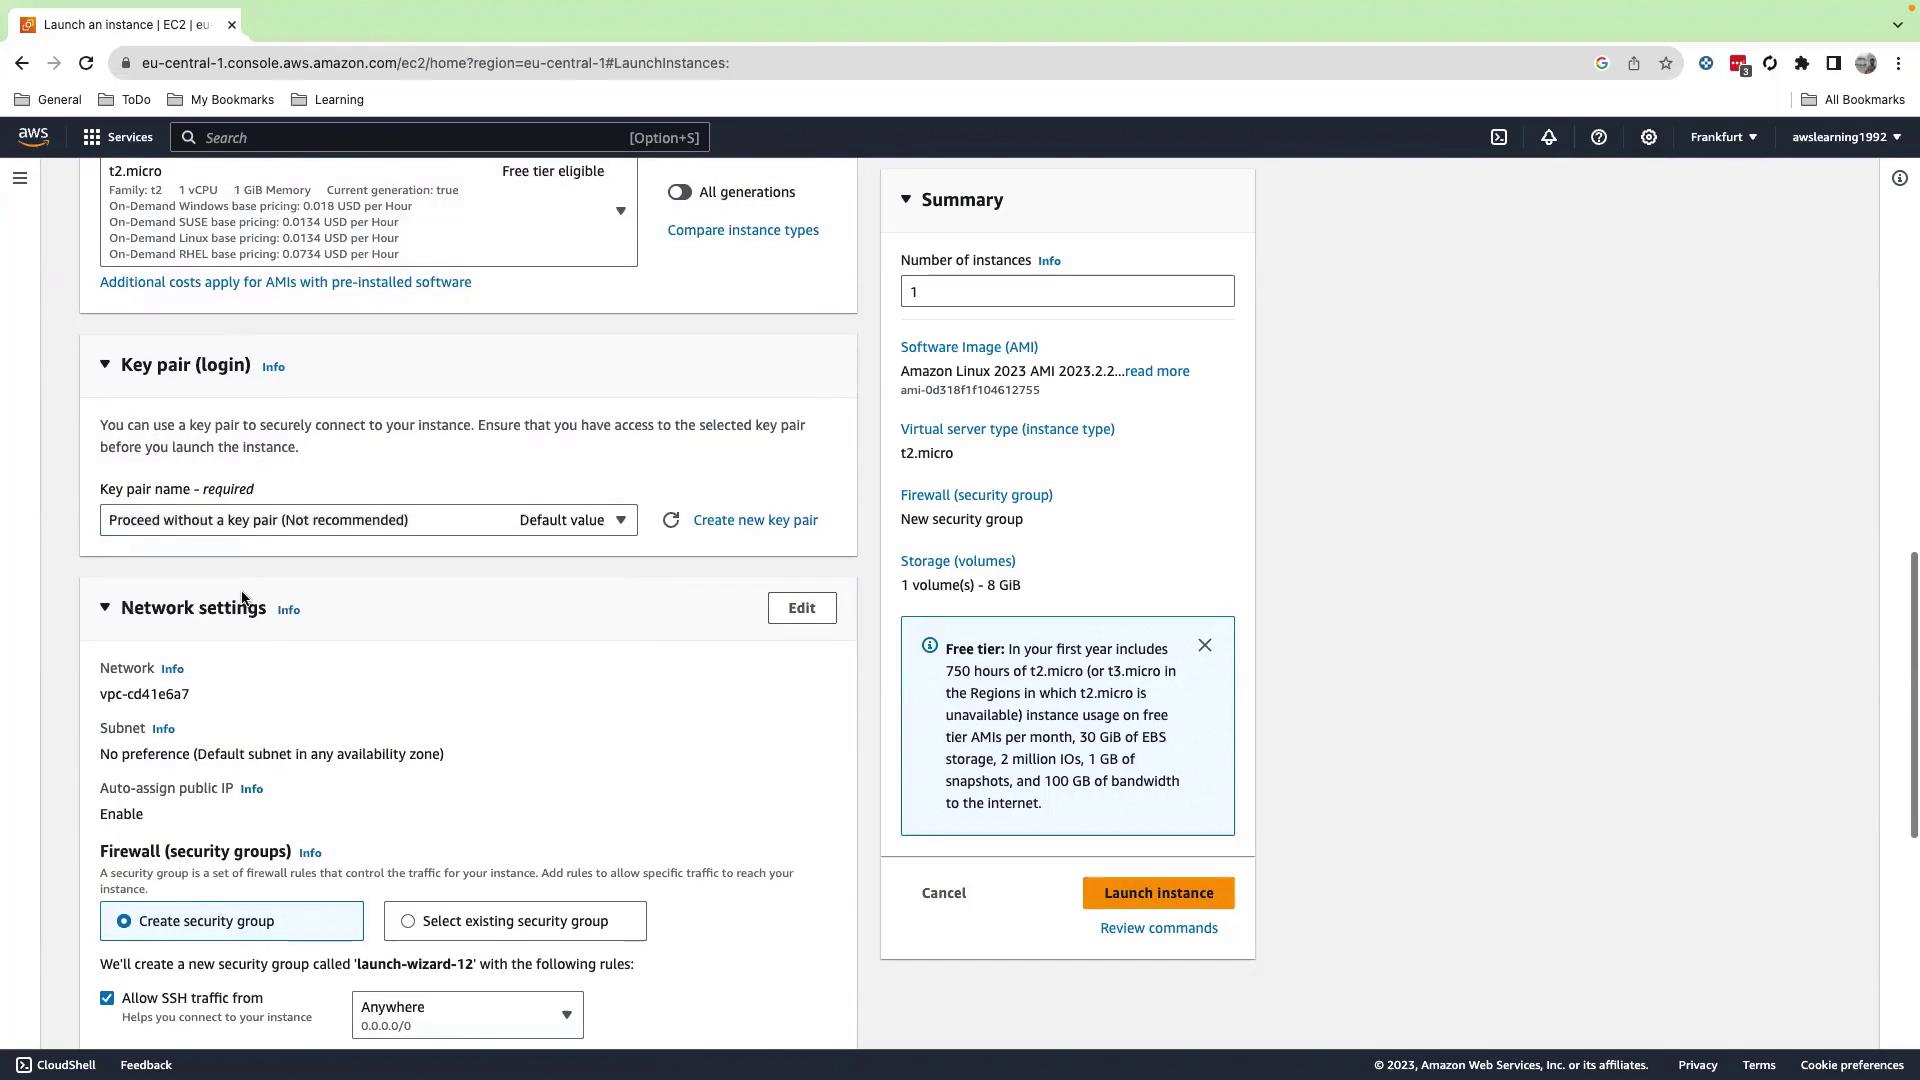
4. In **Key pairs**, choose **Proceed without a key pair**.

<Callout icon="triangle-alert" color="#FF6B6B">
  Launching without a key pair prevents SSH login via key-based authentication. You’ll connect using EC2 Instance Connect or Session Manager.
</Callout>

5. Keep the default VPC and subnet. Under **Security groups**, select **Create security group** with default rules.
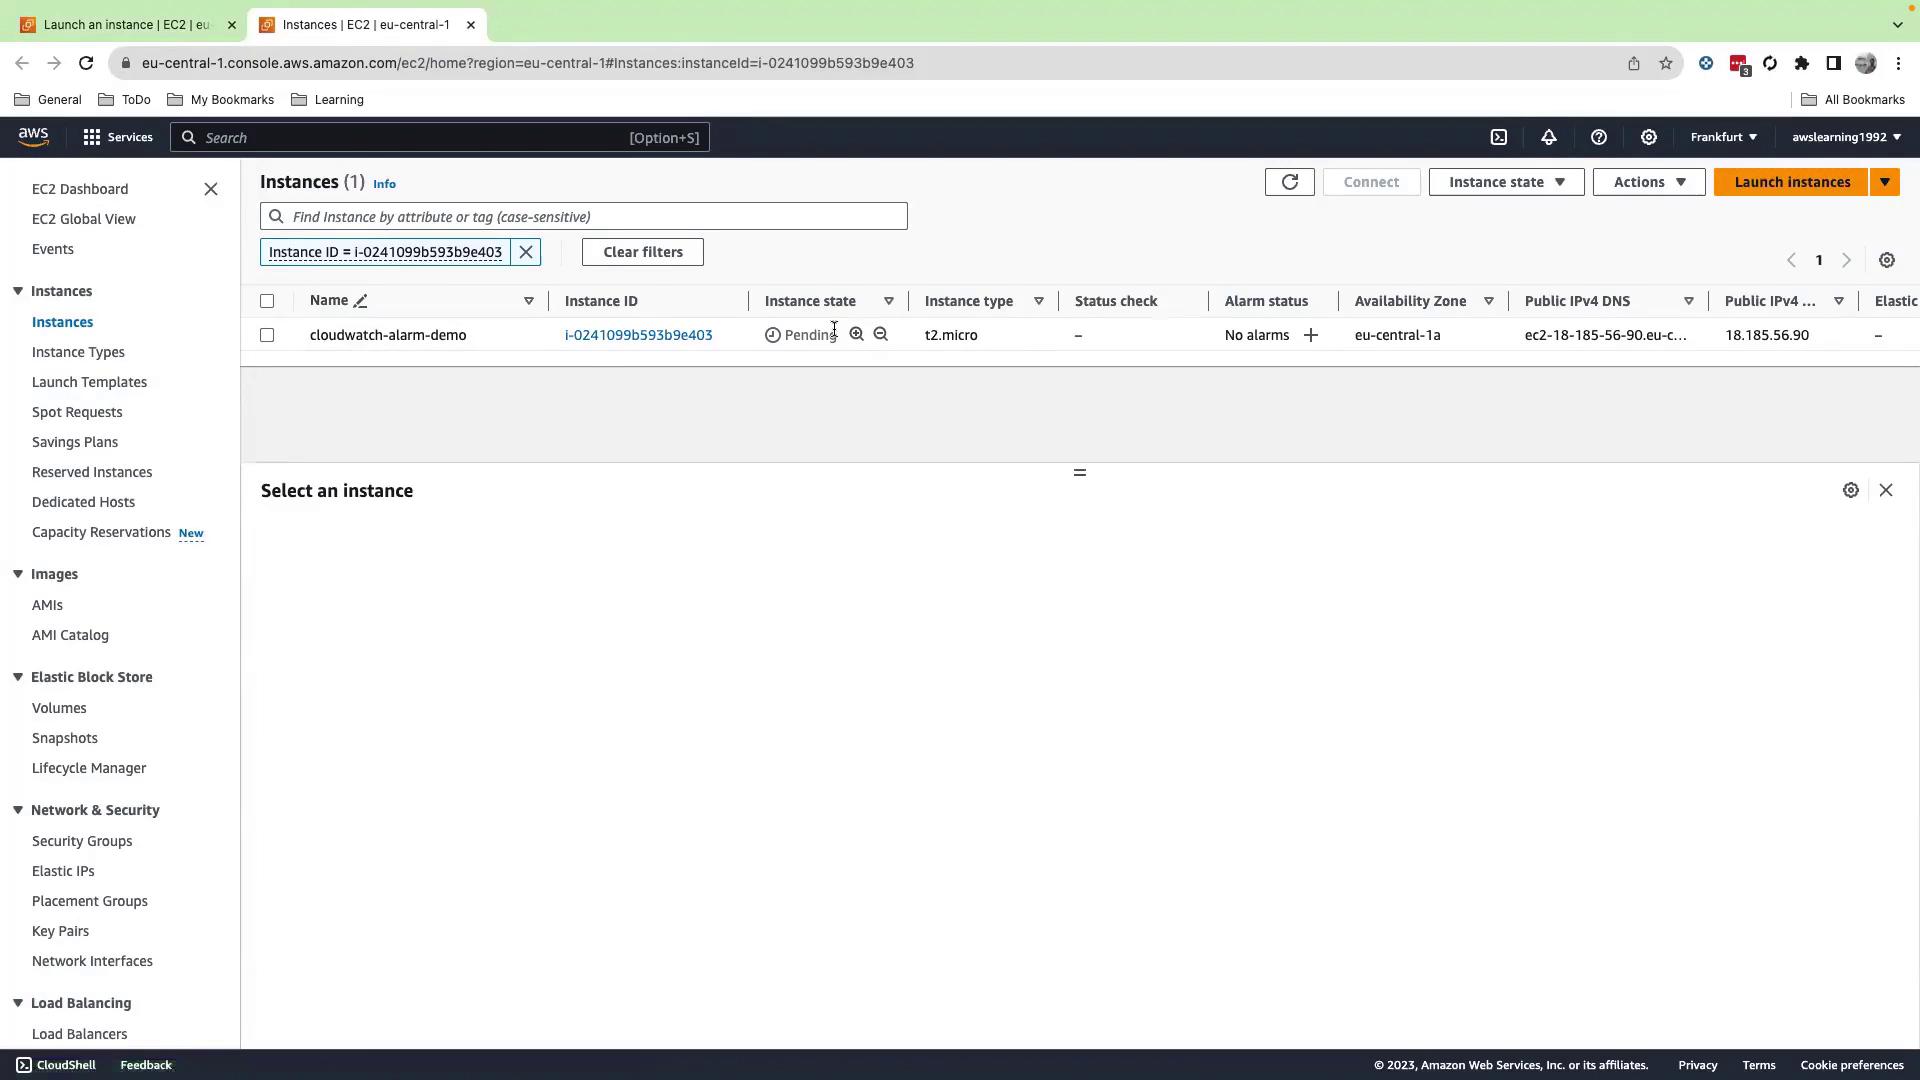
6. Click **Launch instances**, then view your instance on the Instances page. Wait until its status changes from **Pending** to **Running**.
<Frame>
  ![The image shows the AWS EC2 console interface for launching an instance, with options to configure the instance name, application and OS images, and other settings. The summary section on the right provides details about the selected configuration.](https://kodekloud.com/kk-media/image/upload/v1752862397/notes-assets/images/AWS-CloudWatch-Demo-Creating-and-Configuring-Alarms-with-alerting/aws-ec2-console-launch-instance-settings.jpg)
</Frame>

<Frame>
  ![The image shows an AWS EC2 instance launch configuration page, detailing options for key pair login, network settings, and instance summary. The "Launch instance" button is visible at the bottom.](https://kodekloud.com/kk-media/image/upload/v1752862398/notes-assets/images/AWS-CloudWatch-Demo-Creating-and-Configuring-Alarms-with-alerting/aws-ec2-instance-launch-configuration.jpg)
</Frame>

<Frame>
  ![The image shows an AWS EC2 dashboard with an instance listed as "pending" in the Frankfurt region. The instance type is t2.micro, and there are no alarms set.](https://kodekloud.com/kk-media/image/upload/v1752862400/notes-assets/images/AWS-CloudWatch-Demo-Creating-and-Configuring-Alarms-with-alerting/aws-ec2-dashboard-frankfurt-pending-instance.jpg)
</Frame>

## 2. Connect to the Instance

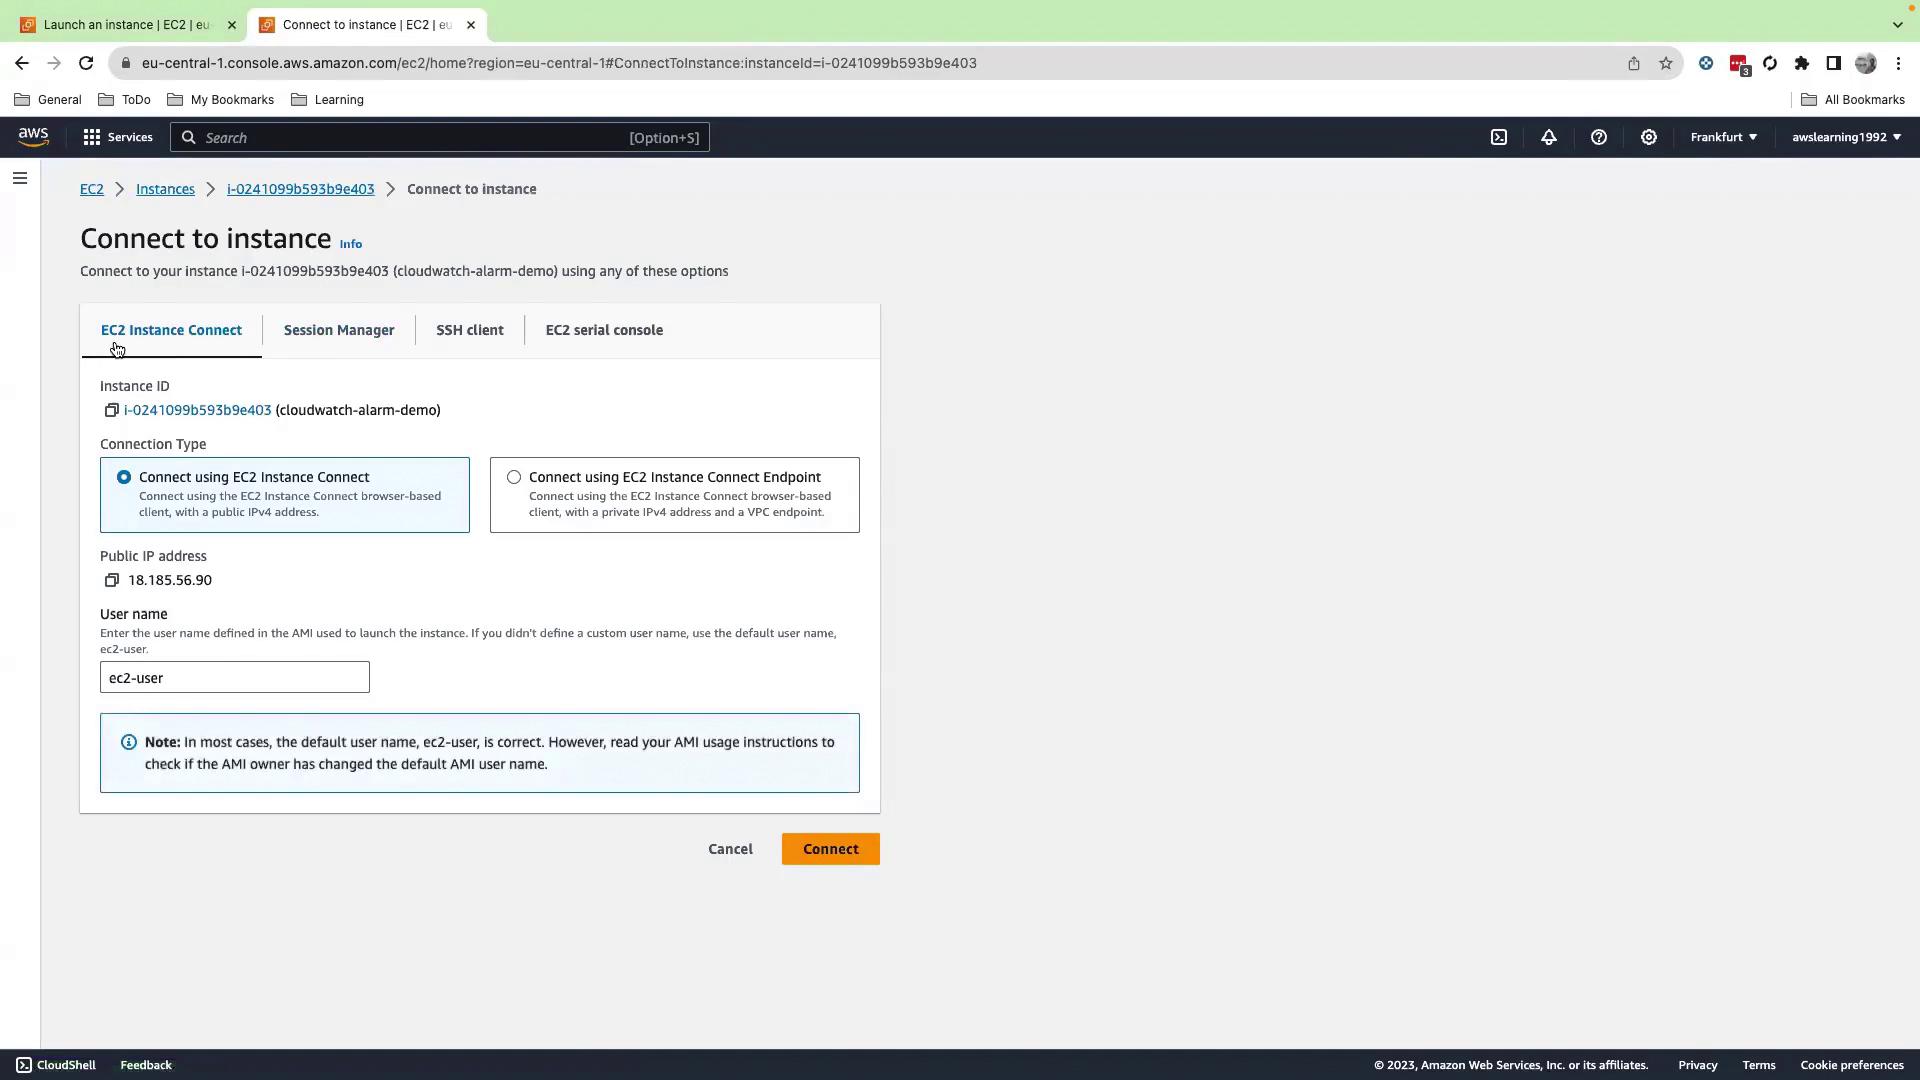
1. Select your running instance and click **Connect**.
2. Choose **EC2 Instance Connect** and then **Connect** again to open the browser-based shell.
3. Switch to root:

```bash theme={null}
[ec2-user@ip-172-31-16-22 ~]$ sudo su -
[root@ip-172-31-16-22 ~]#
```
<Frame>
  ![The image shows an AWS EC2 console interface for connecting to an instance, with options for EC2 Instance Connect, Session Manager, SSH client, and EC2 serial console. The instance ID and connection details are displayed.](https://kodekloud.com/kk-media/image/upload/v1752862401/notes-assets/images/AWS-CloudWatch-Demo-Creating-and-Configuring-Alarms-with-alerting/aws-ec2-console-instance-connection-options.jpg)
</Frame>

## 3. Install and Run the stress Utility

CloudWatch doesn’t collect detailed CPU or memory load by default. To simulate load:

```bash theme={null}
[root@ip-172-31-16-22 ~]# yum install stress -y
```

Once installed, launch `stress`:

```bash theme={null}
[root@ip-172-31-16-22 ~]# stress --cpu 4 --io 4 --vm-bytes 1G --hdd 2
stress: info: [25930] dispatching hogs: 4 cpu, 4 io, 1 vm, 2 hdd
```

Use `Ctrl+C` to stop the load.

### stress Command Options

| Flag       | Description           | Example         |
| ---------- | --------------------- | --------------- |
| --cpu      | Number of CPU workers | `--cpu 4`       |
| --io       | Number of I/O workers | `--io 4`        |
| --vm-bytes | Memory per VM worker  | `--vm-bytes 1G` |
| --hdd      | Number of HDD workers | `--hdd 2`       |

## 4. View Metrics in CloudWatch

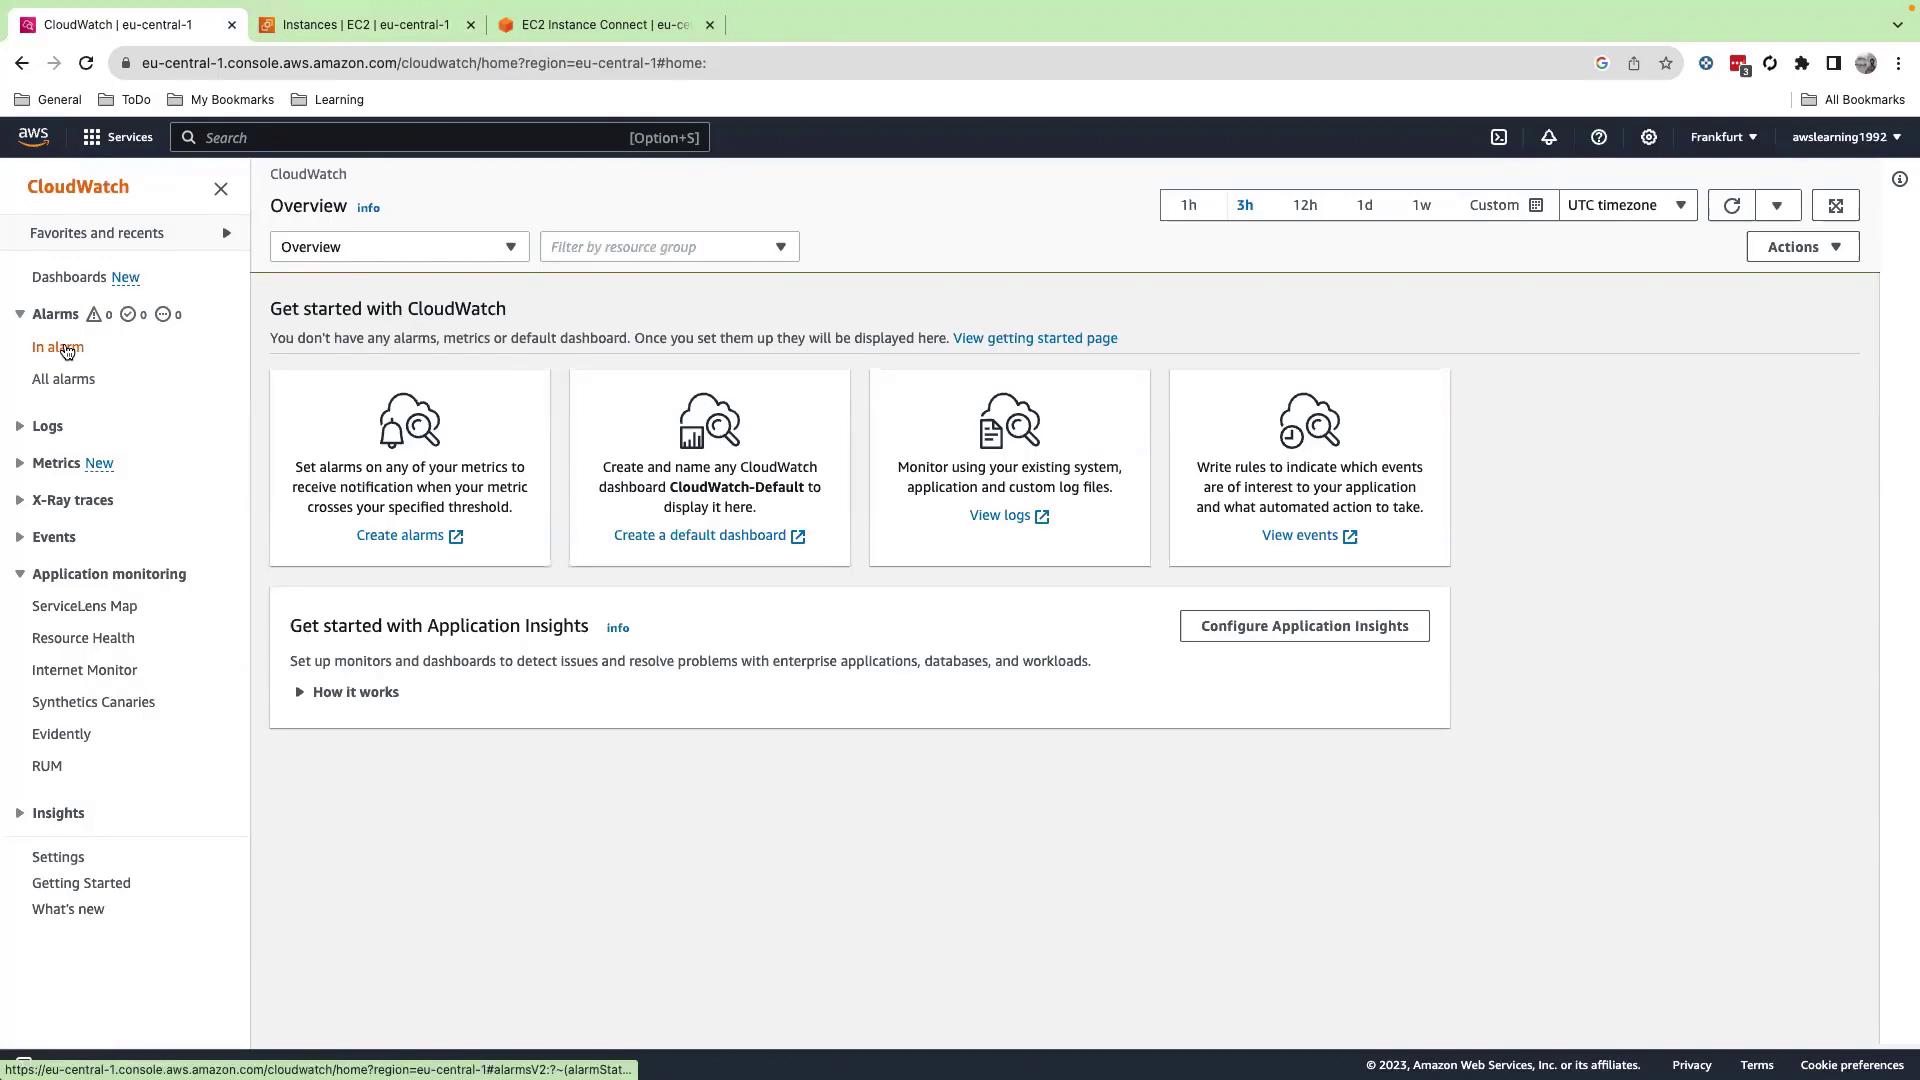
1. Open the **CloudWatch** console in a new tab.
2. Go to **Alarms → Create an alarm**.
<Frame>
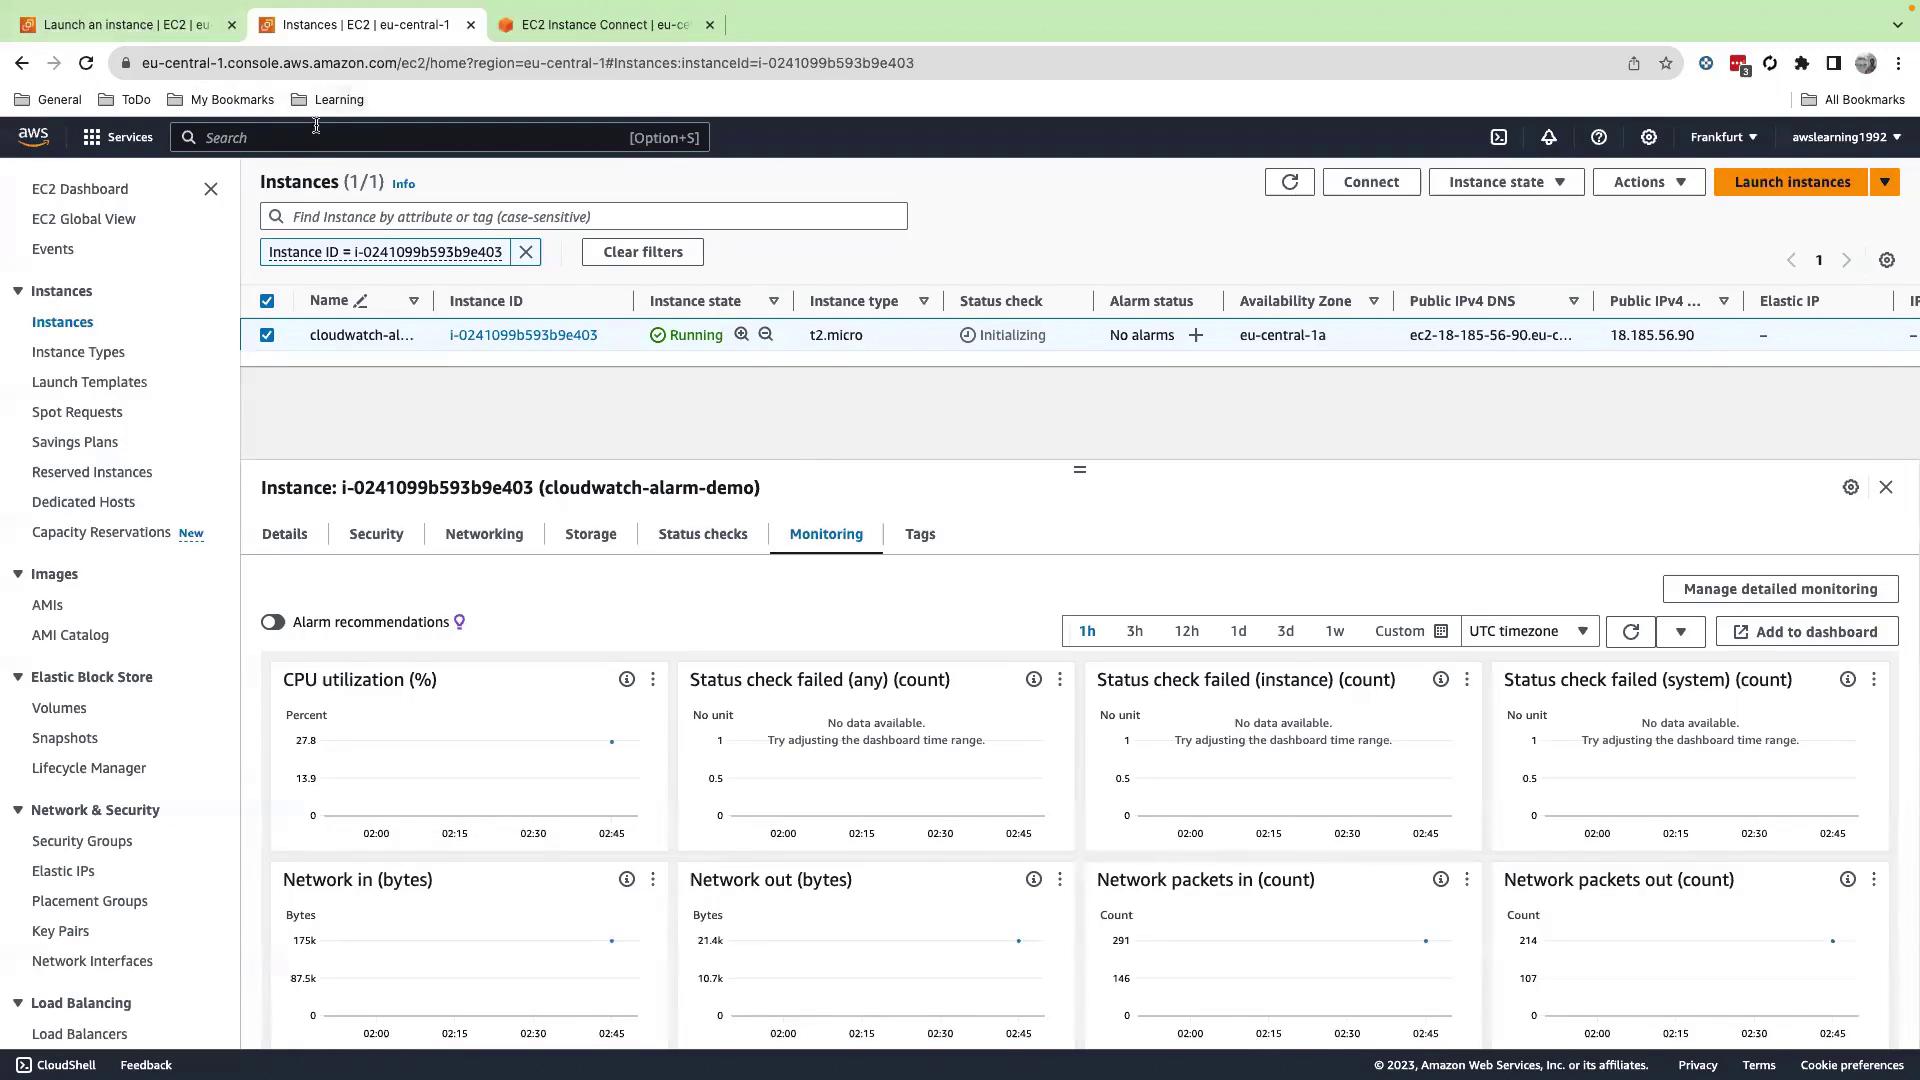
  ![The image shows an AWS EC2 management console with details of a running instance, including monitoring metrics like CPU utilization and network activity.](https://kodekloud.com/kk-media/image/upload/v1752862403/notes-assets/images/AWS-CloudWatch-Demo-Creating-and-Configuring-Alarms-with-alerting/aws-ec2-management-console-instance-metrics.jpg)
</Frame>

<Frame>
  ![The image shows the AWS CloudWatch dashboard, displaying options for setting alarms, creating dashboards, and monitoring logs and events. It includes navigation links on the left for various CloudWatch features.](https://kodekloud.com/kk-media/image/upload/v1752862406/notes-assets/images/AWS-CloudWatch-Demo-Creating-and-Configuring-Alarms-with-alerting/aws-cloudwatch-dashboard-alarms-logs.jpg)
</Frame>

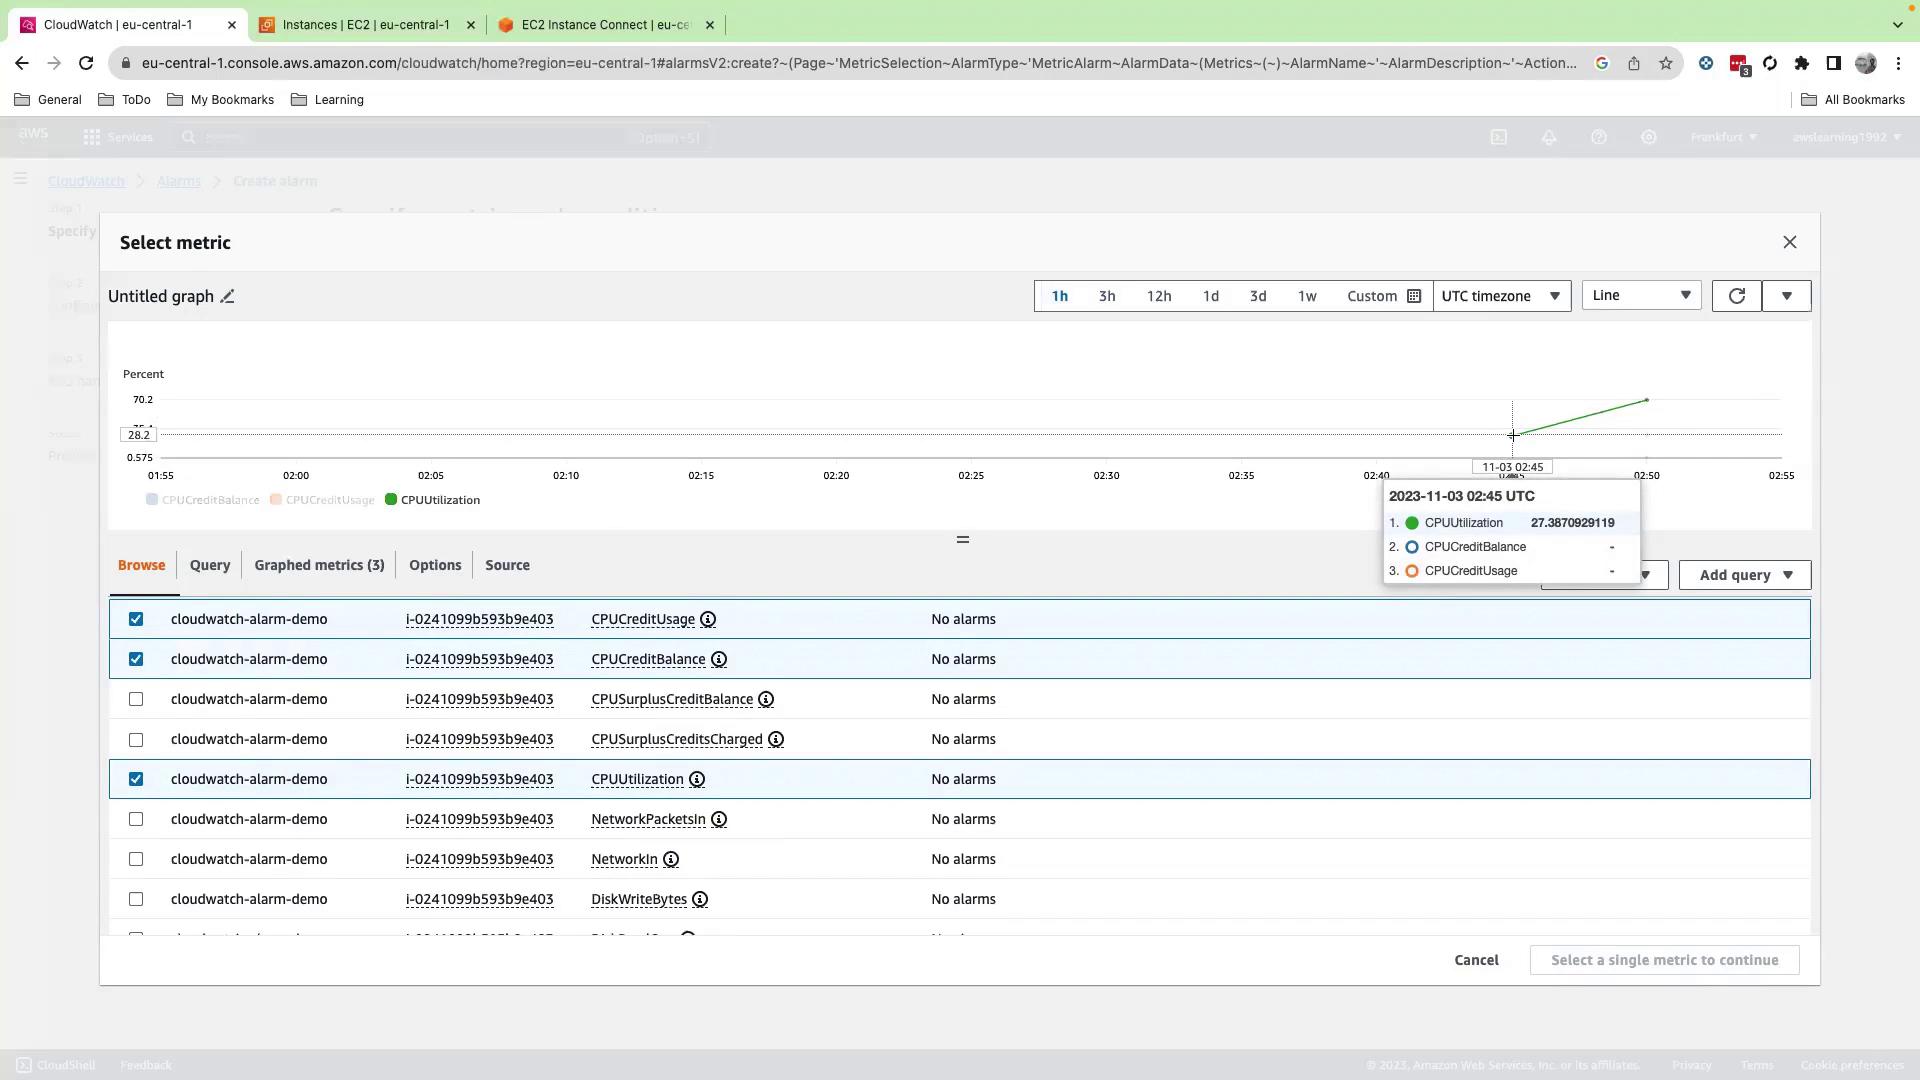
3. Click **Select metric**, navigate to **EC2 → Per-Instance Metrics**, and search your instance ID.
4. Initially select **CPU Credit Balance**, **CPU Credit Usage**, and **CPU Utilization**, then set the graph to a 1-hour view to spot spikes.
5. Because alarms support only one metric at a time, uncheck the credit metrics and keep **CPU Utilization** selected, then click **Select metric**.
<Frame>
  ![The image shows an AWS CloudWatch interface displaying a graph of CPU utilization metrics over time, with options to select and view different metrics related to CPU performance.](https://kodekloud.com/kk-media/image/upload/v1752862407/notes-assets/images/AWS-CloudWatch-Demo-Creating-and-Configuring-Alarms-with-alerting/aws-cloudwatch-cpu-utilization-graph.jpg)
</Frame>

## 5. Configure Alarm Conditions

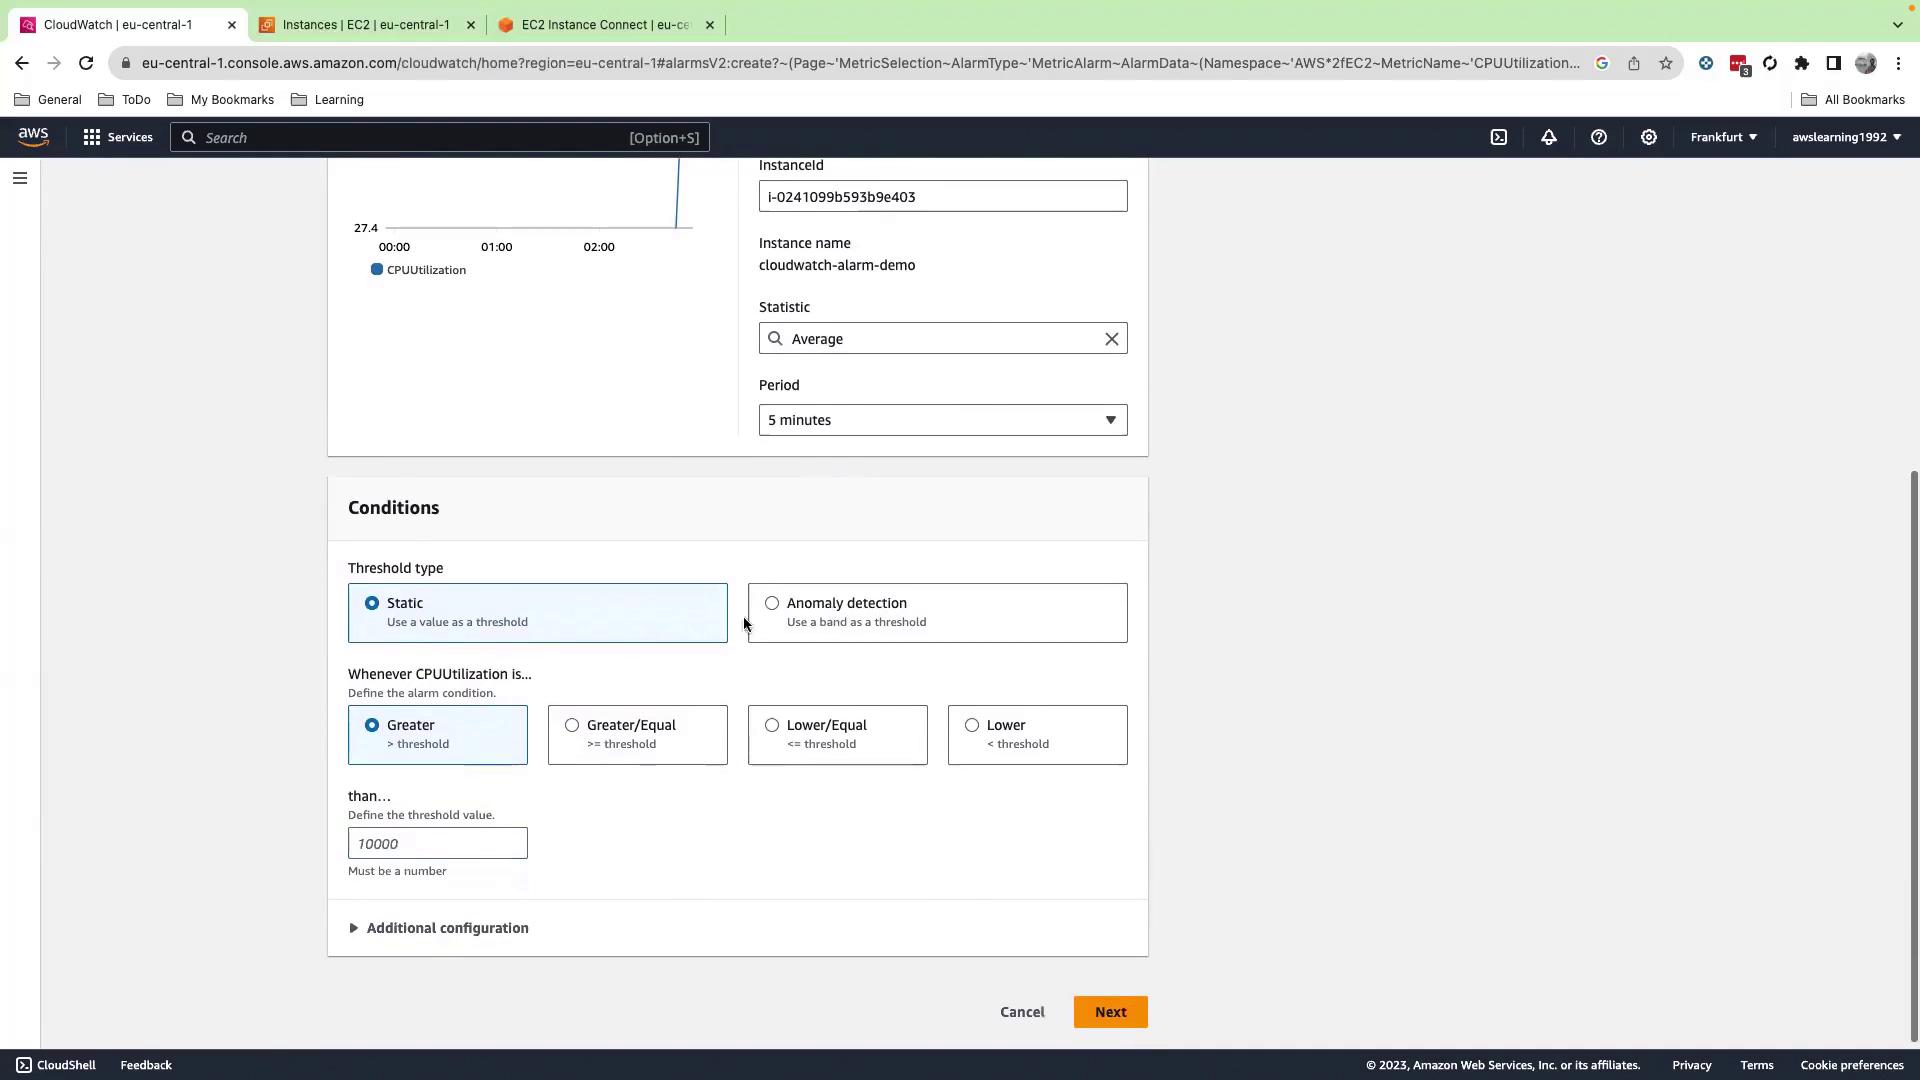
1. Under **Threshold type**, choose **Static**.
2. Set **Greater than or equal to 65** (%).
3. Click **Next**.

<Callout icon="lightbulb" color="#1CB2FE">
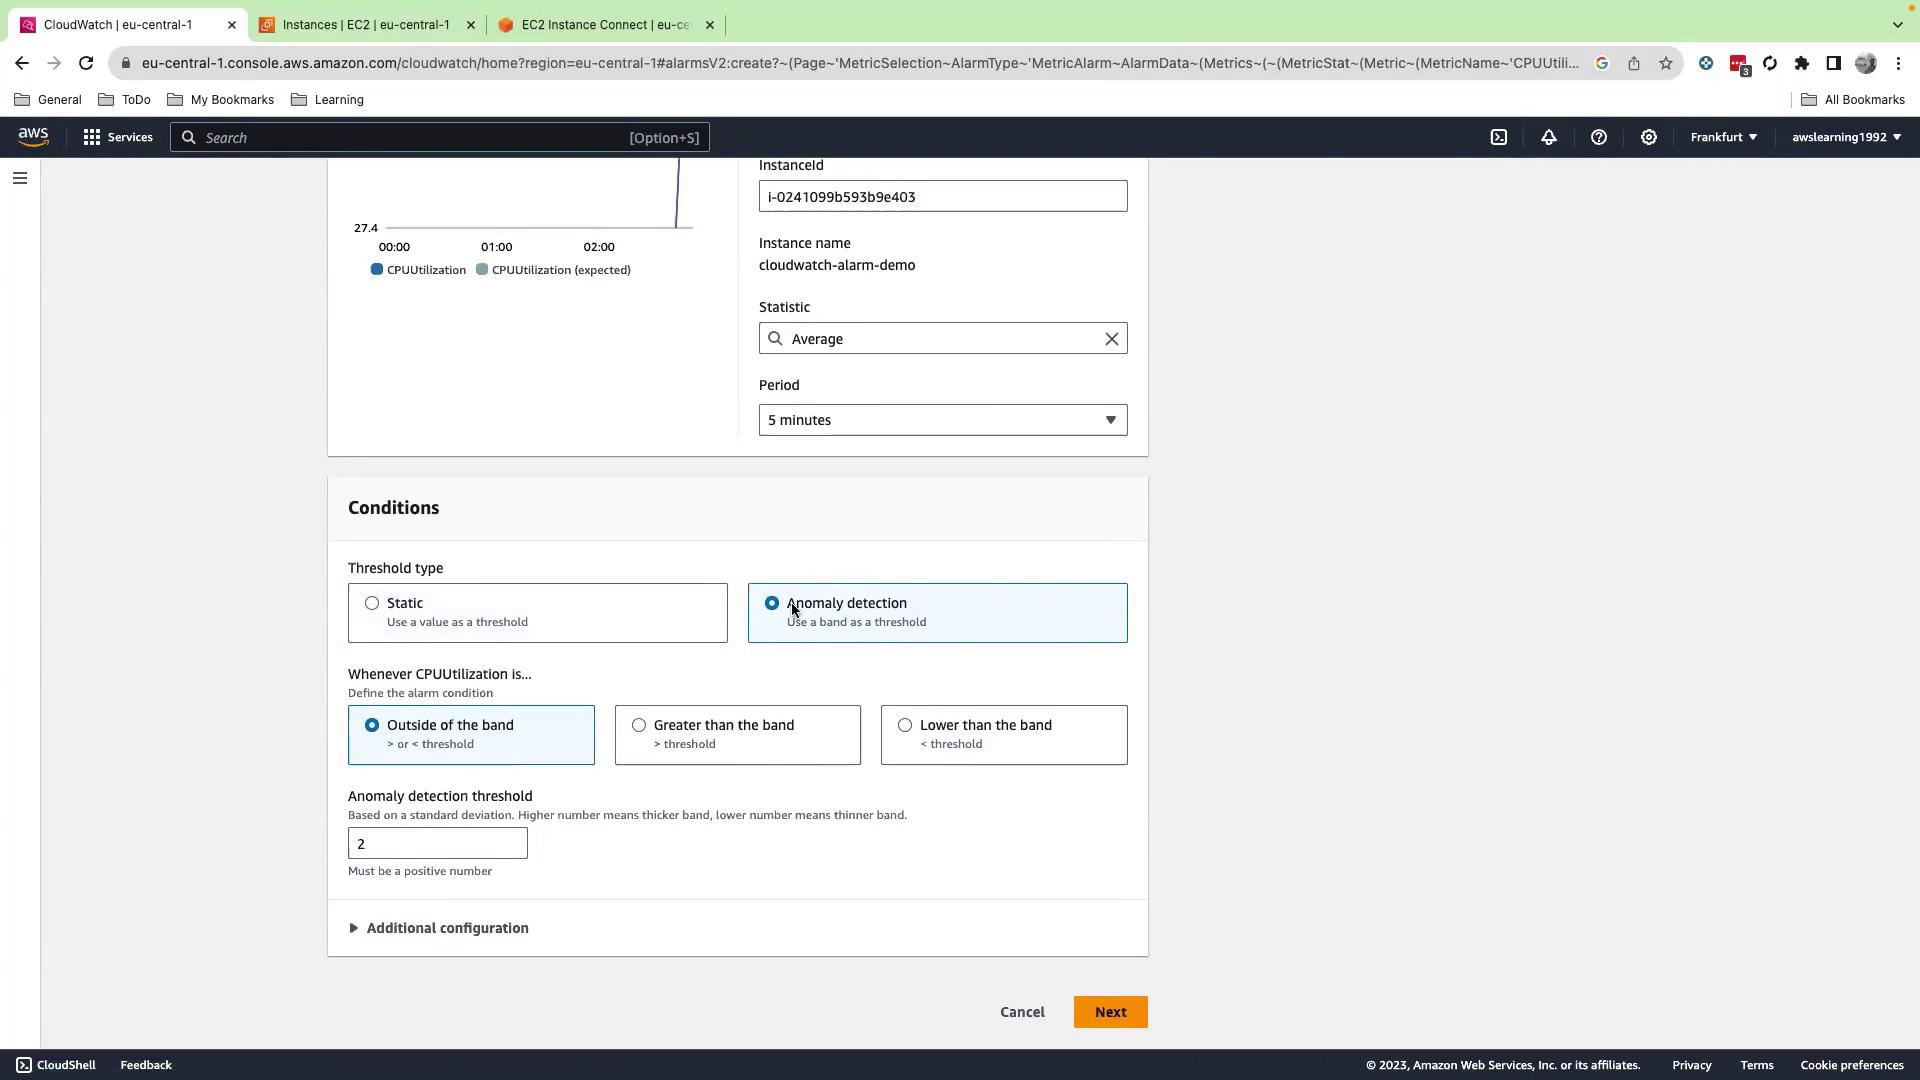
  You can also use **Anomaly detection** for adaptive thresholds that adjust based on historical data.
</Callout>

<Frame>
  ![The image shows an AWS CloudWatch interface for setting up an alarm condition based on CPU utilization. It includes options for threshold type, condition settings, and a graph displaying CPU usage data.](https://kodekloud.com/kk-media/image/upload/v1752862409/notes-assets/images/AWS-CloudWatch-Demo-Creating-and-Configuring-Alarms-with-alerting/aws-cloudwatch-alarm-cpu-utilization.jpg)
</Frame>

<Frame>
  ![The image shows an AWS CloudWatch interface for setting up an alarm with anomaly detection for CPU utilization. It includes options for threshold types and conditions for triggering the alarm.](https://kodekloud.com/kk-media/image/upload/v1752862410/notes-assets/images/AWS-CloudWatch-Demo-Creating-and-Configuring-Alarms-with-alerting/aws-cloudwatch-alarm-anomaly-detection.jpg)
</Frame>

## 6. Set Alarm Actions

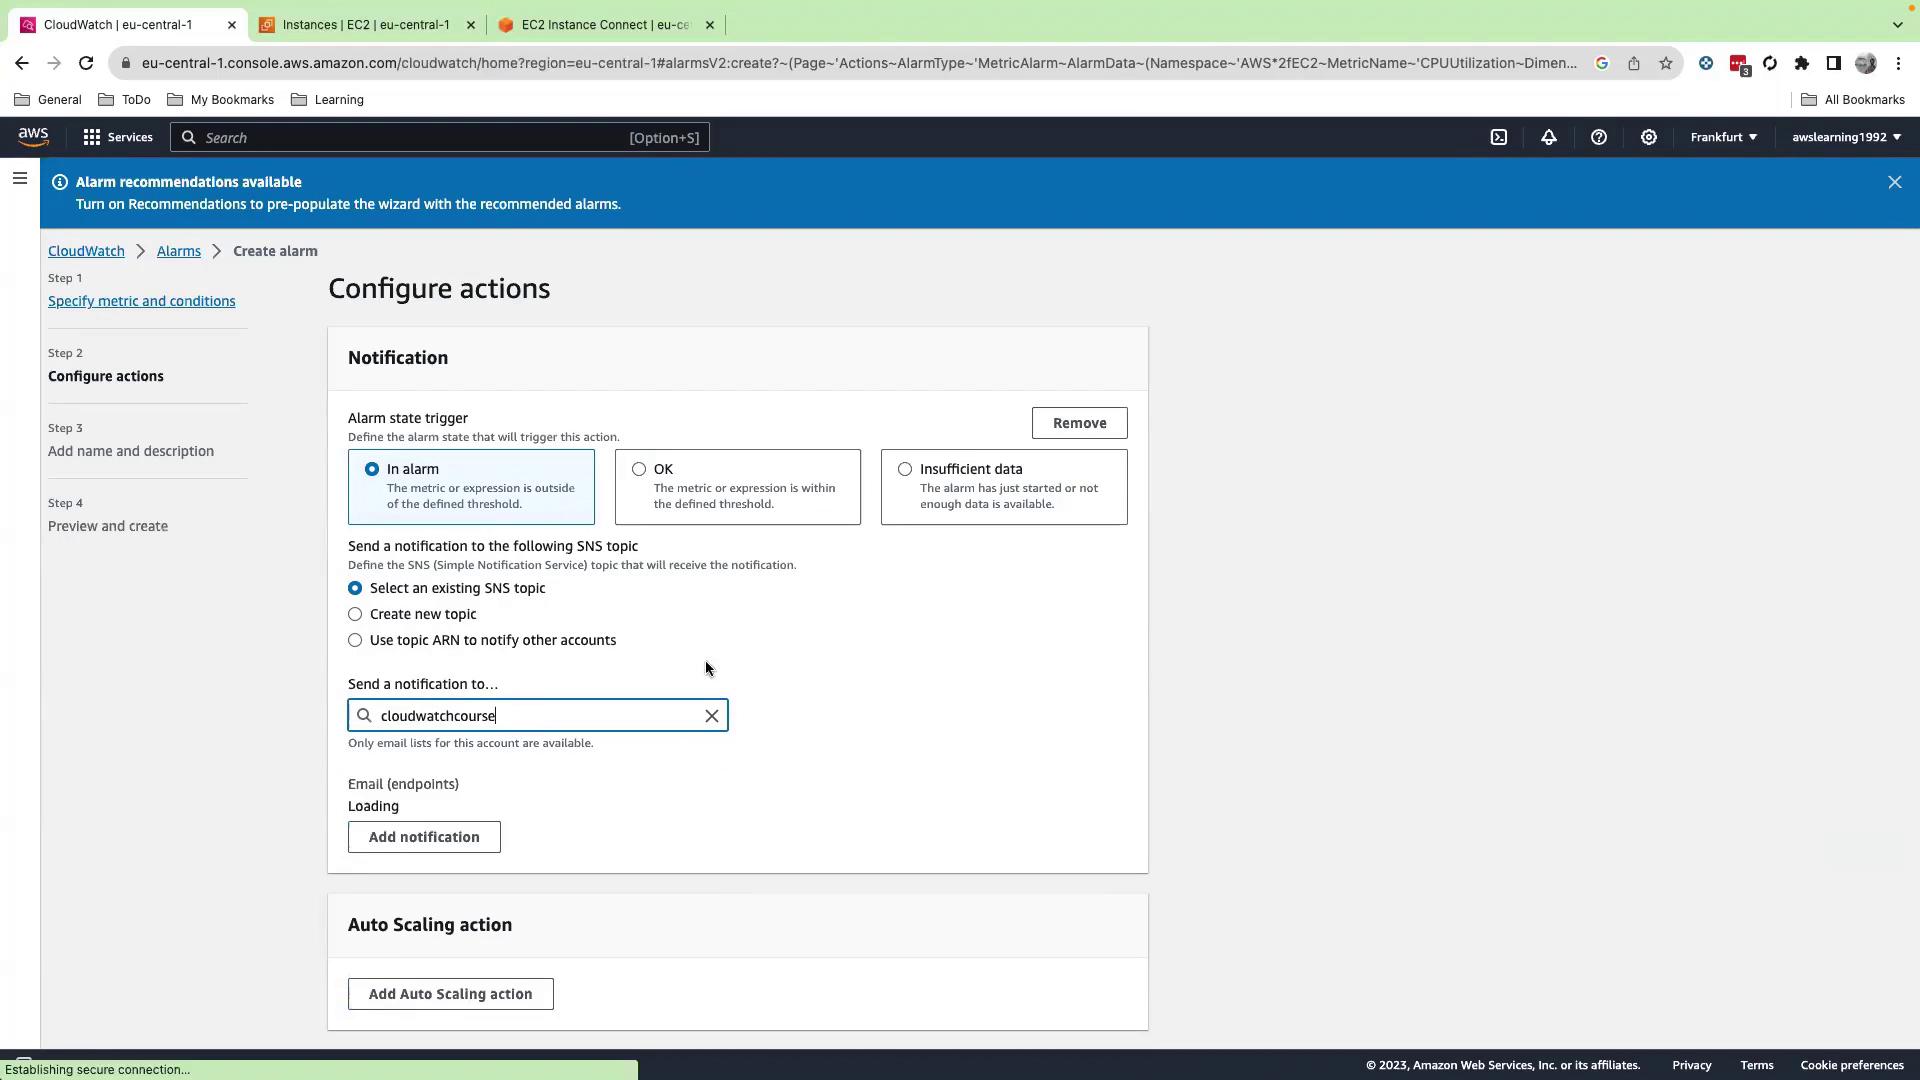
1. Under **Select an SNS topic**, choose an existing topic—e.g., `CloudWatch-course-topic`.
2. This topic delivers email alerts to its subscribers.
3. Click **Next**.
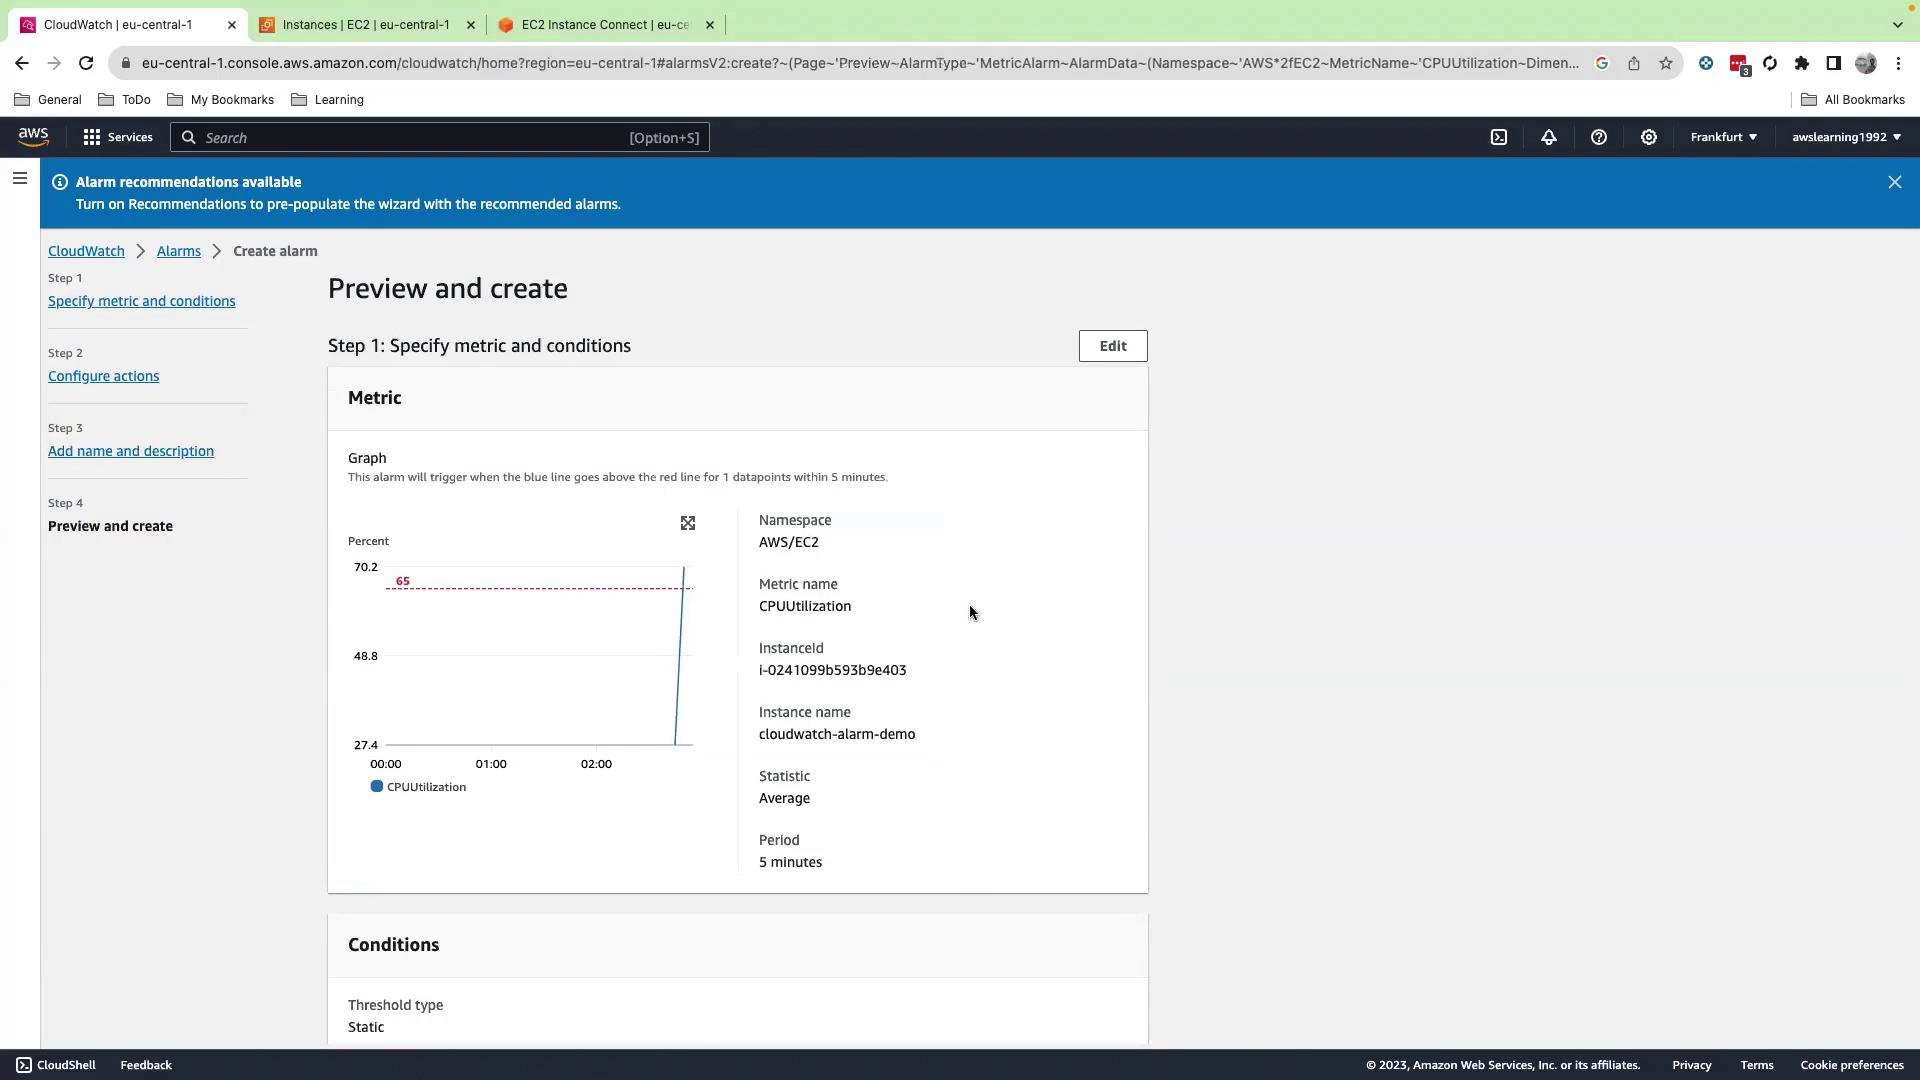
4. Provide an alarm name (e.g., `cpu-utilization-alarm`) and an optional message. Preview the email content.
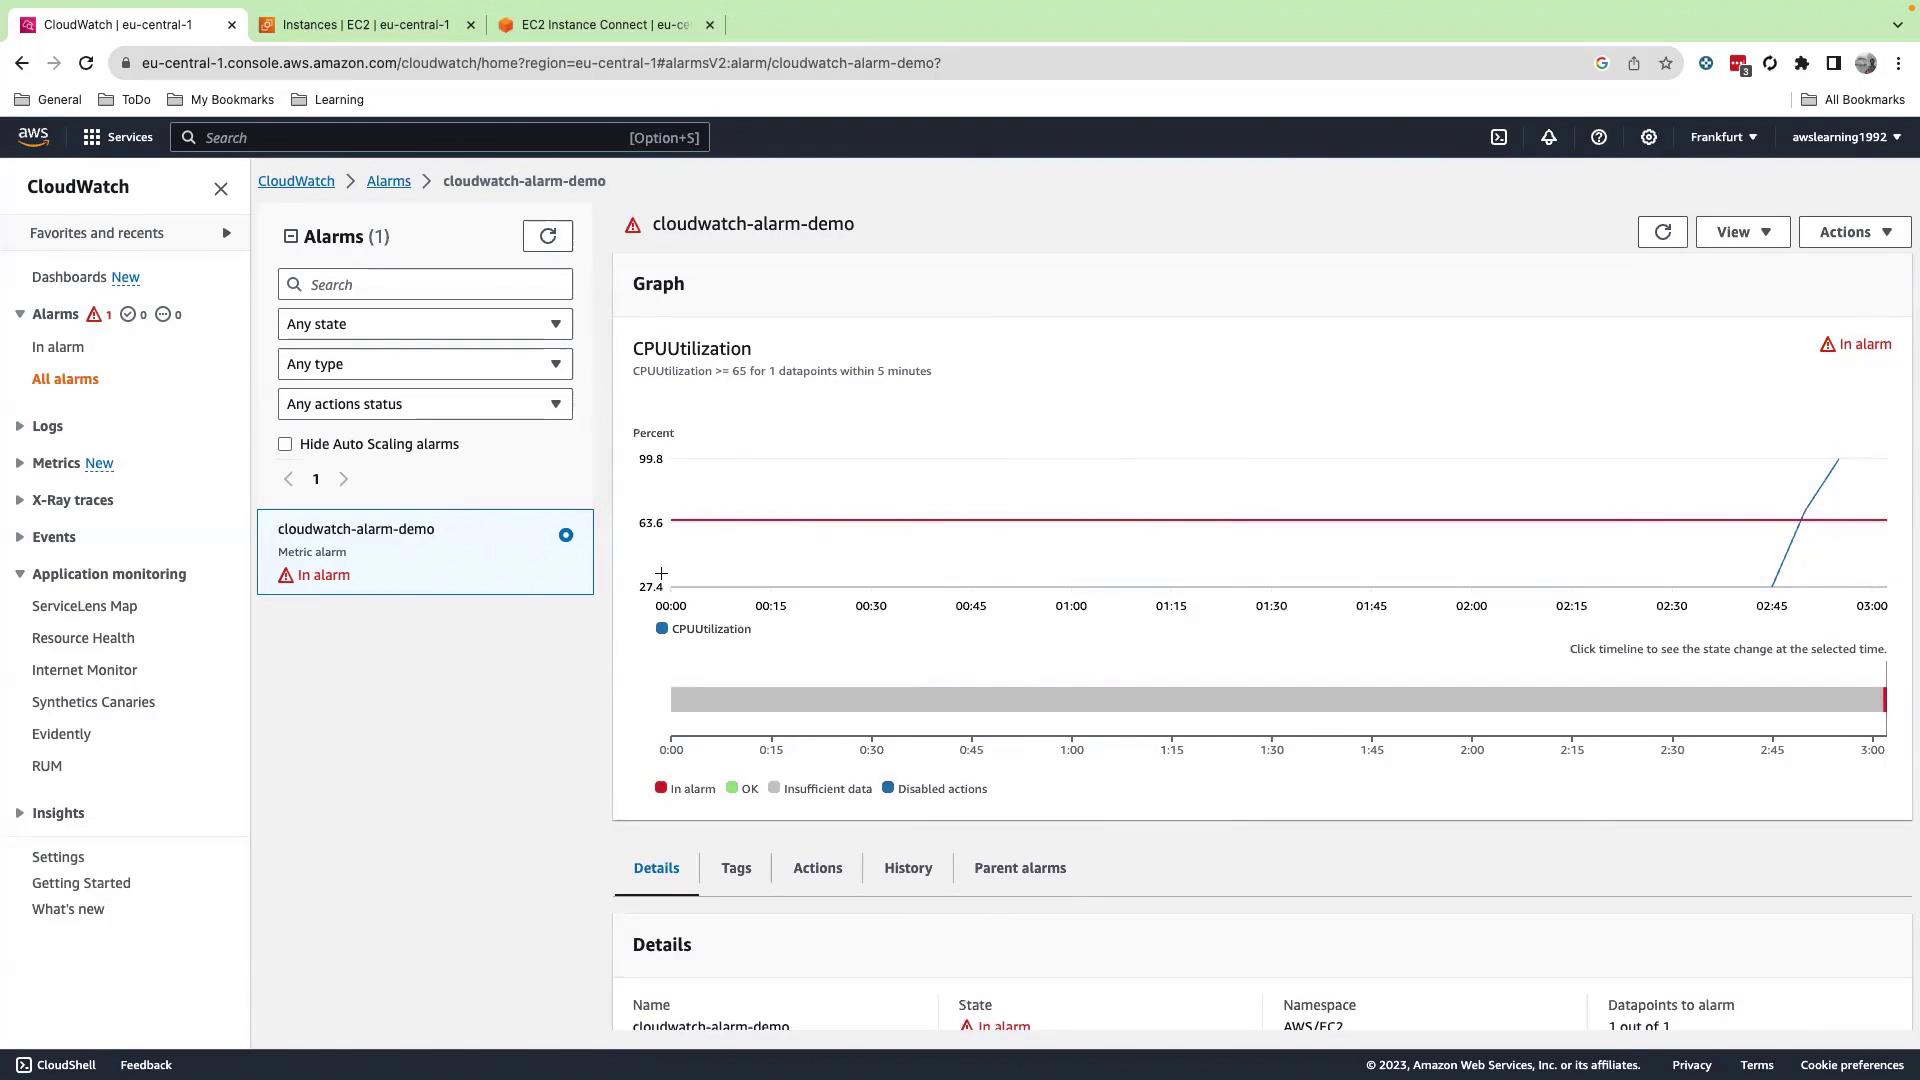
5. Click **Next**, then **Create alarm**. Initially, the alarm shows **Insufficient data**; once metrics arrive and CPU ≥ 65%, it shifts to **In alarm**.
<Frame>
  ![The image shows an AWS CloudWatch interface where a user is configuring actions for an alarm, including setting notifications via SNS topics.](https://kodekloud.com/kk-media/image/upload/v1752862411/notes-assets/images/AWS-CloudWatch-Demo-Creating-and-Configuring-Alarms-with-alerting/aws-cloudwatch-alarm-sns-configuration.jpg)
</Frame>

<Frame>
  ![The image shows an AWS CloudWatch interface for creating an alarm, displaying a graph of CPU utilization with specified metric conditions. The alarm is set to trigger when the CPU utilization exceeds a certain threshold.](https://kodekloud.com/kk-media/image/upload/v1752862412/notes-assets/images/AWS-CloudWatch-Demo-Creating-and-Configuring-Alarms-with-alerting/aws-cloudwatch-alarm-cpu-utilization-2.jpg)
</Frame>

<Frame>
  ![The image shows an AWS CloudWatch dashboard with an alarm named "cloudwatch-alarm-demo" in an "In alarm" state, indicating high CPU utilization. The graph displays CPU utilization over time, exceeding the threshold.](https://kodekloud.com/kk-media/image/upload/v1752862414/notes-assets/images/AWS-CloudWatch-Demo-Creating-and-Configuring-Alarms-with-alerting/aws-cloudwatch-alarm-high-cpu-utilization.jpg)
</Frame>

## 7. Verify Notifications

Check your email inbox for an alert:
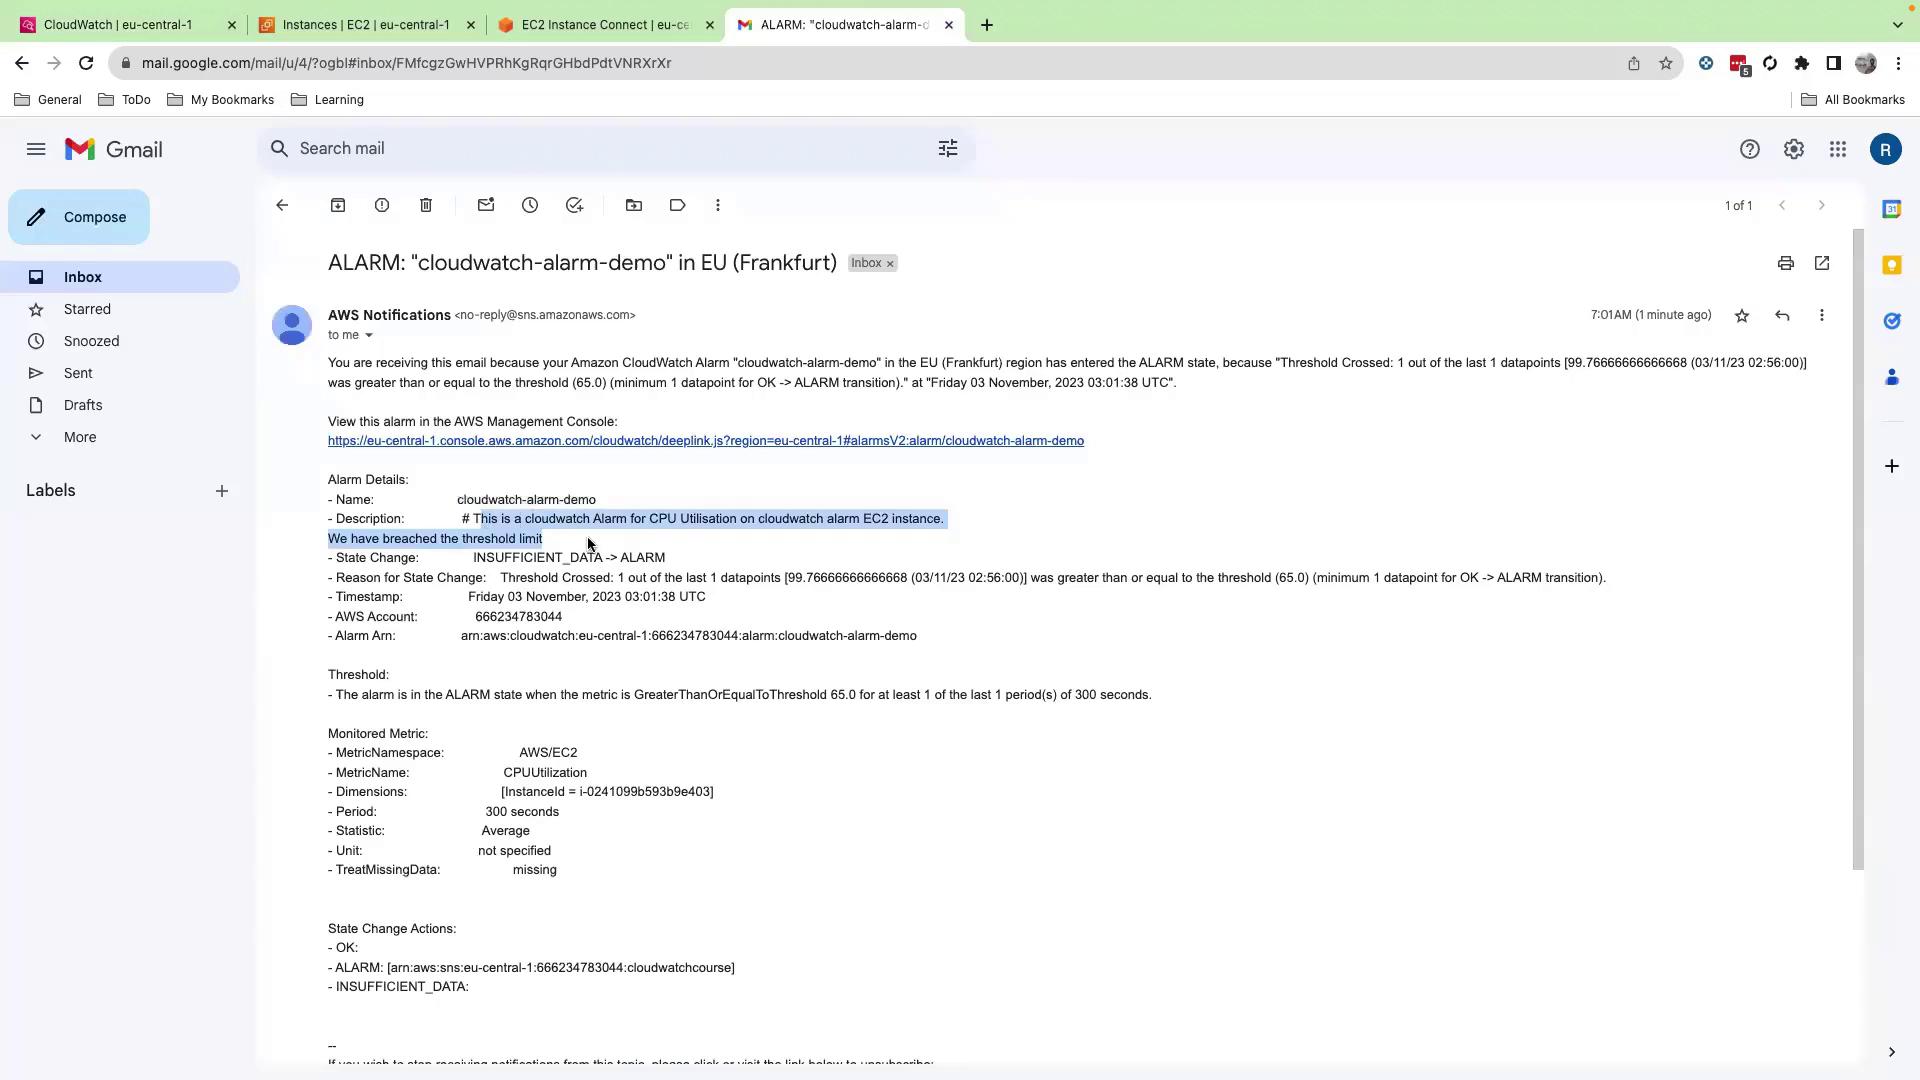
<Frame>
  ![The image shows an email notification from AWS CloudWatch indicating that a CPU utilization alarm for an EC2 instance in Frankfurt has been triggered due to a threshold breach.](https://kodekloud.com/kk-media/image/upload/v1752862415/notes-assets/images/AWS-CloudWatch-Demo-Creating-and-Configuring-Alarms-with-alerting/aws-cloudwatch-ec2-cpu-alarm-notification.jpg)
</Frame>

Email contents include:

* Alarm name
* Instance details
* Custom message
* CloudWatch console link
* Triggering metric graph

## 8. Resolve the Alarm

1. On the EC2 instance, stop `stress` with `Ctrl+C`.
2. After CPU drops below 65%, the alarm transitions to **OK**.

Note that CloudWatch doesn’t notify on resolution by default. To get recovery alerts, edit the alarm’s actions or create a second alarm for the OK state.

## Summary

You’ve successfully:

* Launched and connected to an EC2 instance
* Installed and ran `stress` to generate CPU load
* Navigated CloudWatch and created a CPU utilization alarm
* Configured SNS notifications and verified delivery
* Resolved and monitored alarm recovery

## References

* [Amazon EC2 Documentation](https://docs.aws.amazon.com/ec2/)
* [Amazon CloudWatch User Guide](https://docs.aws.amazon.com/cloudwatch/)
* [stress on GitHub](https://github.com/stress-ng/stress-ng)

<CardGroup>
  <Card title="Watch Video" icon="video" cta="Learn more" href="https://learn.kodekloud.com/user/courses/aws-cloudwatch/module/41c3204a-bf91-4e6f-8175-02ef9b9f6b82/lesson/e80bb83f-5e3d-450e-bbb5-6ac05169c312" />

  <Card title="Practice Lab" icon="installation" cta="Learn more" href="https://learn.kodekloud.com/user/courses/aws-cloudwatch/module/41c3204a-bf91-4e6f-8175-02ef9b9f6b82/lesson/ba851a83-2eb5-489f-bc8f-fecd34dd37b9" />
</CardGroup>