> ## Documentation Index
> Fetch the complete documentation index at: https://notes.kodekloud.com/llms.txt
> Use this file to discover all available pages before exploring further.
# Metric Granularity and Aggregation
> This guide explains AWS CloudWatch metric granularity and aggregation for effective monitoring, alerting, and capacity planning.
In this guide, we’ll dive into how AWS CloudWatch captures and processes metrics from services like Amazon RDS. You’ll learn how metric granularity influences data resolution and how aggregation turns raw data into actionable insights for monitoring, alerting, and capacity planning.
## Table of Contents
* [Metric Granularity](#metric-granularity)
* [Metric Aggregation](#metric-aggregation)
* [Best Practices](#best-practices)
* [Links and References](#links-and-references)
## Metric Granularity
Metric granularity determines how often CloudWatch collects and stores data points—similar to adjusting a camera’s resolution. Fine-grained data offers deeper insights into system behavior.
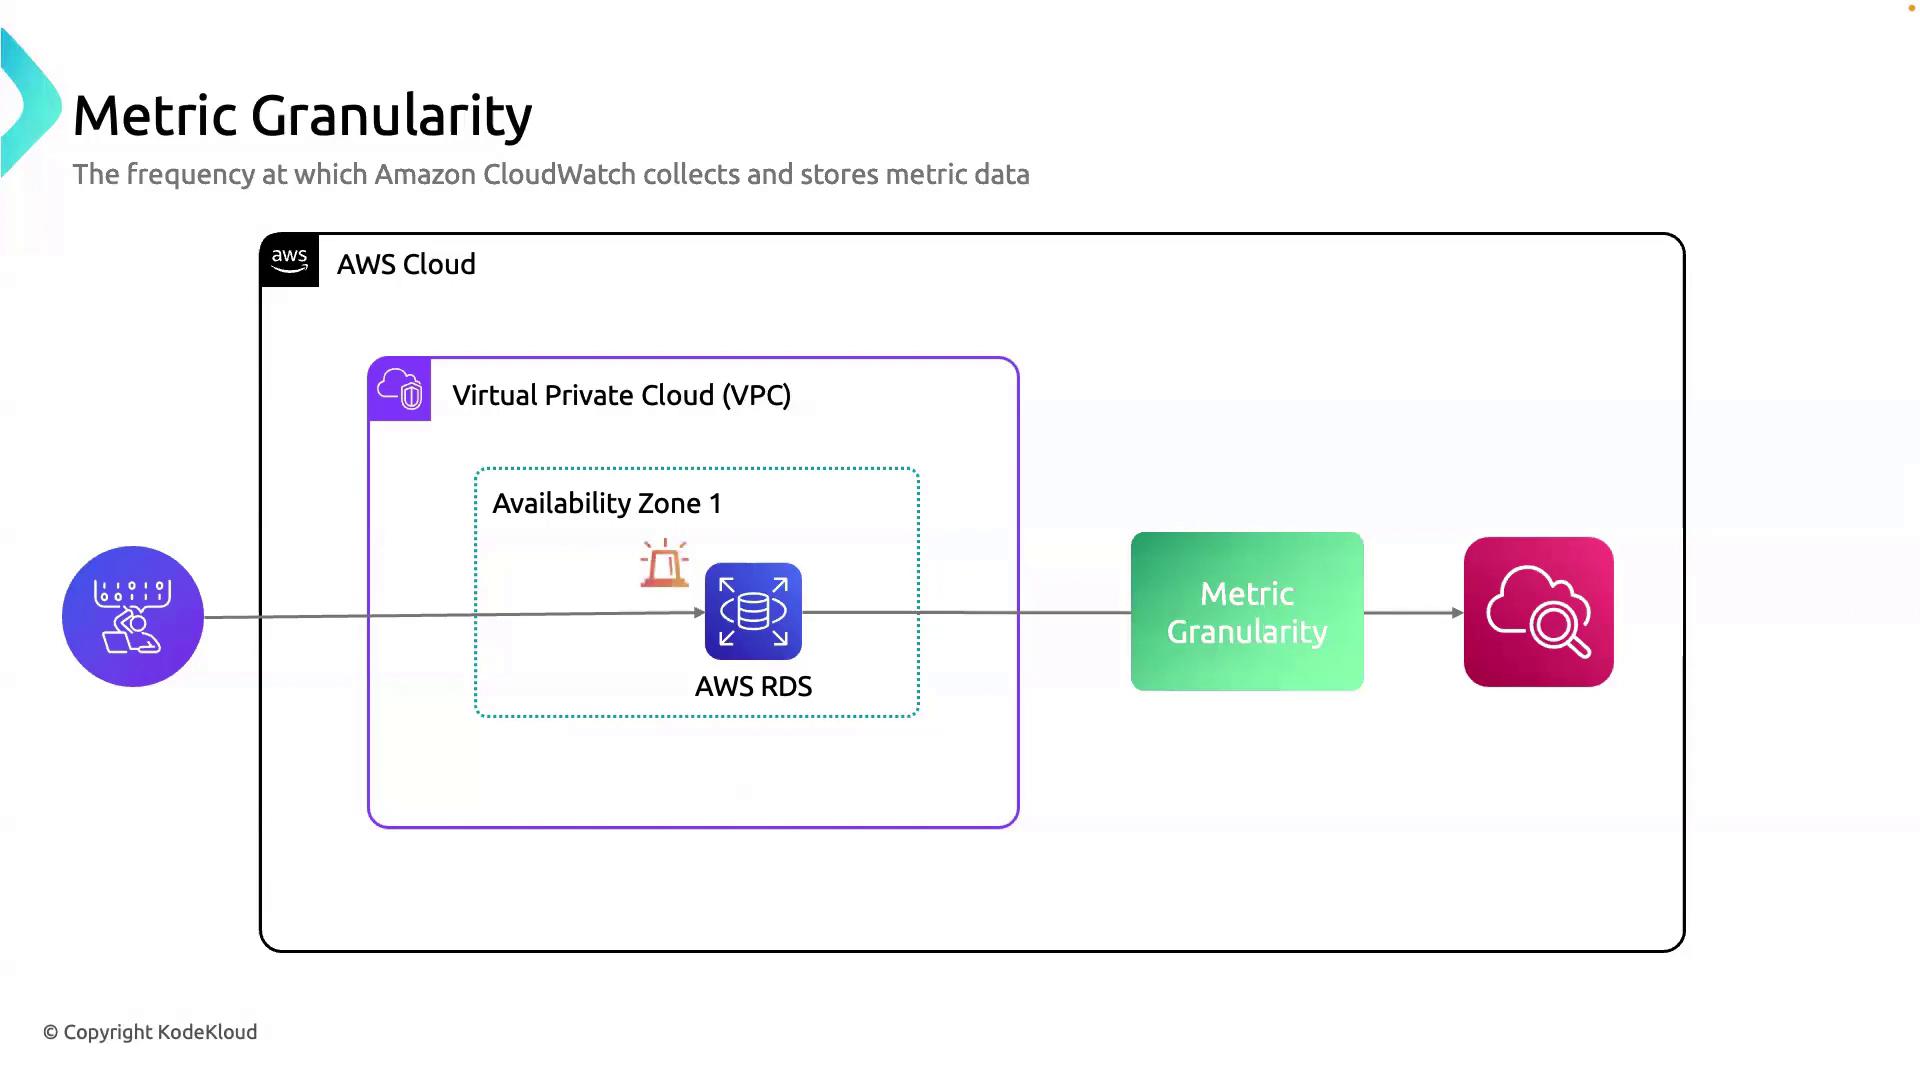
By default, most AWS services emit metrics at **1-minute** intervals. However, Amazon RDS basic monitoring only reports every **5 minutes** unless you enable detailed monitoring for 1-minute resolution.
| Service | Default Granularity | Detailed Monitoring | Typical Use Case |
| ---------- | ------------------- | ------------------- | ----------------------------------------- |
| Amazon RDS | 5 minutes | 1 minute | Deep database performance troubleshooting |
| Amazon EC2 | 5 minutes | 1 minute | High-frequency CPU/memory analysis |
| ELB / ALB | 1 minute | ‑ | Real-time traffic and latency metrics |
For mission-critical workloads, enabling detailed monitoring provides the visibility needed to detect spikes and performance bottlenecks.
### Why Granularity Matters
* **Responsive Alarms**: Trigger alerts at precise thresholds.
* **Detailed Dashboards**: Visualize fine spikes in CPU, memory, or I/O.
* **Performance Tuning**: Correlate rapid metric changes with application events.
## Metric Aggregation
Aggregation in CloudWatch summarizes multiple data points into a single metric value by applying statistical functions. This process helps identify trends and anomalies over time.
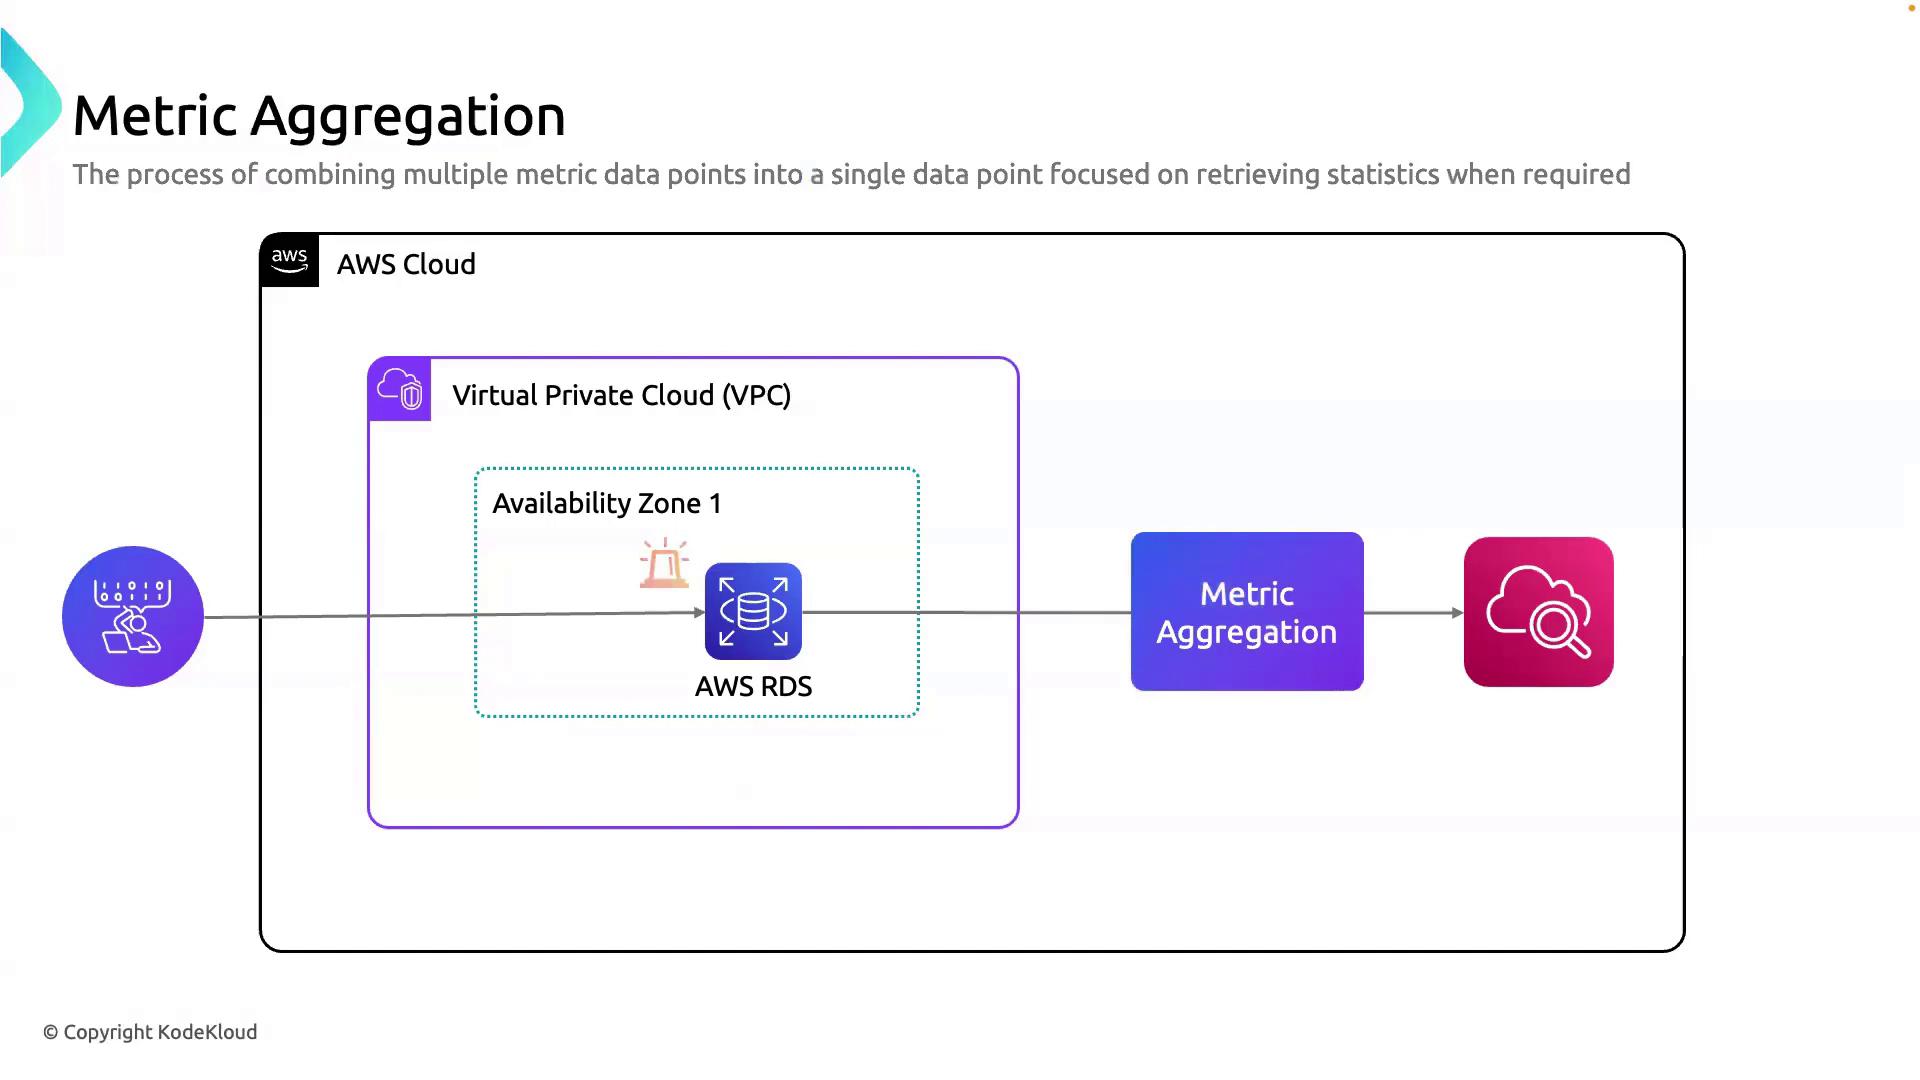
Common aggregation functions:
| Statistic | Description |
| --------- | -------------------------------------- |
| Average | Mean value of all points in the period |
| Sum | Total of all values |
| Minimum | Lowest data point |
| Maximum | Highest data point |
### Use Cases for Aggregation
* **Retrospective Analysis**: Understand resource usage over days or weeks.
* **Predictive Scaling**: Forecast demand to automate scaling policies.
* **Smart Alarms**: Set thresholds on aggregated values (e.g., 5-minute average CPU).
Aggregation over coarse time intervals can mask short-lived spikes. Always align your aggregation period with your alerting requirements.
## Best Practices
* Enable **1-minute granularity** for critical services (RDS, EC2).
* Choose appropriate aggregation periods to balance data volume and insight.
* Leverage **Composite Alarms** to combine multiple aggregated metrics.
* Use **Metric Math** for custom calculations and anomaly detection.
## Links and References
* [Amazon CloudWatch Concepts](https://docs.aws.amazon.com/AmazonCloudWatch/latest/monitoring/WhatIsCloudWatch.html)
* [AWS RDS Monitoring](https://docs.aws.amazon.com/AmazonRDS/latest/UserGuide/MonitoringOverview.html)
* [CloudWatch Metric Math](https://docs.aws.amazon.com/AmazonCloudWatch/latest/monitoring/using-metric-math.html)
* [AWS Pricing Calculator](https://calculator.aws/#/)
Build a robust monitoring strategy by combining the right granularity with effective aggregation—ensuring you never miss critical performance signals.