> ## Documentation Index
> Fetch the complete documentation index at: https://notes.kodekloud.com/llms.txt
> Use this file to discover all available pages before exploring further.
# Demo Cloudwatch agent to setup SSH connection failure alert dashboard for EC2 instance
> This guide explains how to configure AWS CloudWatch Agent on EC2 for monitoring SSH connection failures.
In this guide, you’ll learn how to install and configure the AWS CloudWatch Agent on an EC2 instance to collect SSH login and audit logs, stream them to CloudWatch Logs, and verify them in the console. Once streaming is in place, you can create metric filters, alarms, and dashboards to monitor SSH connection failures and other security events.
## Table of Contents
1. [Prerequisites](#prerequisites)
2. [Update IAM Role](#update-iam-role)
3. [Launch an EC2 Instance](#launch-an-ec2-instance)
4. [Verify Instance Status](#verify-instance-status)
5. [Inspect Audit Logs on EC2](#inspect-audit-logs-on-ec2)
6. [Install the CloudWatch Agent](#install-the-cloudwatch-agent)
7. [Configure Log Collection](#configure-log-collection)
8. [Create the CloudWatch Log Group](#create-the-cloudwatch-log-group)
9. [Start and Validate the CloudWatch Agent](#start-and-validate-the-cloudwatch-agent)
10. [View Logs in CloudWatch](#view-logs-in-cloudwatch)
11. [Next Steps](#next-steps)
12. [References](#references)
## Prerequisites
* An existing IAM role (e.g., `metrics-filter`) with console access.
* An AWS account with permissions to manage EC2, IAM, and CloudWatch.
* A security group that allows SSH (port 22).
***
## 1. Update IAM Role
Attach the **CloudWatchAgentServerPolicy** to your IAM role to grant permission for log streaming and metrics.
| IAM Role | Attached Policies |
| -------------- | --------------------------------------------------------------------- |
| metrics-filter | - cloudwatch\_logs\_ec2\_iam\_role
- CloudWatchAgentServerPolicy |
Steps:
1. Open the IAM console and choose **Roles**.
2. Select `metrics-filter`, then **Add permissions → Attach policies**.
3. Search for and attach **CloudWatchAgentServerPolicy**.

***
## 2. Launch an EC2 Instance
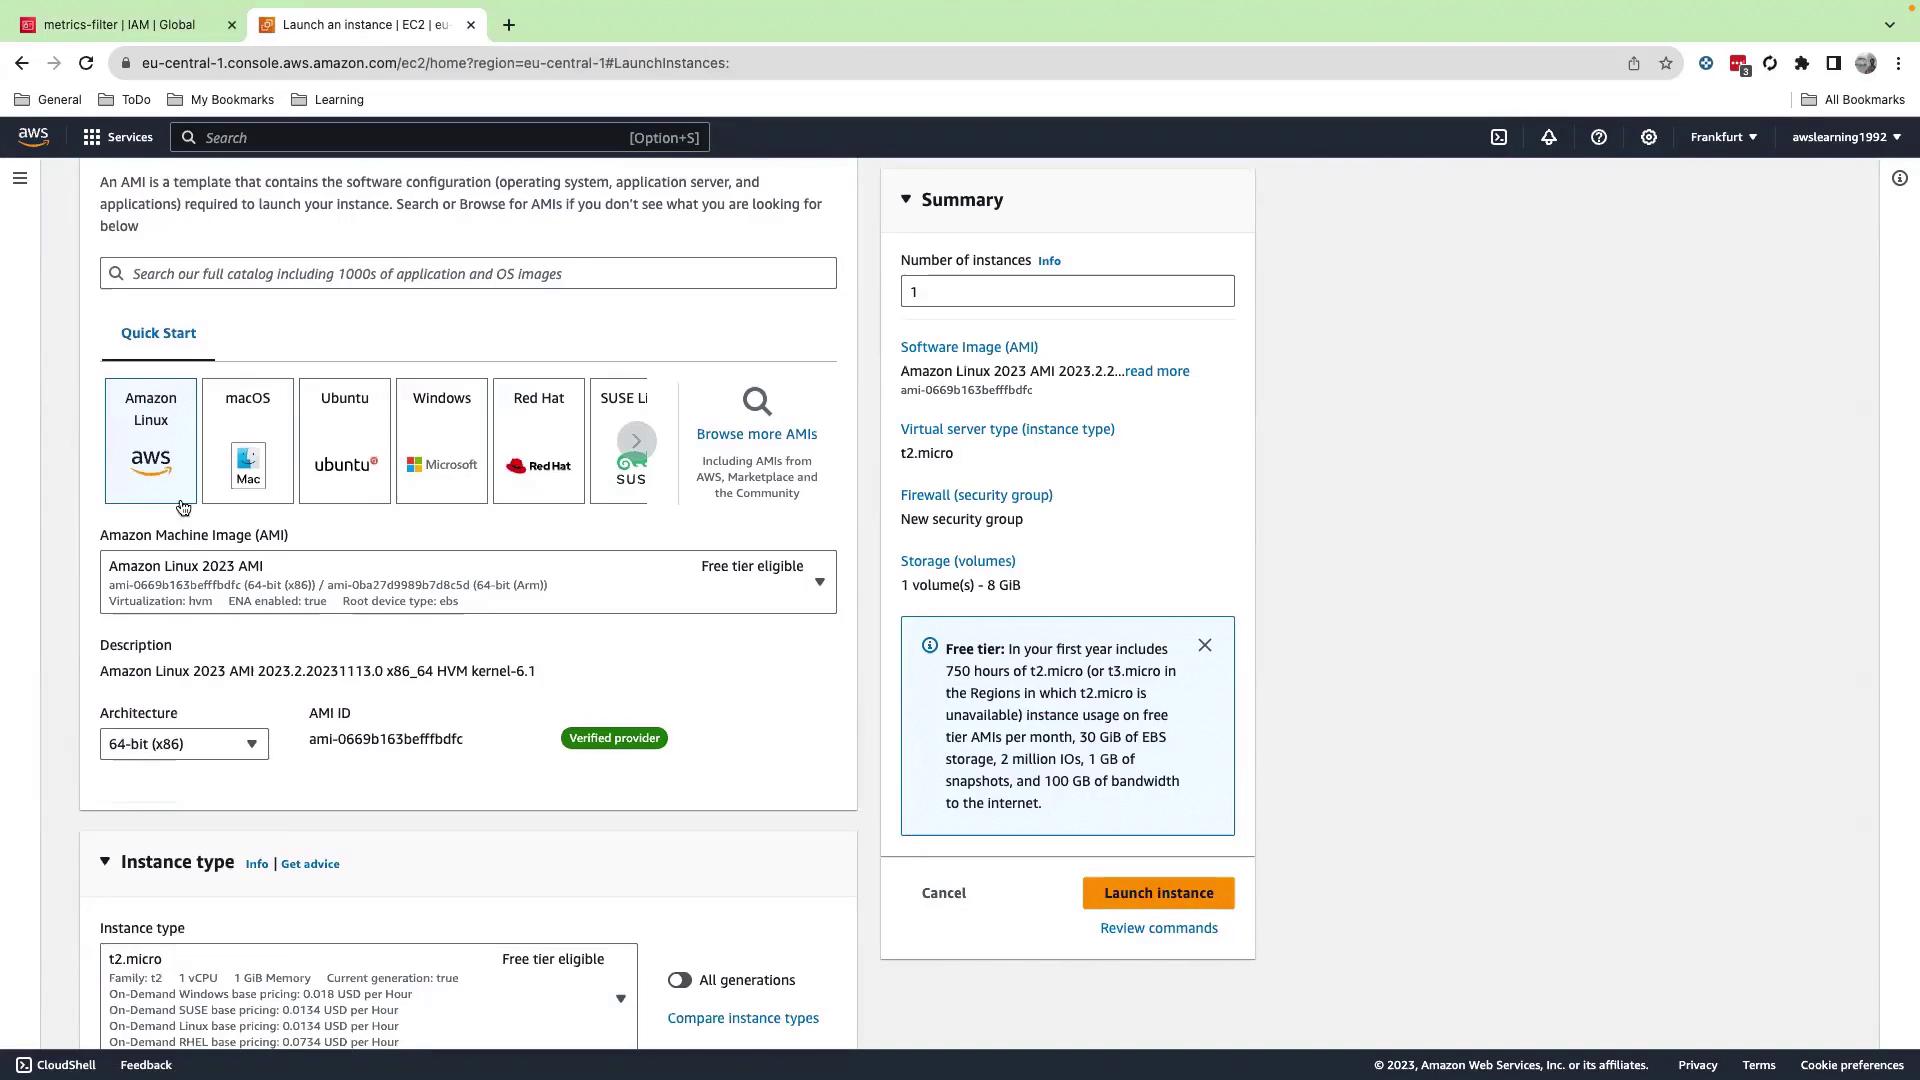
1. In the EC2 console, click **Instances** → **Launch instances**.
2. Select an **Amazon Linux** AMI and an appropriate instance type.
3. For demonstration only: you may proceed without a key pair
For demonstration only: you may proceed without a key pair. **Do not** skip key pair selection in production.
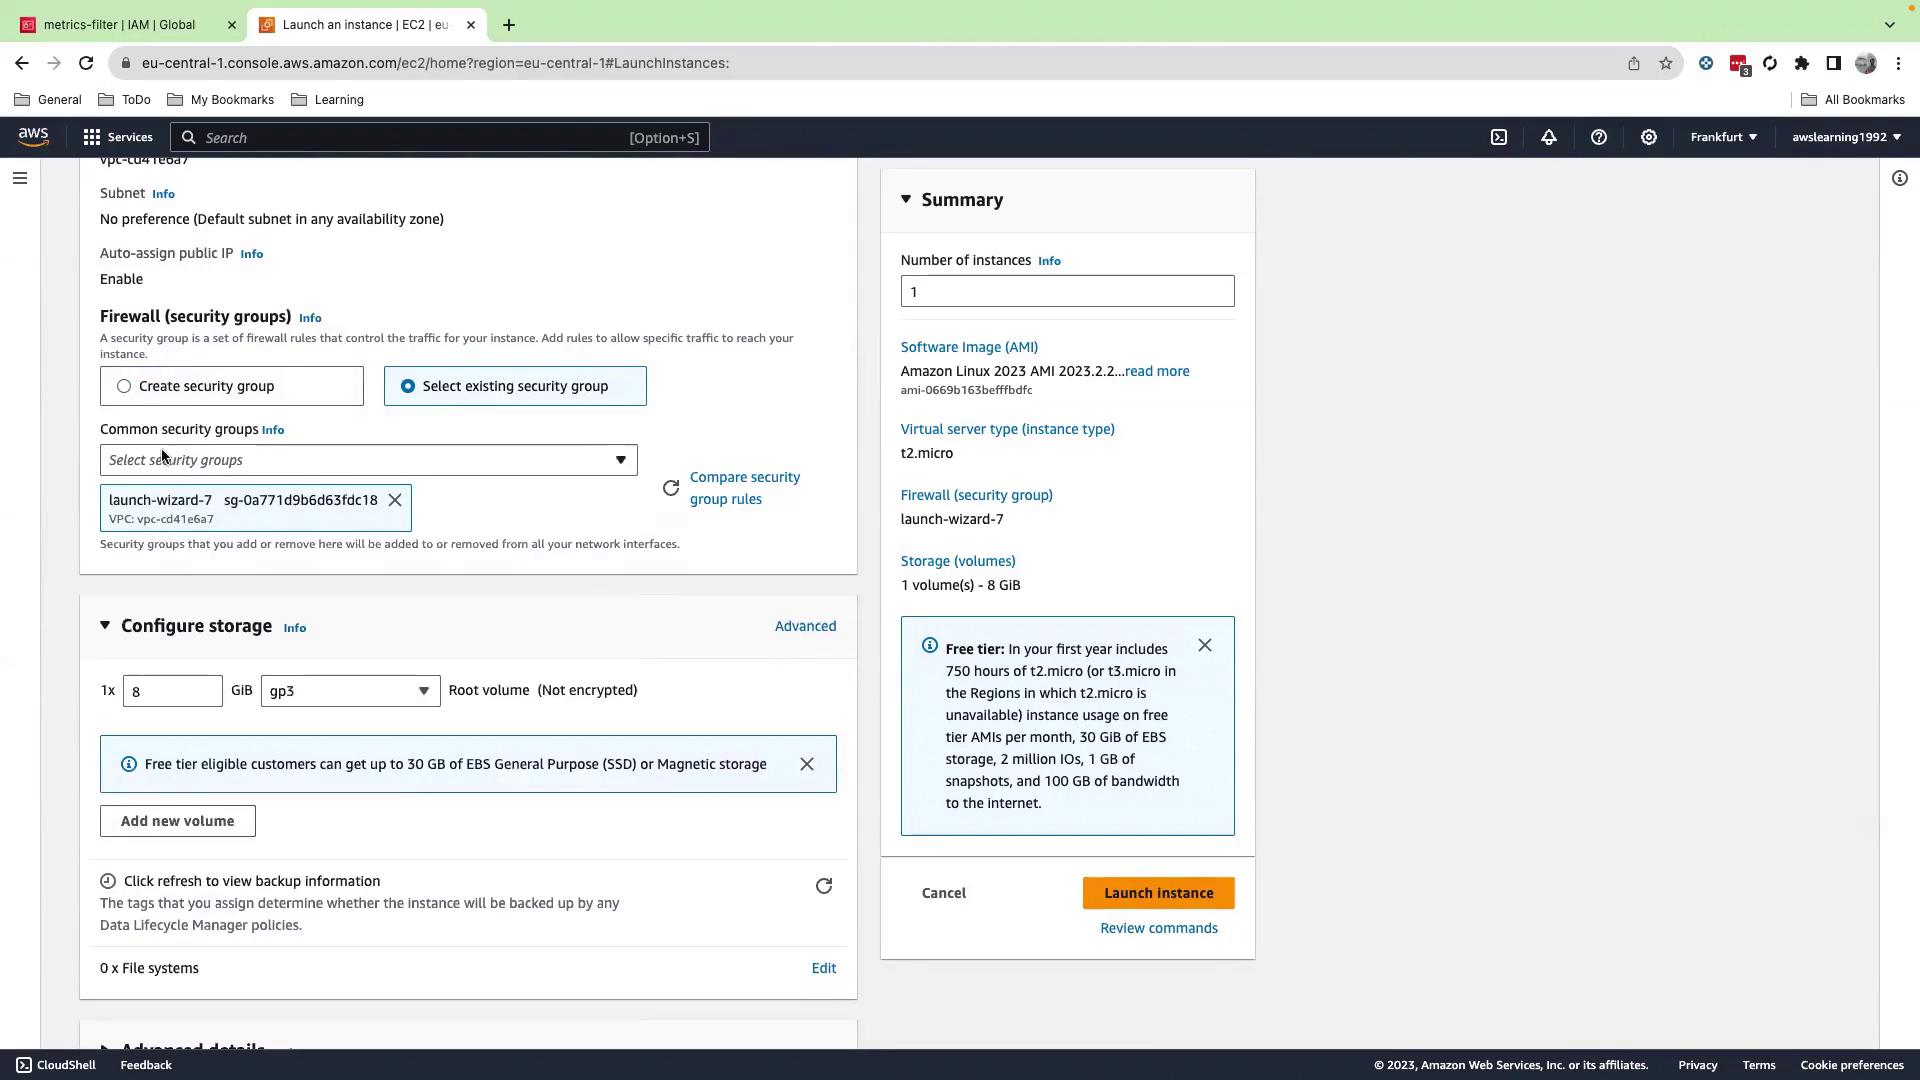
4. Under **Network settings**, choose your security group (allow SSH).
5. Expand **Advanced details** and assign the updated IAM role (`metrics-filter`).
6. Click **Launch instance**.
***
## 3. Verify Instance Status
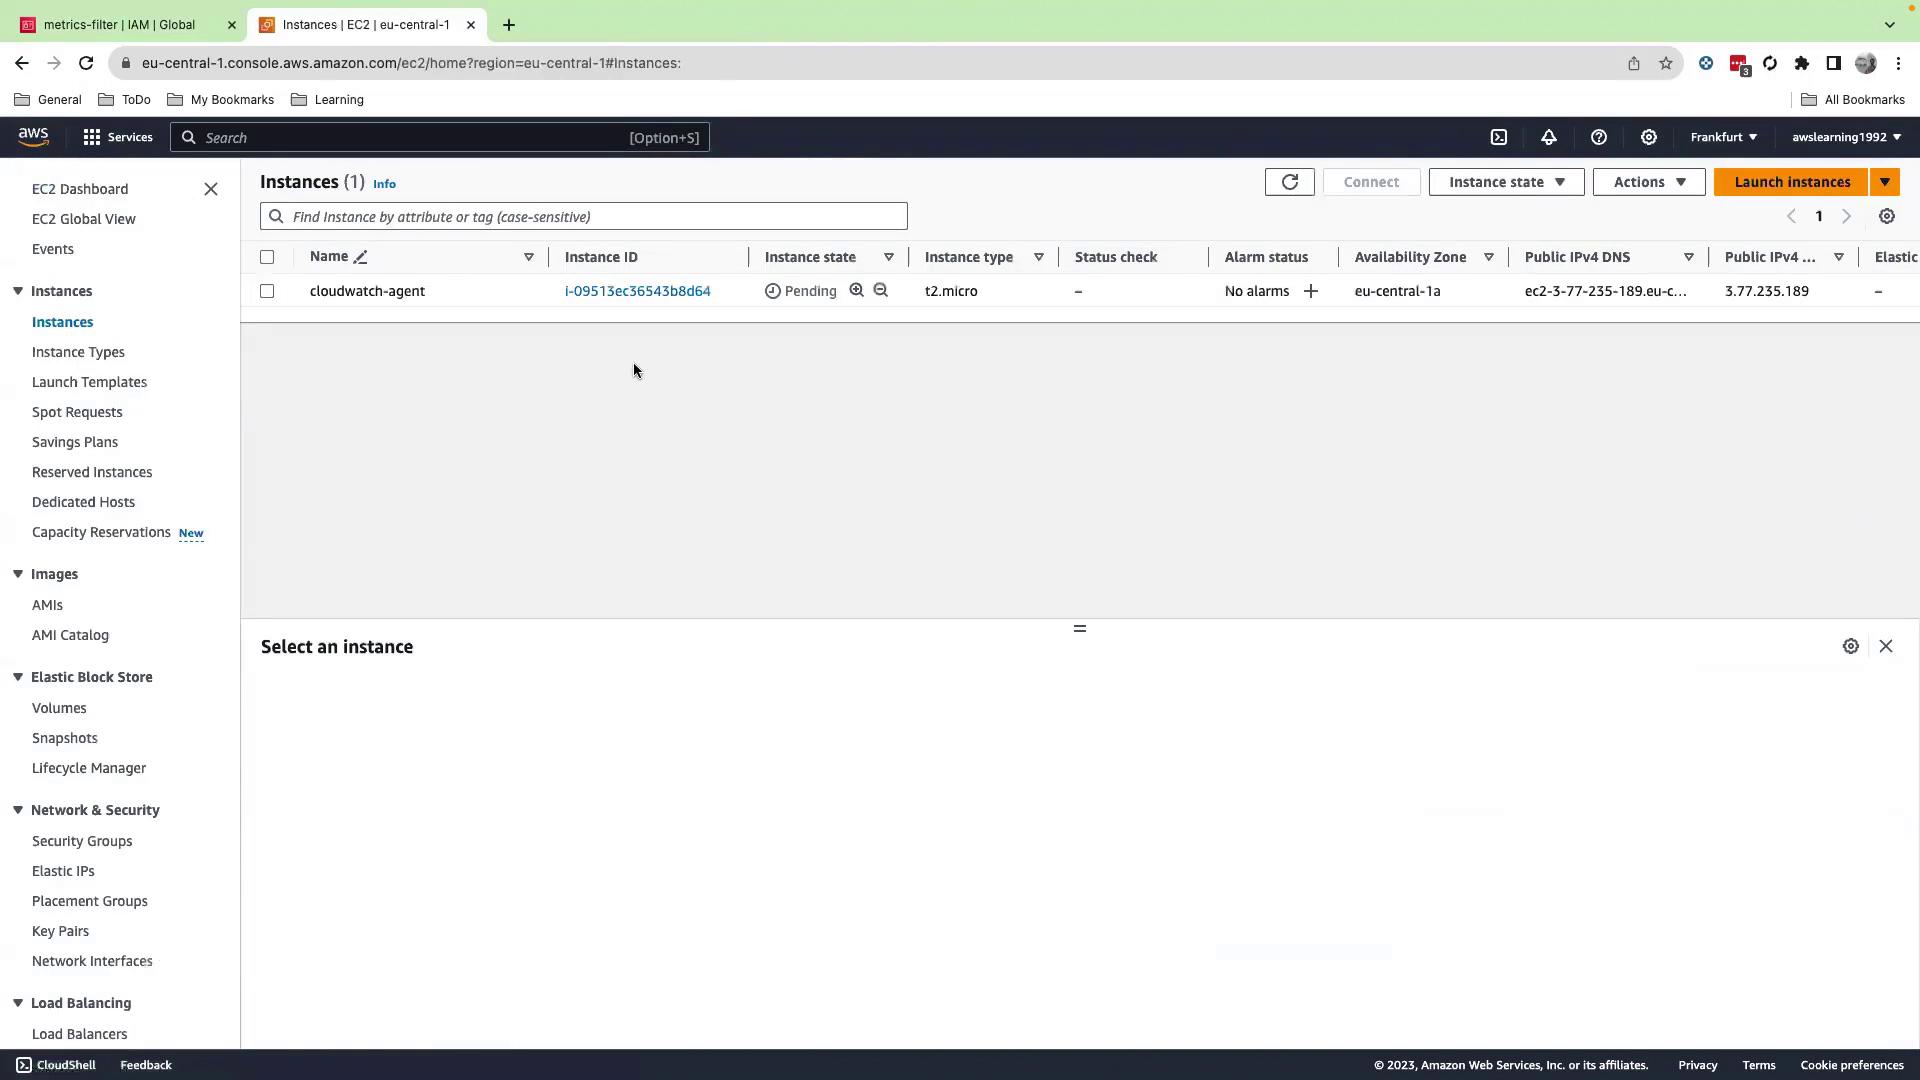
Wait for your instance to enter the **running** state and pass status checks.
***
## 4. Inspect Audit Logs on EC2
SSH into the instance, switch to root, and explore the audit logs:
```bash theme={null}
ssh ec2-user@
sudo su -
cd /var/log
ls -l
tail -100f audit/audit.log
```
You should see entries for SSH logins, sudo commands, and other audit events.
***
## 5. Install the CloudWatch Agent
Download and install the agent package:
```bash theme={null}
cd ~
wget https://s3.amazonaws.com/amazoncloudwatch-agent/linux/amd64/latest/AmazonCloudWatchAgent.zip
unzip AmazonCloudWatchAgent.zip
sudo ./install.sh
```
This process creates the `cwagent` user and group.
***
## 6. Configure Log Collection
Create `cloudwatch-agent-config.json` in your home directory:
```json theme={null}
{
"logs": {
"logs_collected": {
"files": {
"collect_list": [
{
"file_path": "/var/log/audit/audit.log",
"log_group_name": "login-monitoring",
"log_stream_name": "{instance_id}"
}
]
}
}
}
}
```
You can add multiple `collect_list` entries to capture additional log files such as `/var/log/secure` or application logs.
***
## 7. Create the CloudWatch Log Group
1. Open the CloudWatch console and go to **Logs → Log groups**.
2. Click **Create log group**, name it `login-monitoring`, and configure retention as needed.
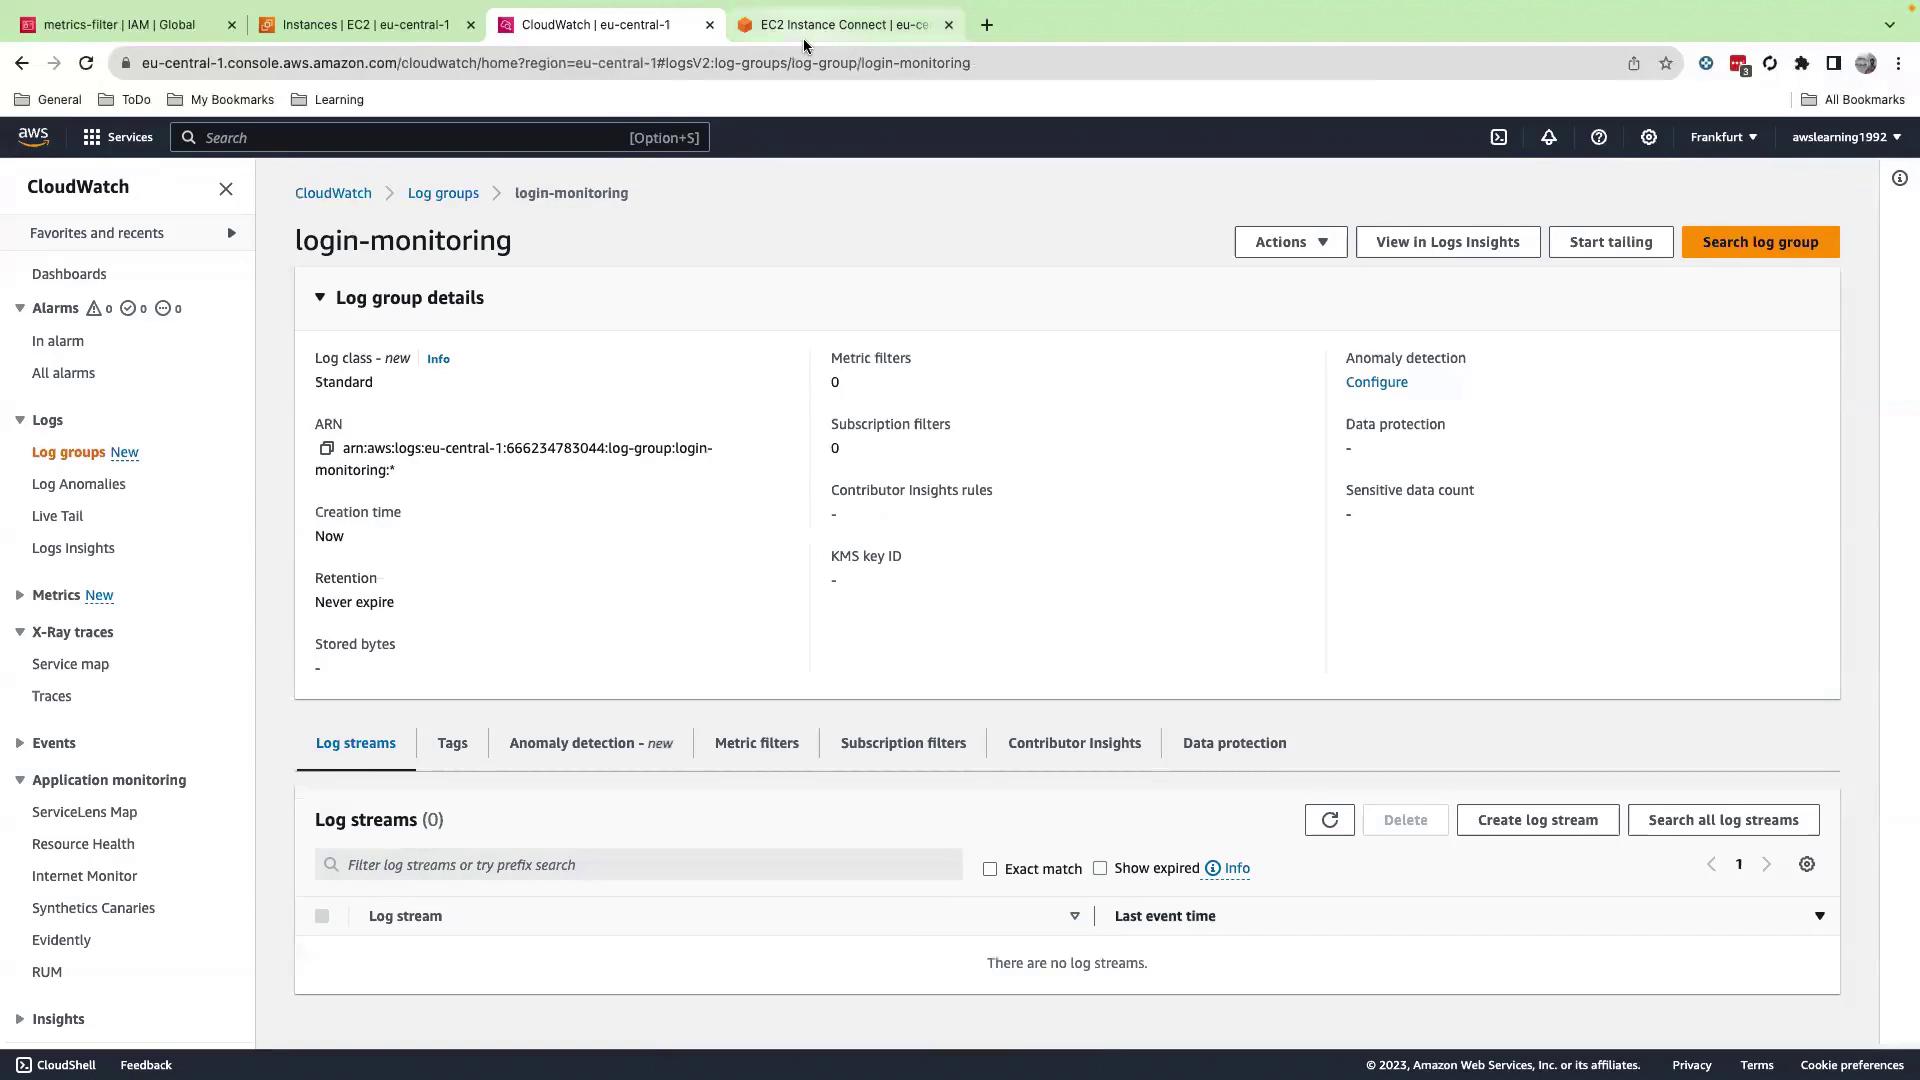
*No manual log streams needed: the agent creates one per EC2 instance.*
***
## 8. Start and Validate the CloudWatch Agent
Fetch the configuration and launch the agent:
```bash theme={null}
sudo /opt/aws/amazon-cloudwatch-agent/bin/amazon-cloudwatch-agent-ctl \
-a fetch-config -m ec2 \
-cf file:cloudwatch-agent-config.json -s
```
Check status:
```bash theme={null}
sudo /opt/aws/amazon-cloudwatch-agent/bin/amazon-cloudwatch-agent-ctl -m ec2 -a status
```
Expected output:
```json theme={null}
{
"status": "running",
"starttime": "2023-11-30T02:41:10+00:00",
"configstatus": "configured",
"version": "1.30001.0b313"
}
```
Inspect agent logs:
```bash theme={null}
ls -l /var/log/amazon-cloudwatch-agent
ls -l /opt/aws/amazon-cloudwatch-agent/logs
tail -f /opt/aws/amazon-cloudwatch-agent/logs/amazon-cloudwatch-agent.log
```
***
## 9. View Logs in CloudWatch
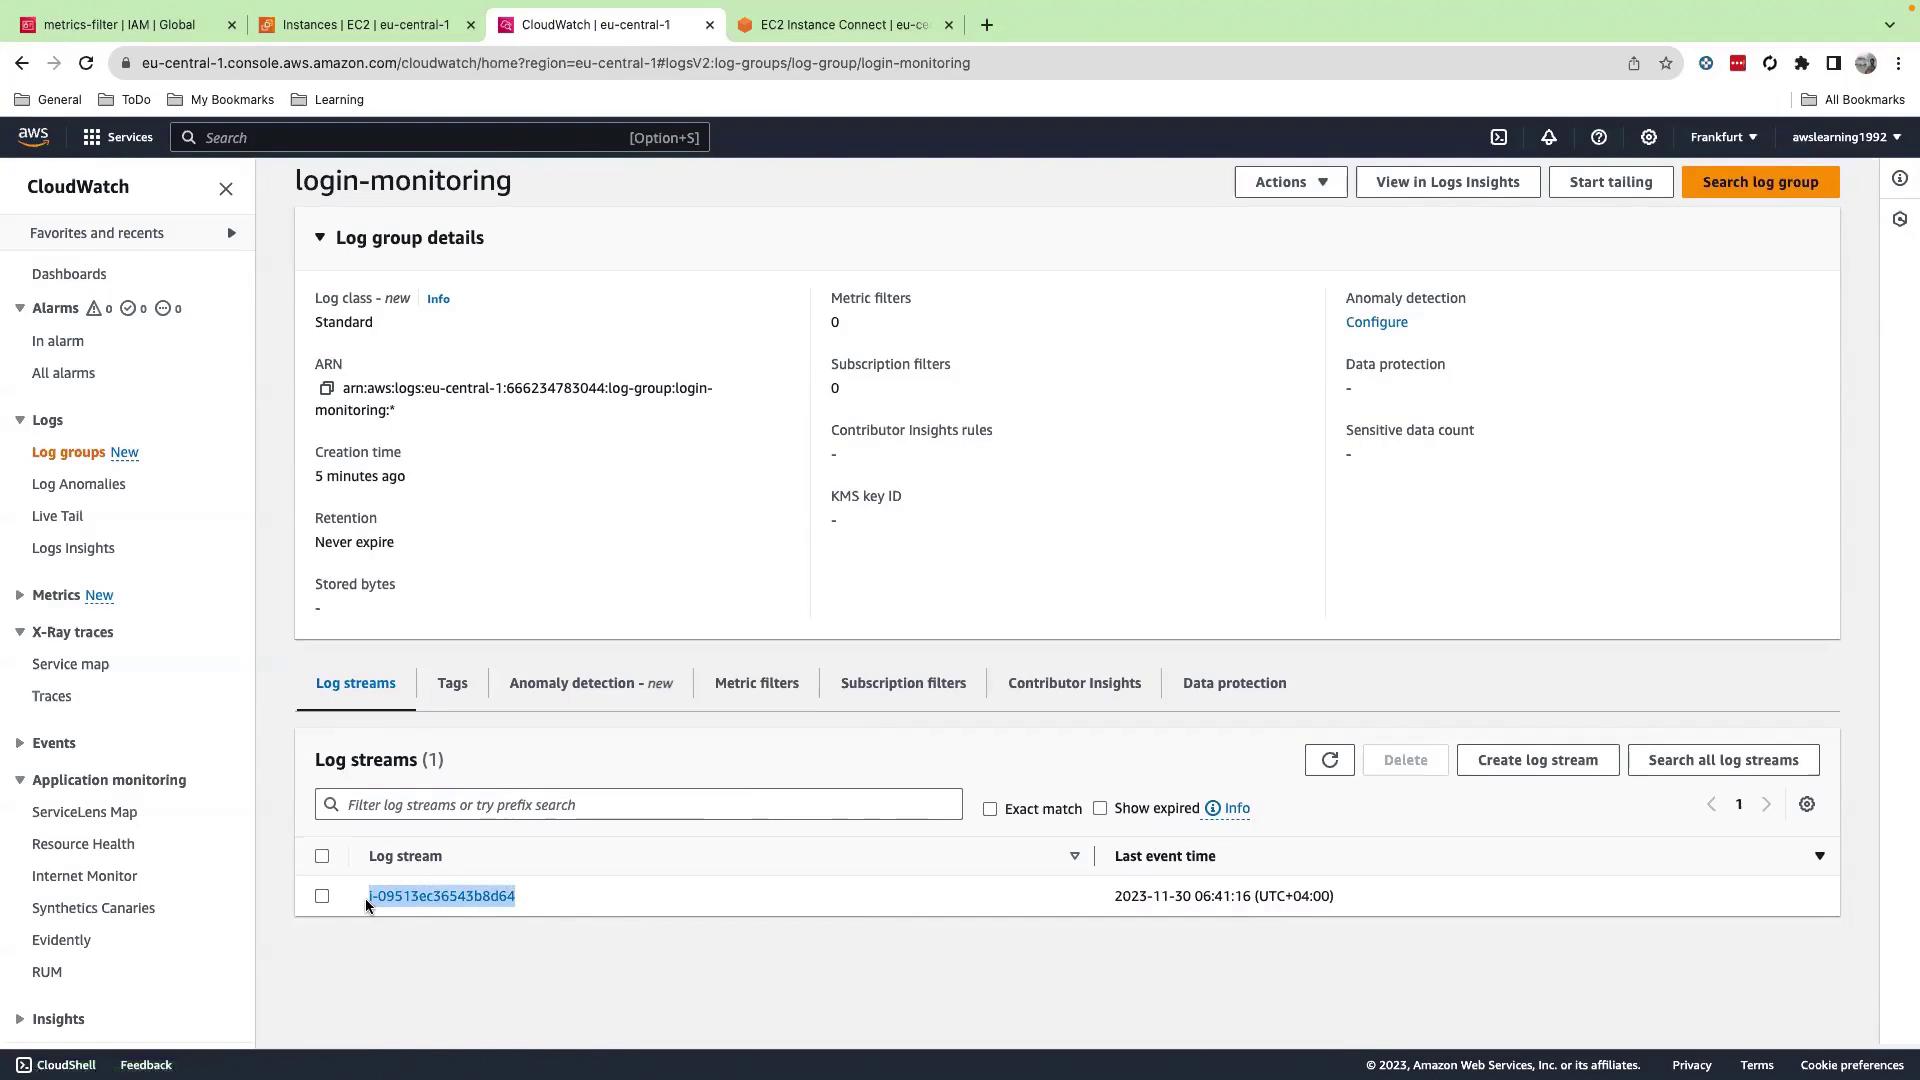
Back in the CloudWatch console, navigate to **Logs → Log groups → login-monitoring** and refresh. You’ll see one log stream per instance.
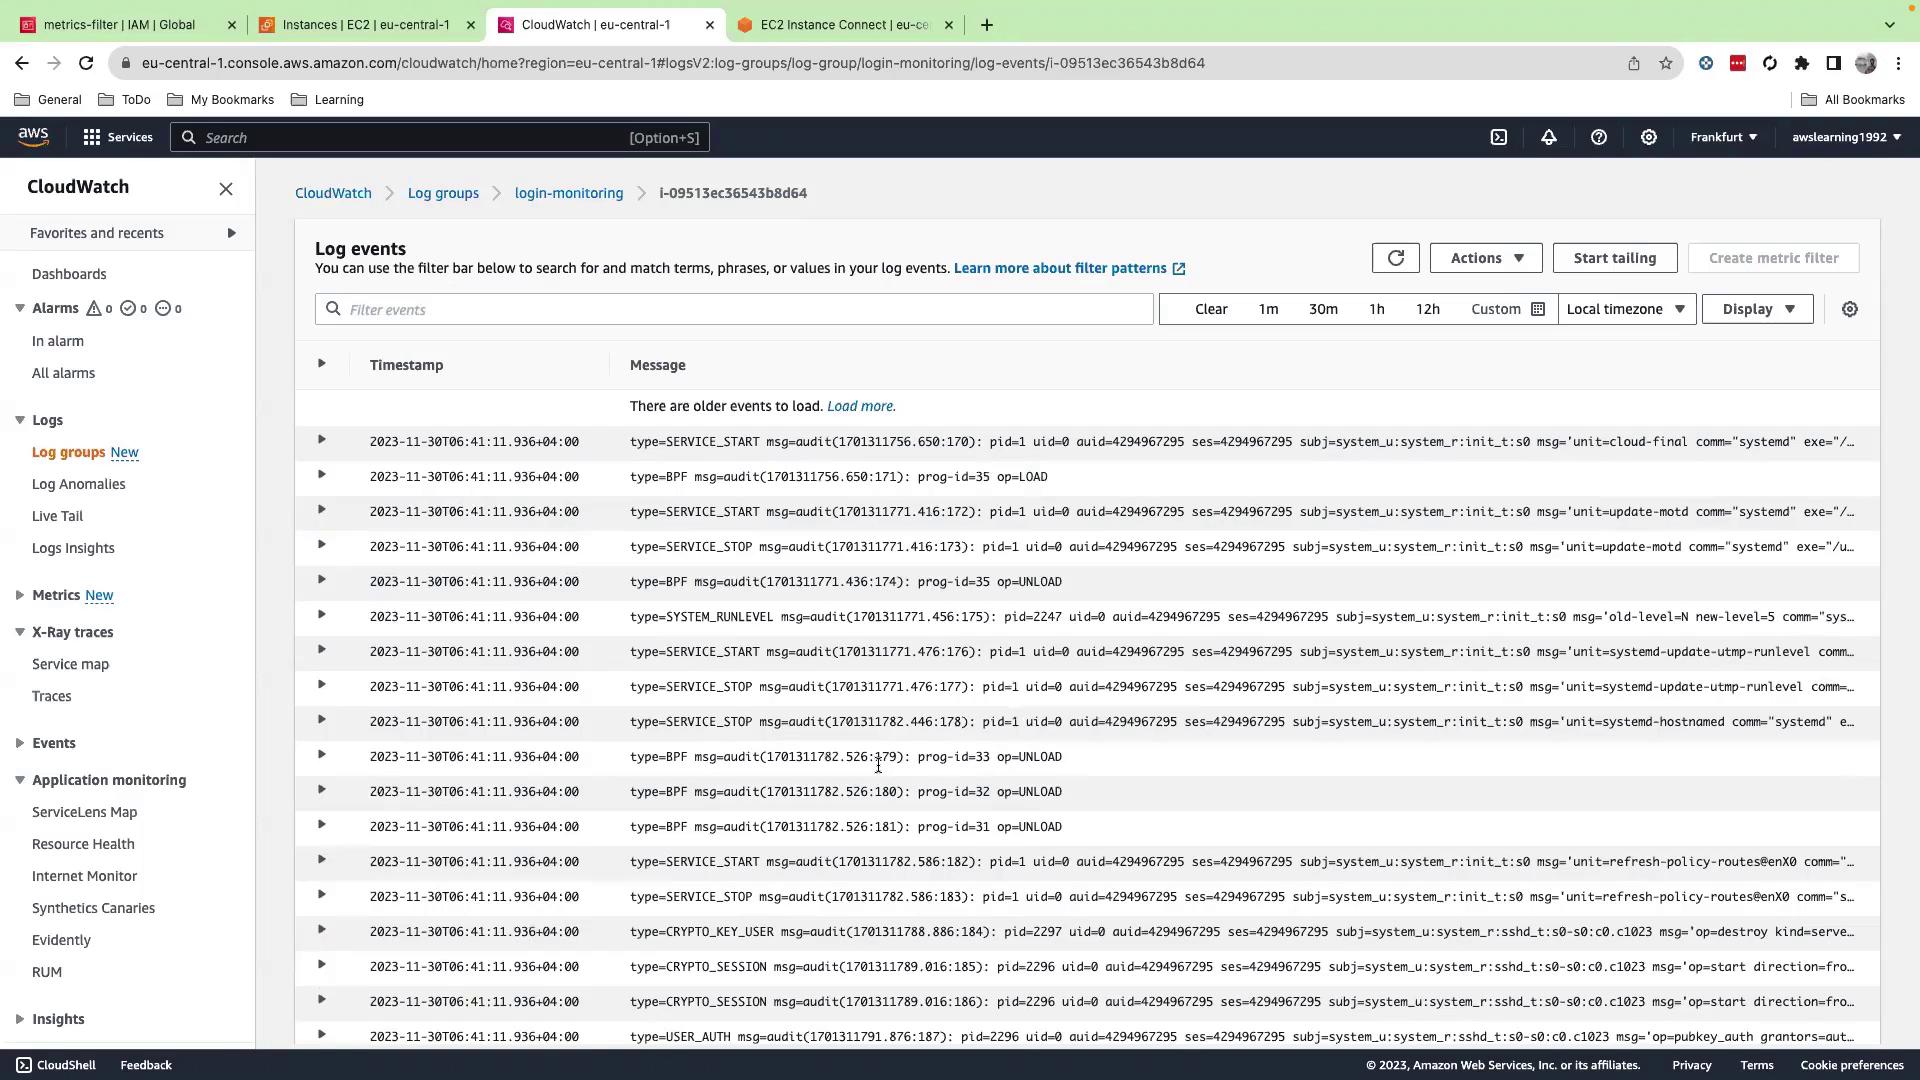
Click your instance’s log stream to inspect log events:
***
## Next Steps
* Create **metric filters** to detect failed SSH attempts:
```bash theme={null}
aws logs put-metric-filter \
--log-group-name login-monitoring \
--filter-name SSHFailFilter \
--filter-pattern "{ $.message = *Failed password* }" \
--metric-transformations \
metricName=SSHFailCount,metricNamespace=Security,metricValue=1
```
* Set up **CloudWatch Alarms** on `SSHFailCount`.
* Build a **dashboard** to visualize login attempts and failures.
***
## References
* [AWS CloudWatch Logs Documentation](https://docs.aws.amazon.com/AmazonCloudWatch/latest/logs/WhatIsCloudWatchLogs.html)
* [Amazon EC2 User Guide](https://docs.aws.amazon.com/AWSEC2/latest/UserGuide/concepts.html)
* [AWS CLI Command Reference](https://docs.aws.amazon.com/cli/latest/index.html)