> ## Documentation Index
> Fetch the complete documentation index at: https://notes.kodekloud.com/llms.txt
> Use this file to discover all available pages before exploring further.

# Demo Metric Filter

> Learn to configure a metric filter in AWS CloudWatch, including creating IAM roles, generating logs, and setting up alarms for HTTP 404 errors.

In this guide, you’ll learn how to configure a metric filter in AWS CloudWatch from end to end. We will:

1. Create IAM policies and roles
2. Launch an EC2 instance with the IAM role
3. Generate sample application logs
4. Push logs to CloudWatch Logs
5. Define a metric filter for HTTP 404 errors
6. View metrics and create an alarm
7. Clean up resources

Let’s dive into the AWS Management Console.

***

## 1. Create an IAM Policy

1. Open the [IAM console](https://console.aws.amazon.com/iam/) and select **Policies** > **Create policy**.
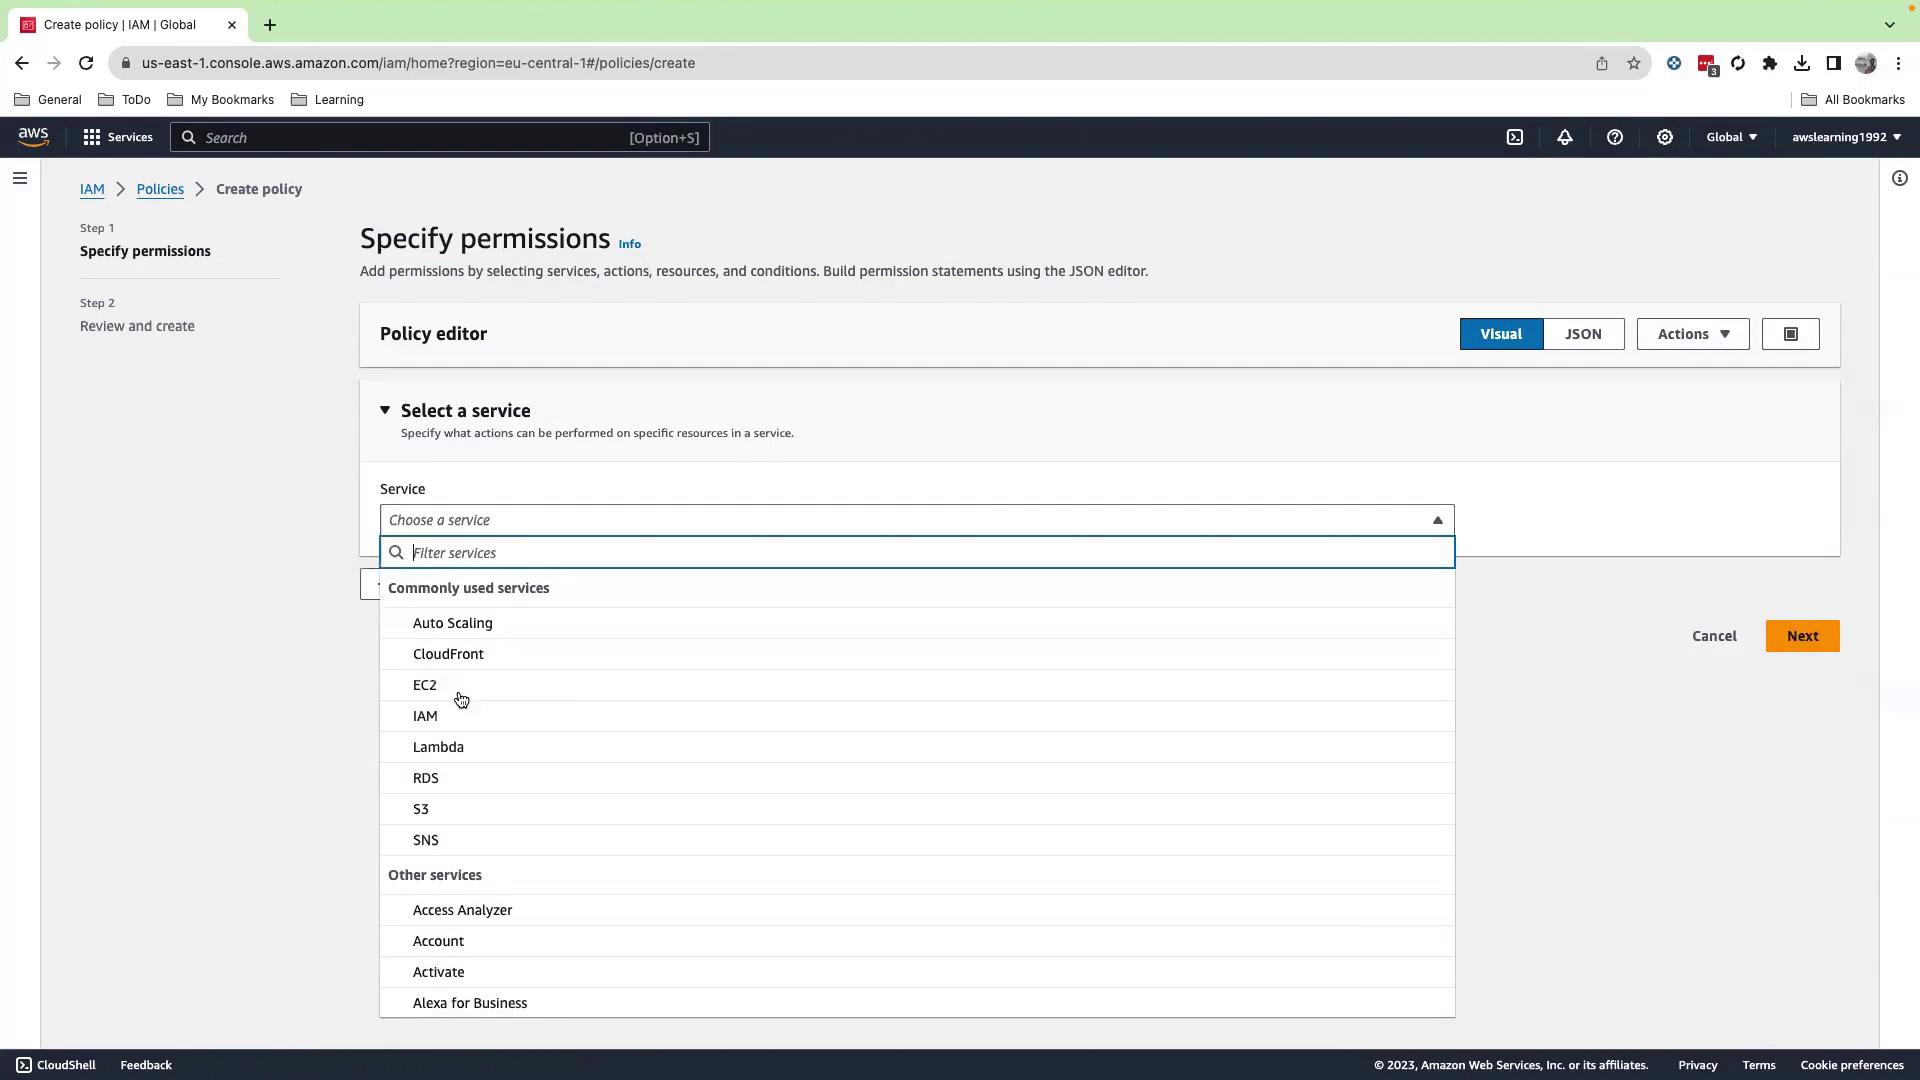
2. Under **Service**, choose **EC2** and enable **All EC2 permissions**.
<Frame>
  ![The image shows an AWS IAM console screen where a user is specifying permissions for a policy by selecting a service from a dropdown menu. Commonly used services like EC2, Lambda, and S3 are listed.](https://kodekloud.com/kk-media/image/upload/v1752862445/notes-assets/images/AWS-CloudWatch-Demo-Metric-Filter/aws-iam-console-permissions-policy-dropdown.jpg)
</Frame>

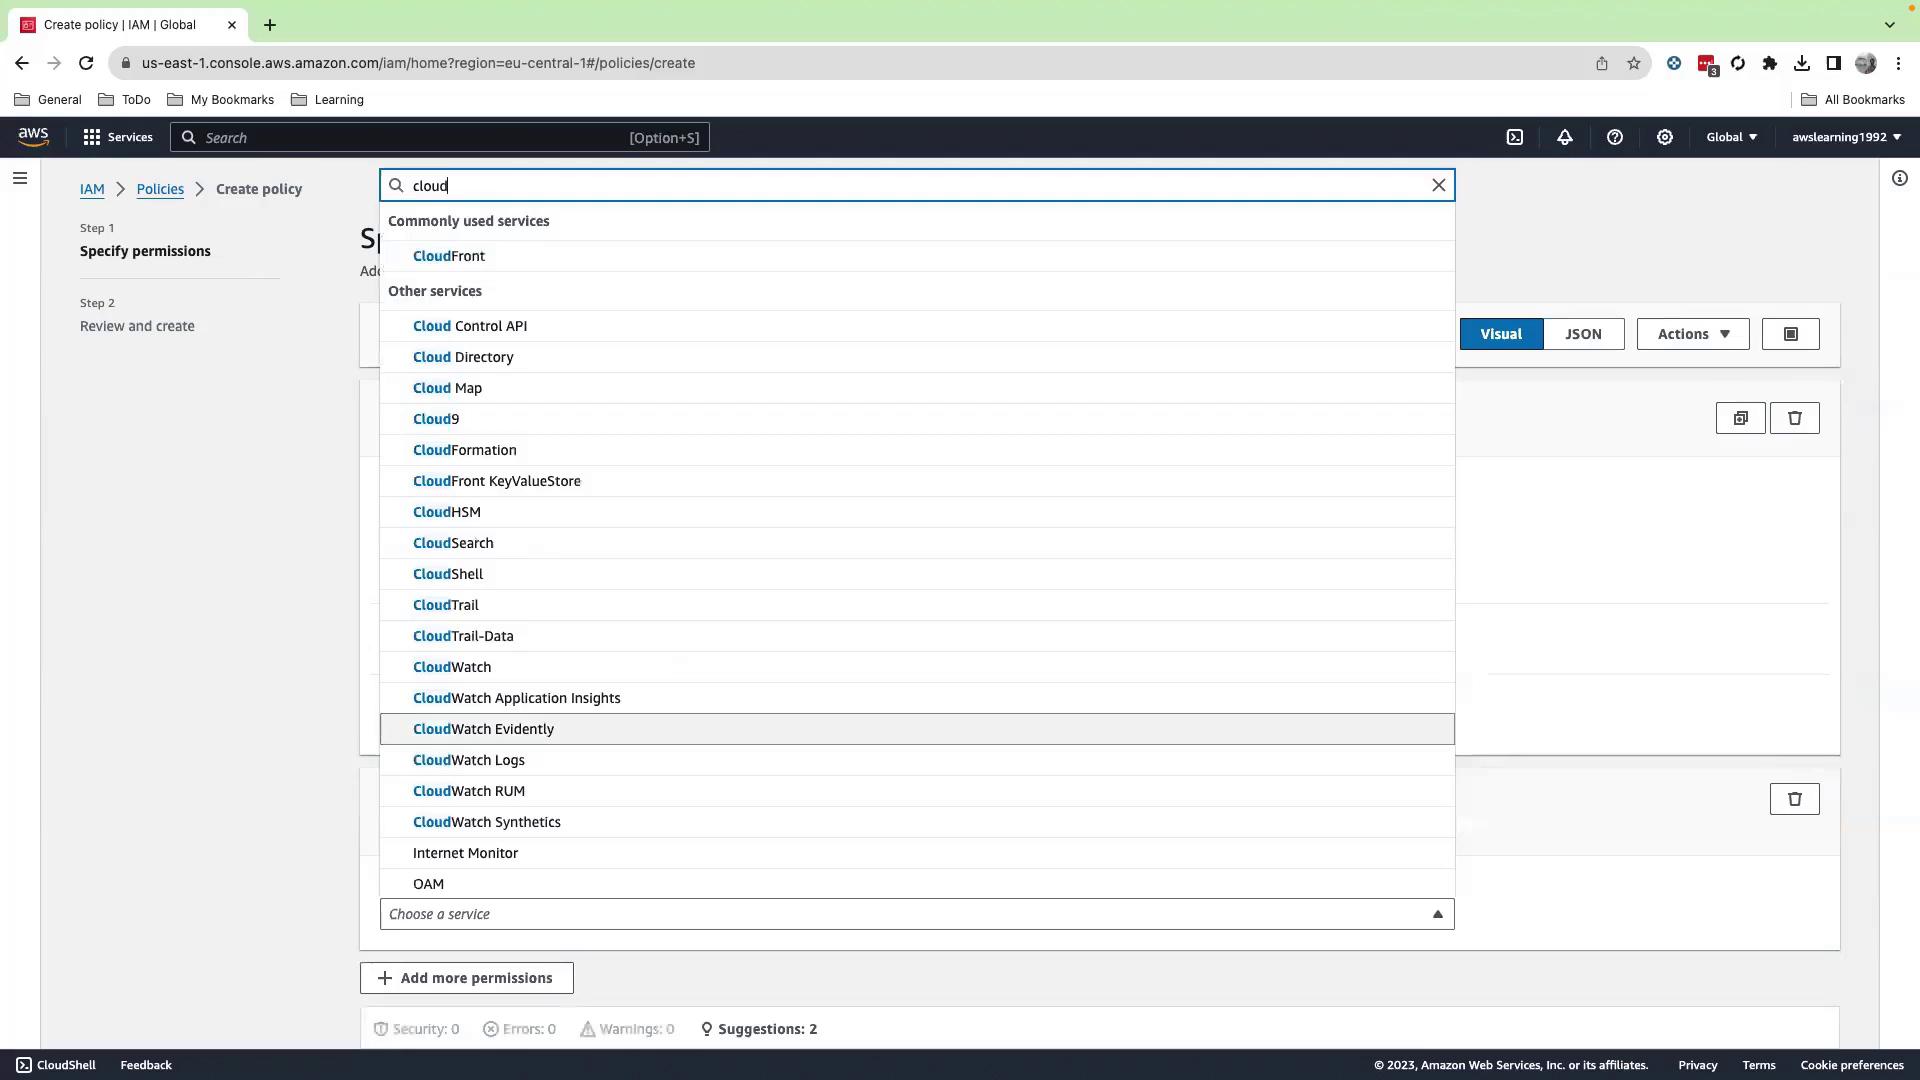
3. Click **Add permissions**, search for **CloudWatch**, and select **All CloudWatch permissions**.
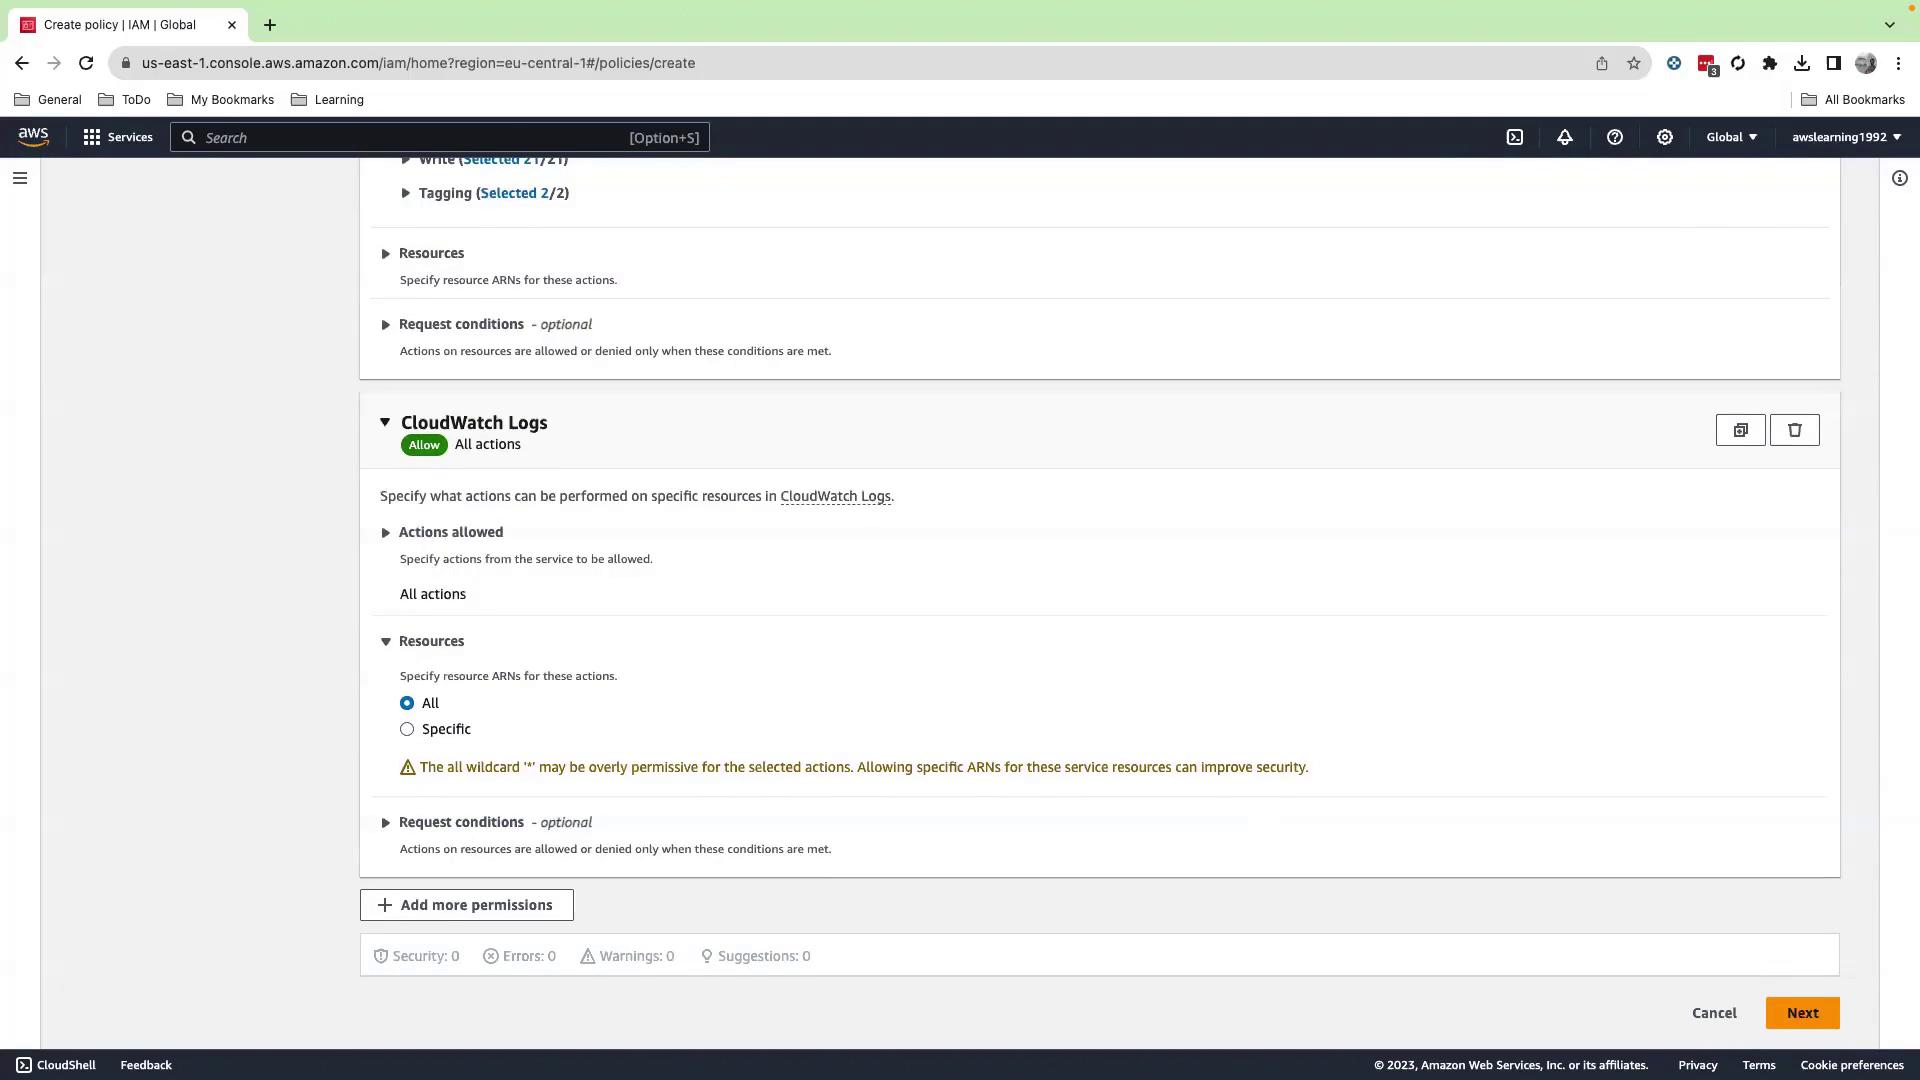
4. Add **CloudWatch Logs** with **All actions allowed**.
<Frame>
  ![The image shows an AWS IAM policy creation interface with a search for cloud-related services, displaying options like CloudFront, CloudWatch, and CloudTrail.](https://kodekloud.com/kk-media/image/upload/v1752862446/notes-assets/images/AWS-CloudWatch-Demo-Metric-Filter/aws-iam-policy-creation-interface.jpg)
</Frame>

<Frame>
  ![The image shows an AWS IAM policy creation screen, specifically focusing on setting permissions for CloudWatch Logs with options to allow all actions and specify resource ARNs.](https://kodekloud.com/kk-media/image/upload/v1752862447/notes-assets/images/AWS-CloudWatch-Demo-Metric-Filter/aws-iam-policy-cloudwatch-logs-permissions.jpg)
</Frame>

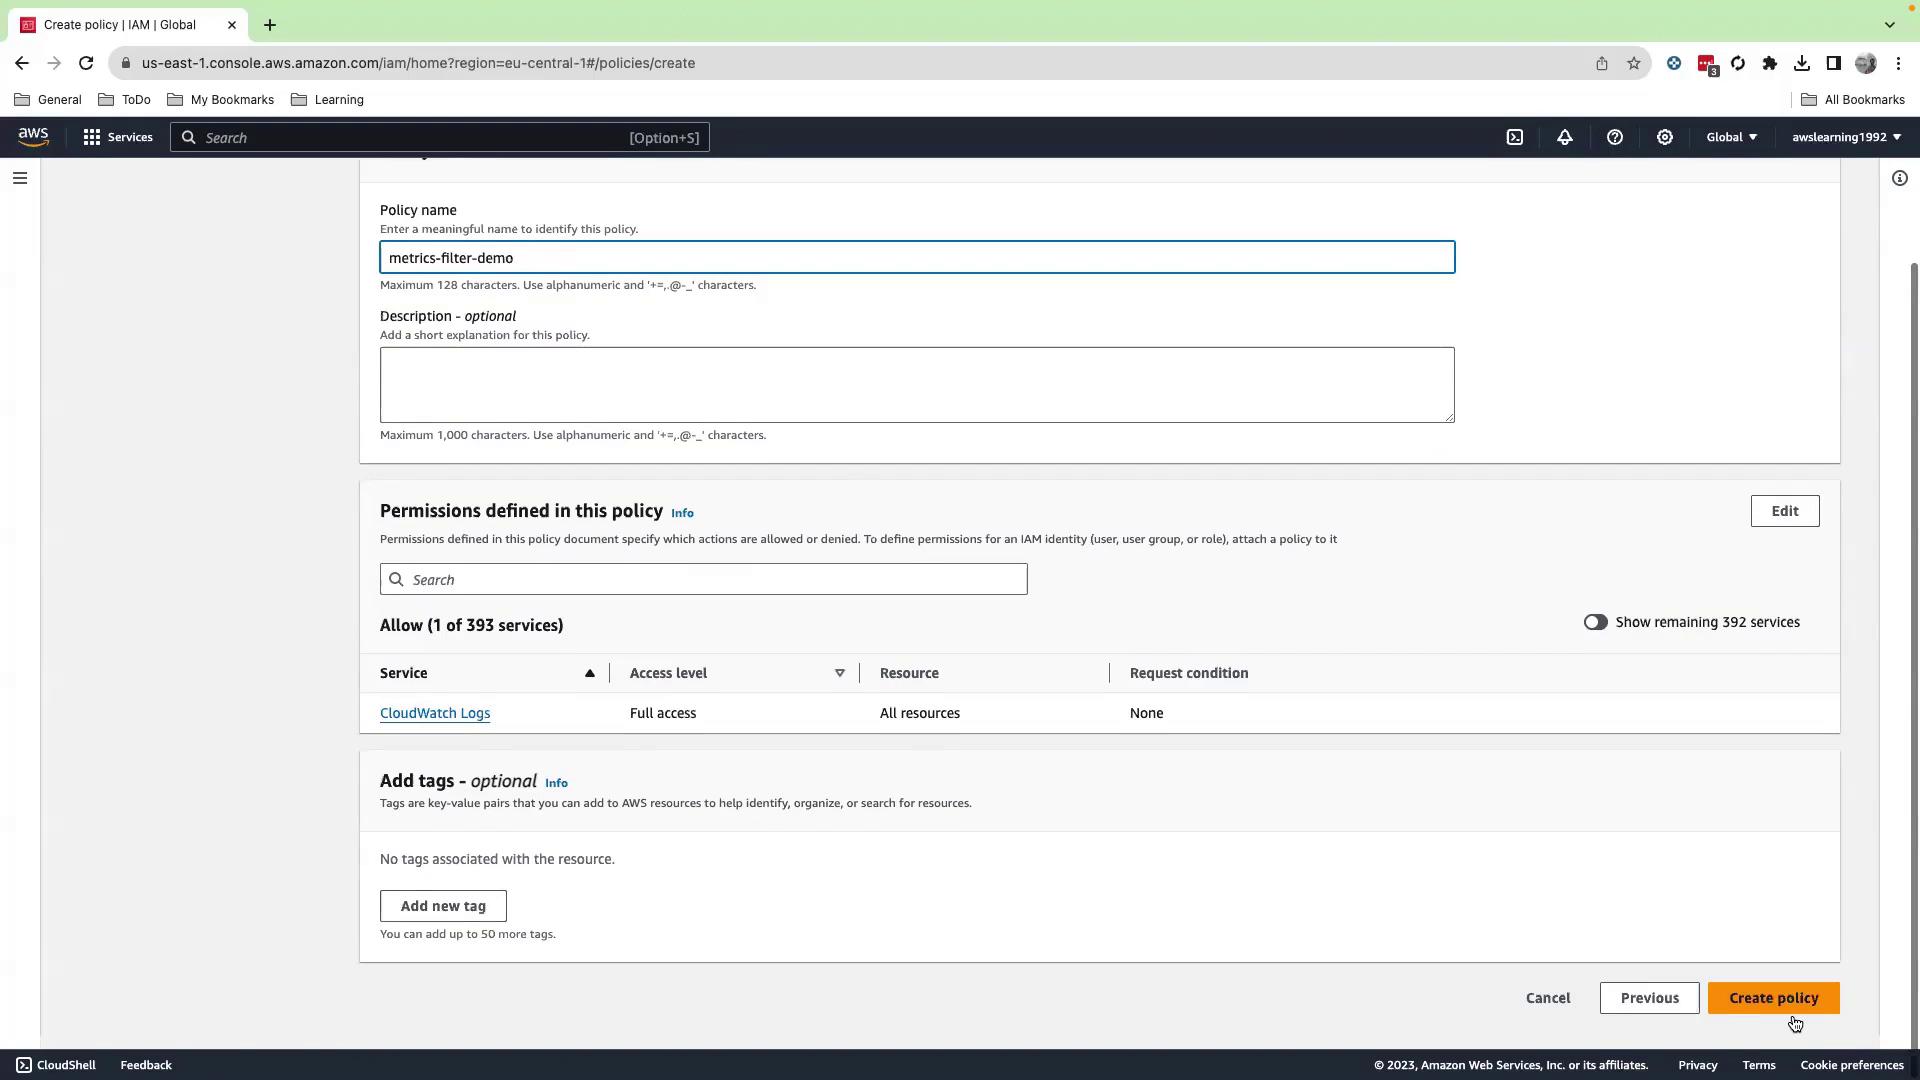
5. Click **Next**, name the policy `metric-filter-demo`, then **Create policy**.
<Frame>
  ![The image shows an AWS IAM policy creation page, where a policy named "metrics-filter-demo" is being configured with full access to CloudWatch Logs.](https://kodekloud.com/kk-media/image/upload/v1752862448/notes-assets/images/AWS-CloudWatch-Demo-Metric-Filter/aws-iam-policy-metrics-filter-demo.jpg)
</Frame>

***

## 2. Create an IAM Role

1. In the IAM console, go to **Roles** > **Create role**.
2. Choose **EC2** as the trusted entity, then attach the `metric-filter-demo` policy.
3. Name the role `metric-filter-role` and **Create role**.

***

## 3. Launch an EC2 Instance

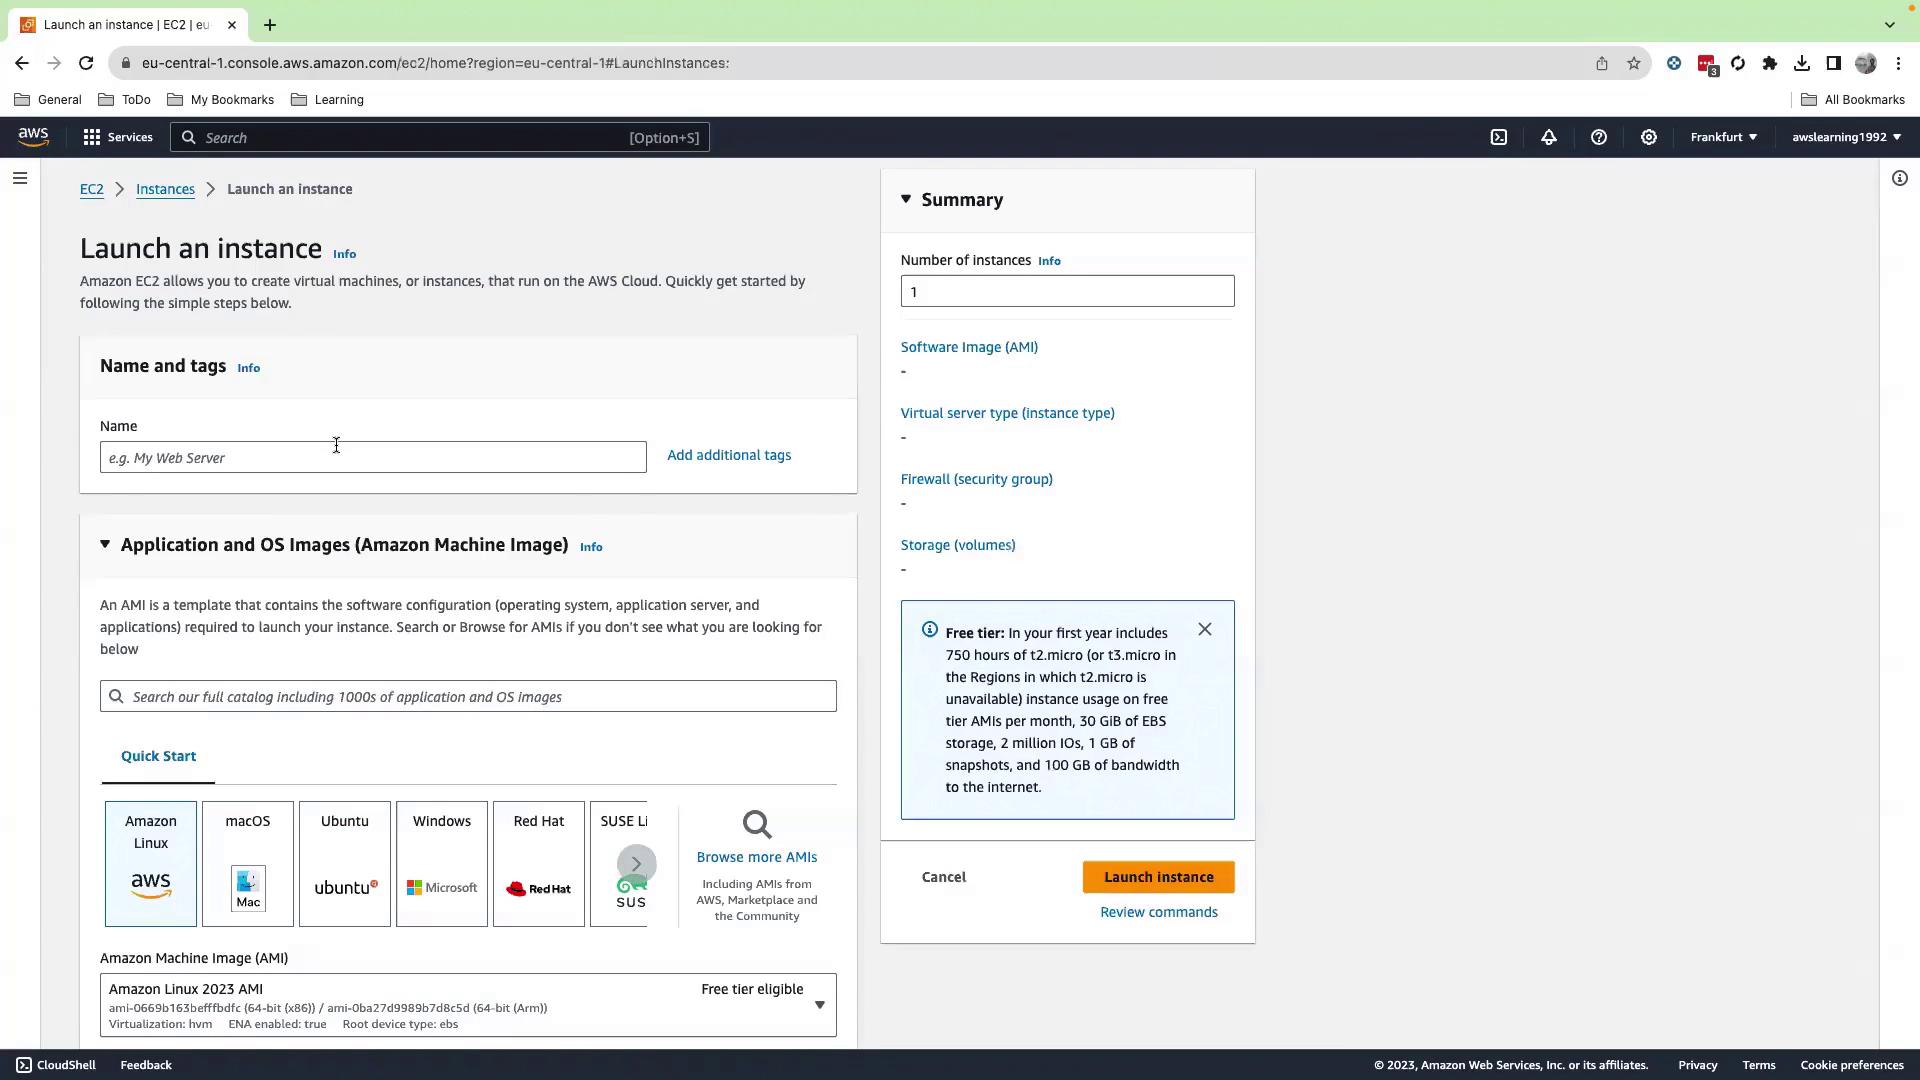
1. Navigate to the [EC2 console](https://console.aws.amazon.com/ec2/) and click **Launch instance**.
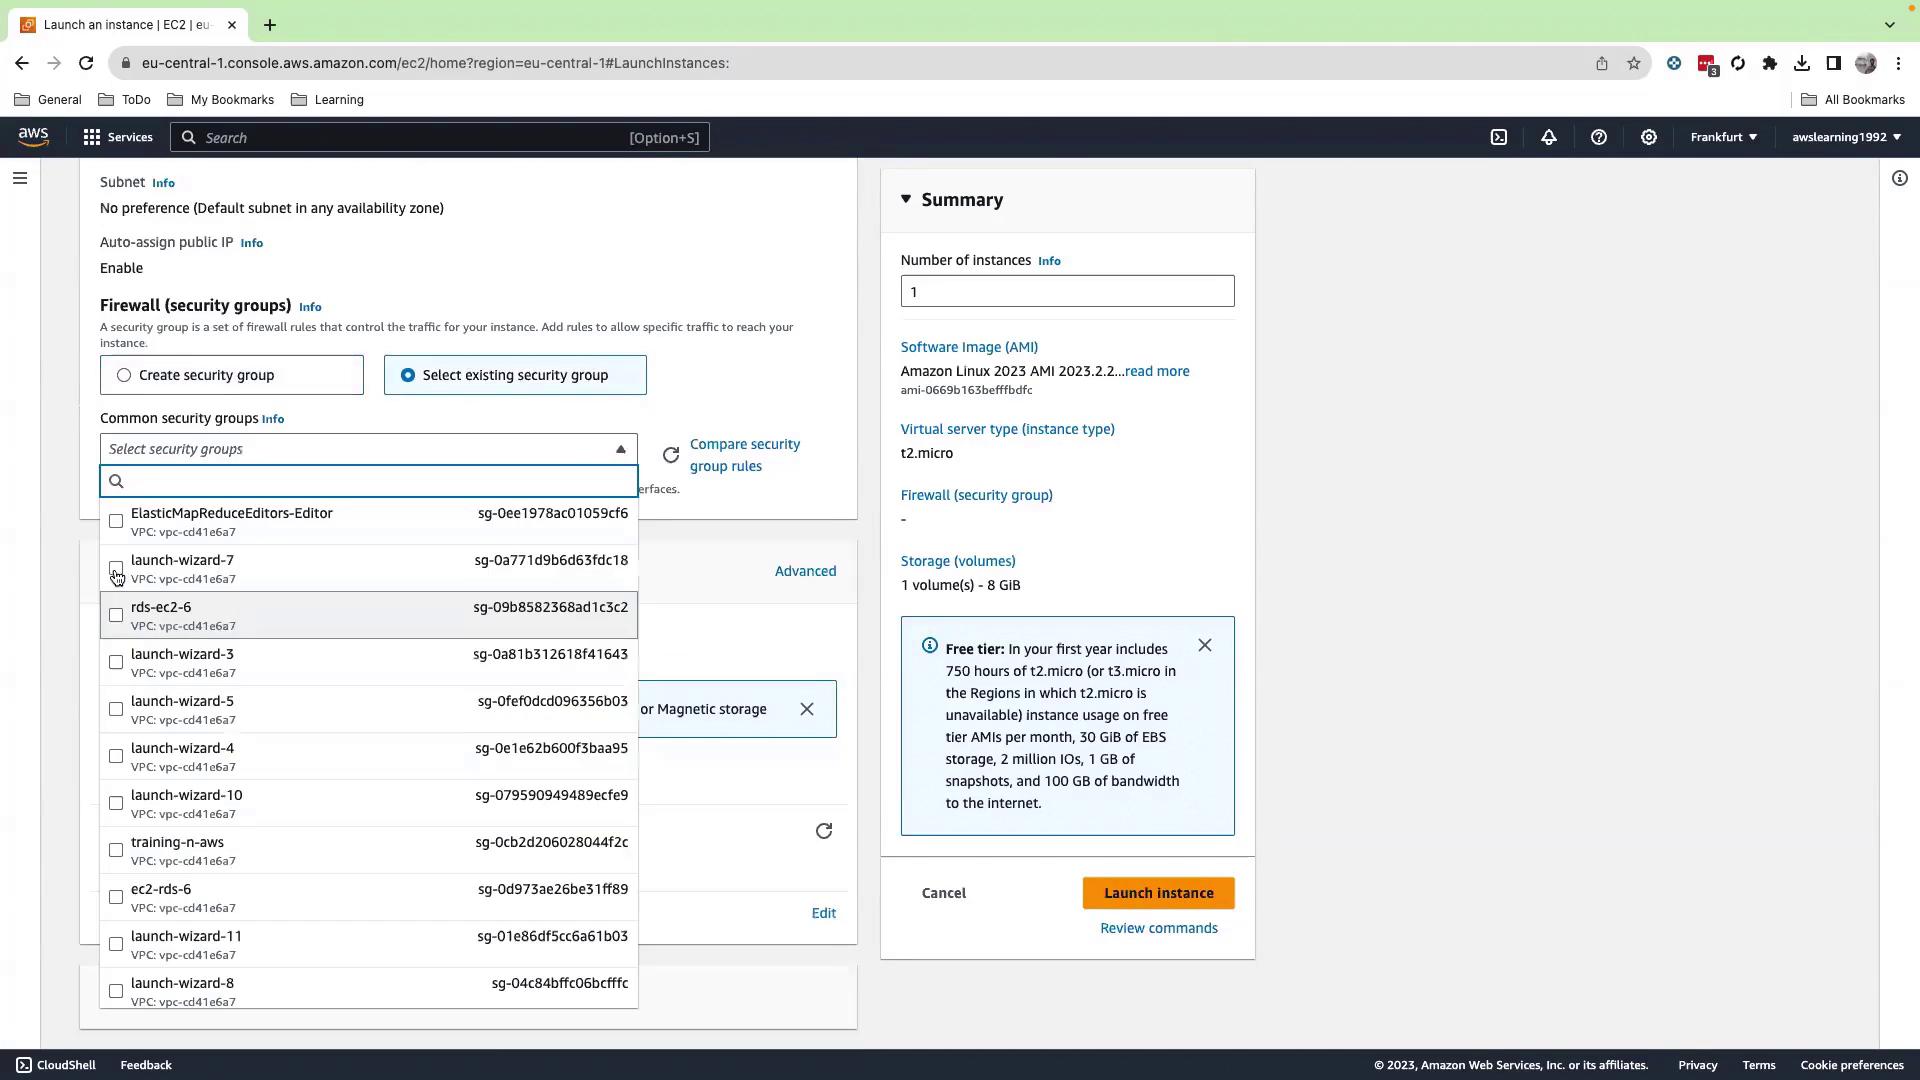
2. Provide a name tag, select an AMI, choose or create a key pair, and configure a security group.
<Frame>
  ![The image shows the AWS EC2 console interface for launching an instance, with options to select the name, tags, and Amazon Machine Image (AMI). There is also a summary section on the right and a "Launch instance" button.](https://kodekloud.com/kk-media/image/upload/v1752862449/notes-assets/images/AWS-CloudWatch-Demo-Metric-Filter/aws-ec2-launch-instance-console.jpg)
</Frame>

<Frame>
  ![The image shows an AWS EC2 console screen where a user is configuring the launch of an instance, selecting security groups, and reviewing instance details like type and storage.](https://kodekloud.com/kk-media/image/upload/v1752862450/notes-assets/images/AWS-CloudWatch-Demo-Metric-Filter/aws-ec2-console-launch-instance-configuration.jpg)
</Frame>

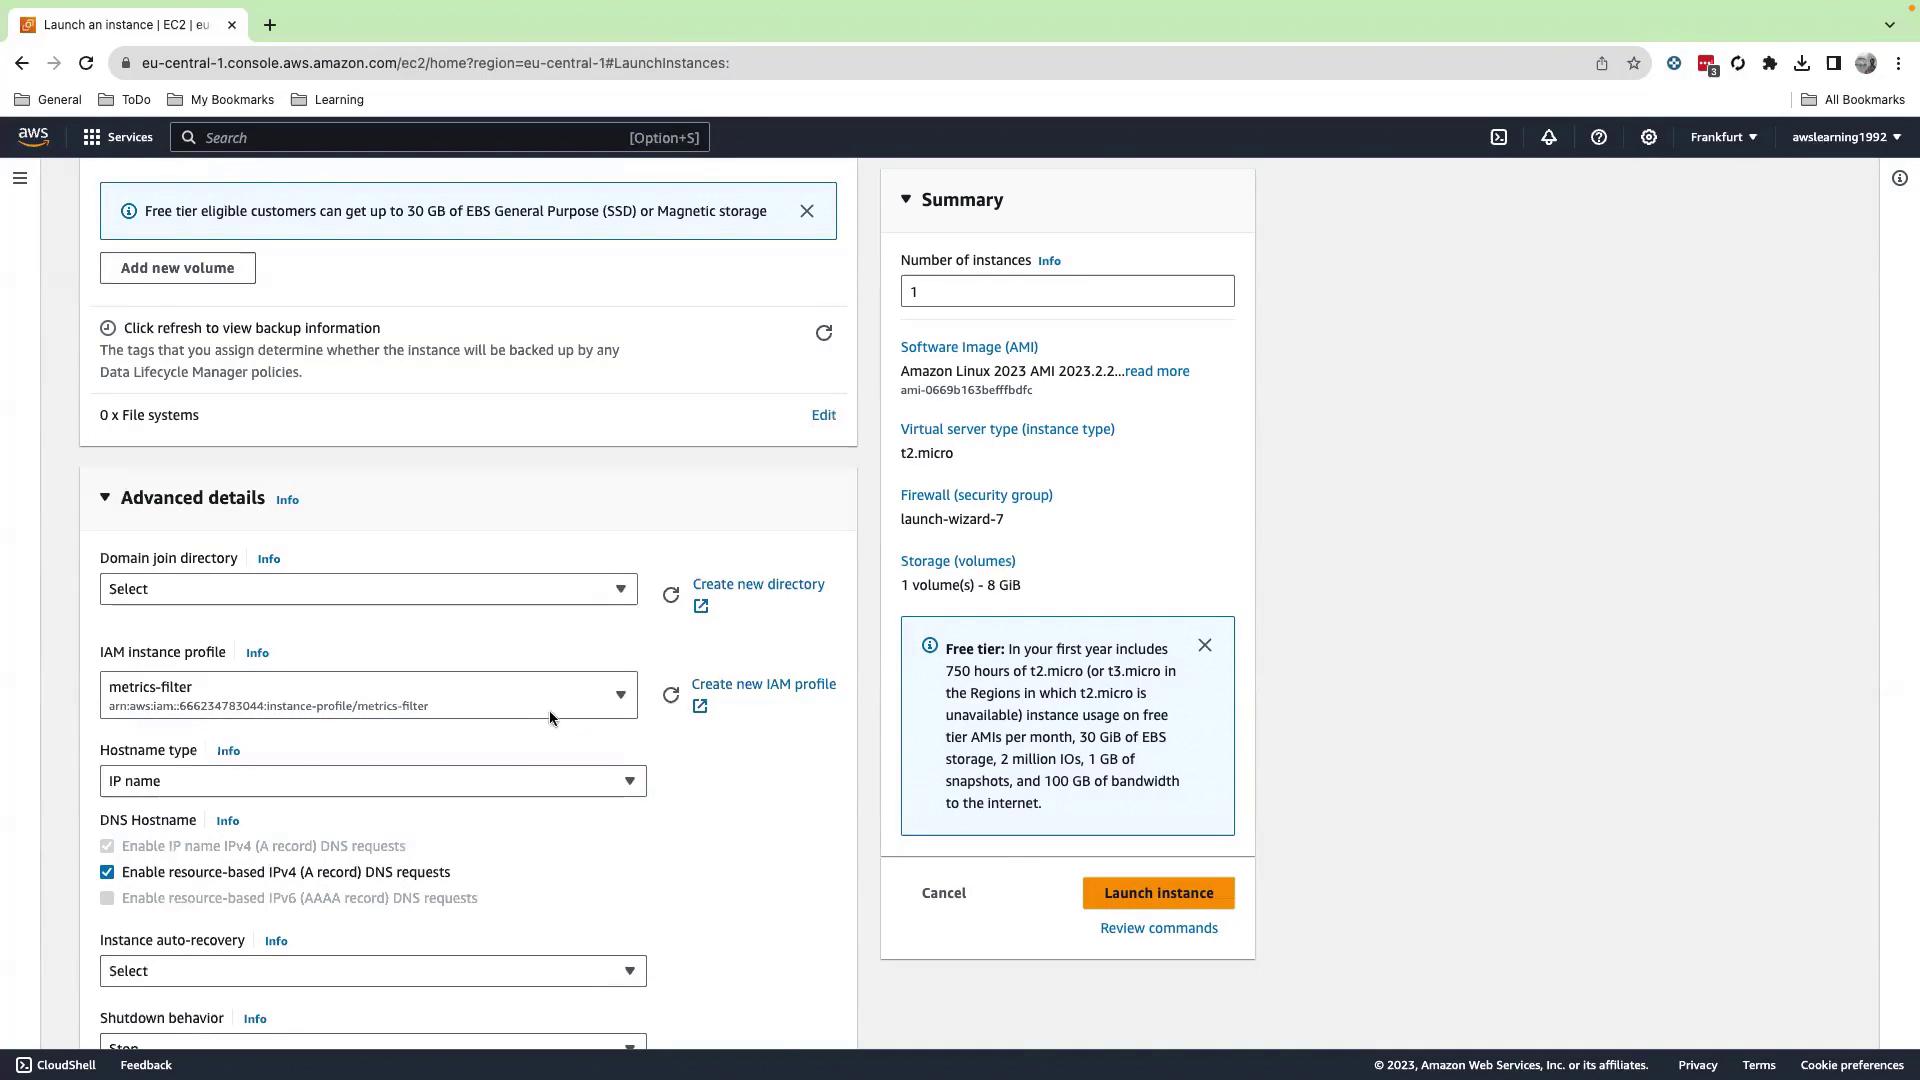
3. Under **Advanced details** > **IAM instance profile**, select `metric-filter-role`.
4. Scroll down and click **Launch instance**.
<Frame>
  ![The image shows the AWS EC2 console interface for launching an instance, with options for configuring instance details such as software image, instance type, and storage. The summary section highlights the free tier benefits.](https://kodekloud.com/kk-media/image/upload/v1752862452/notes-assets/images/AWS-CloudWatch-Demo-Metric-Filter/aws-ec2-console-launch-instance-summary.jpg)
</Frame>

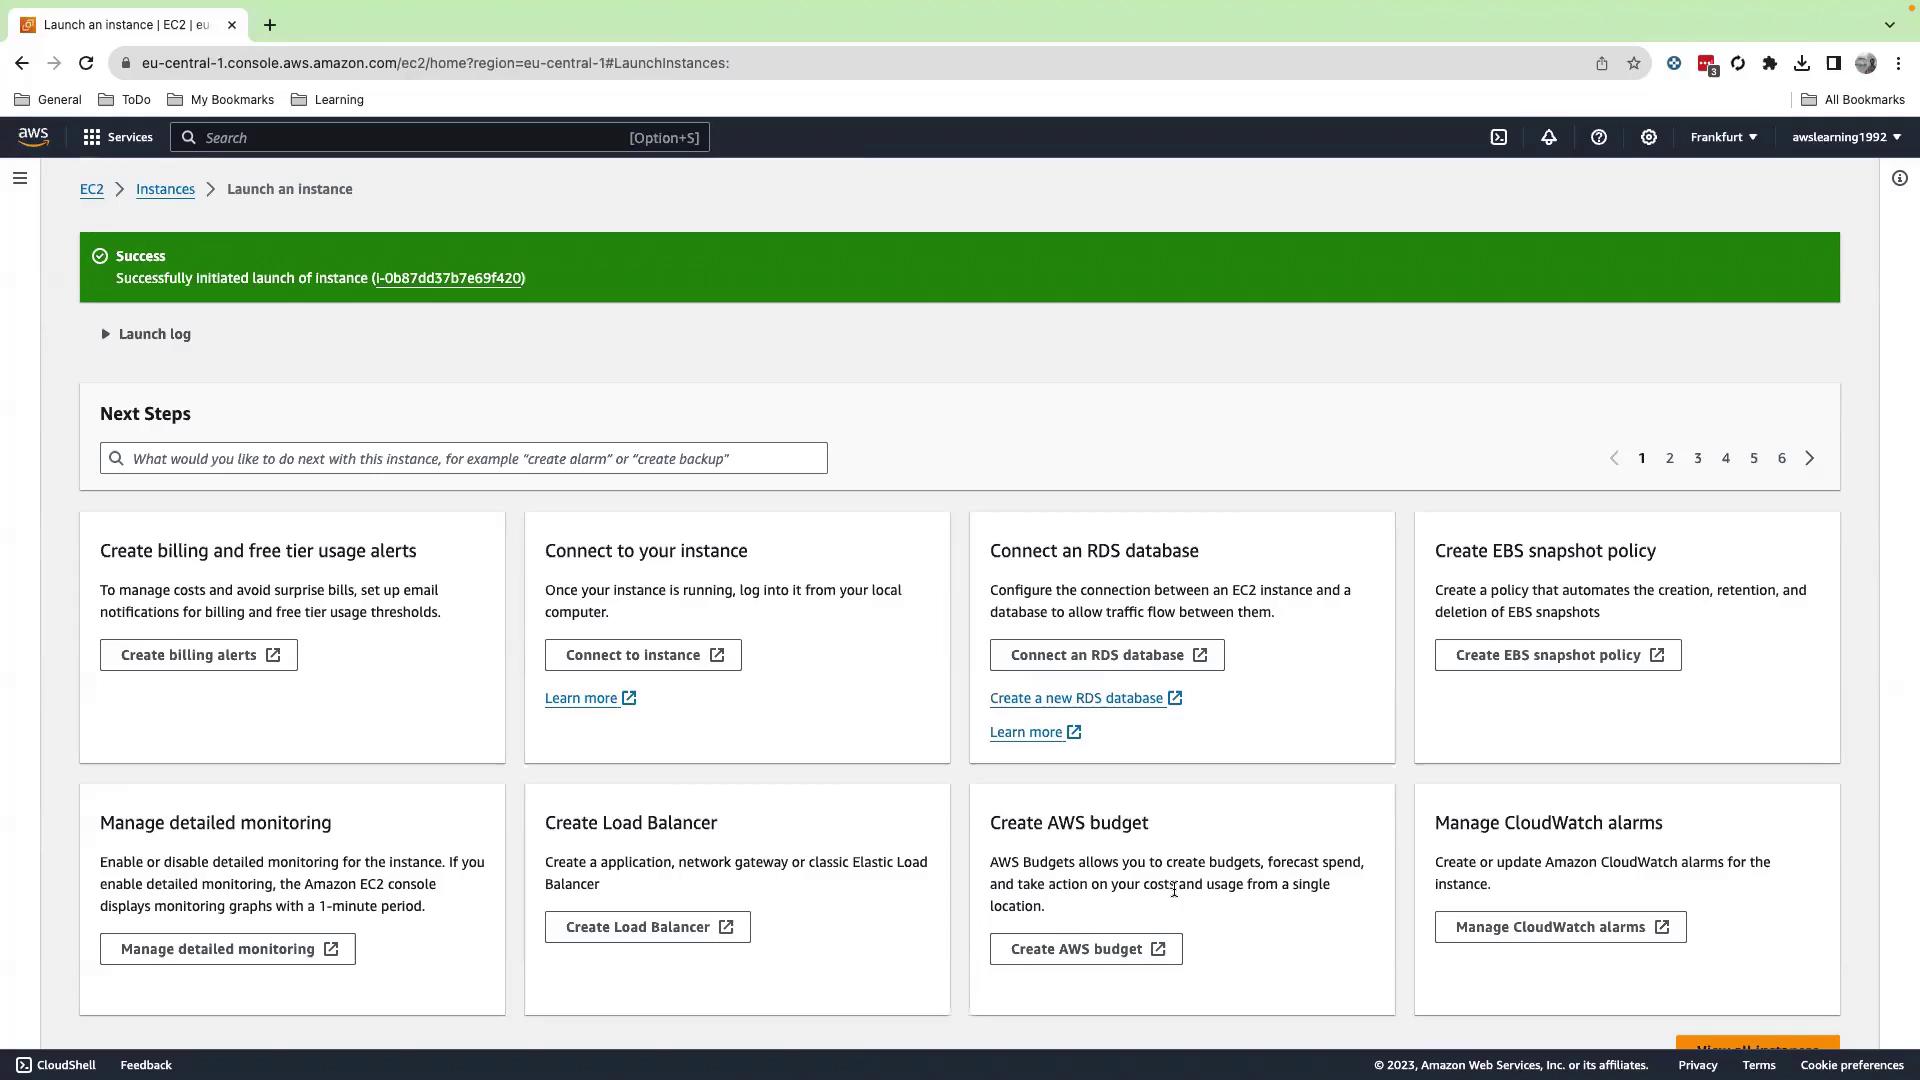
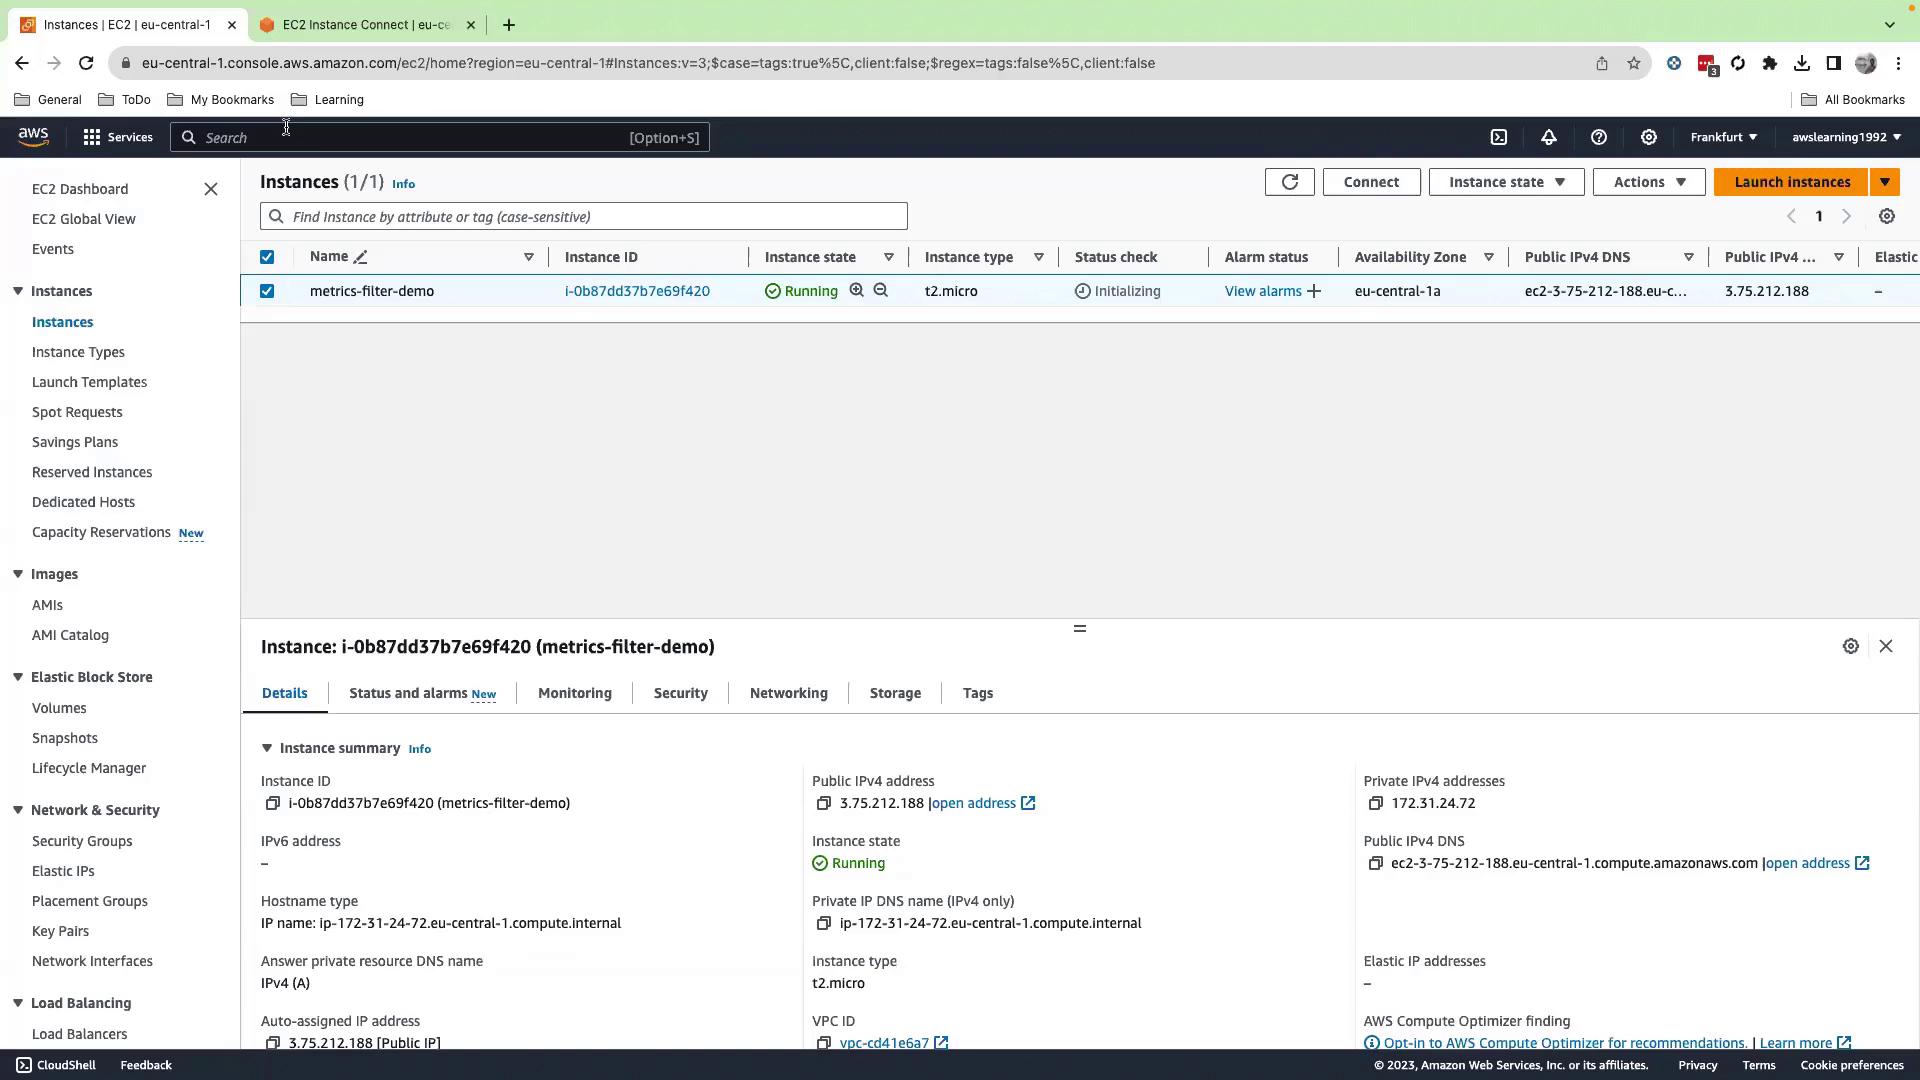
5. Verify the instance state is **running**.
<Frame>
  ![The image shows an AWS EC2 console screen indicating a successful instance launch, with options for next steps like creating billing alerts, connecting to the instance, and managing monitoring.](https://kodekloud.com/kk-media/image/upload/v1752862453/notes-assets/images/AWS-CloudWatch-Demo-Metric-Filter/aws-ec2-console-successful-instance-launch.jpg)
</Frame>

***

## 4. Generate Application Logs

SSH into your EC2 instance and switch to root:

```bash theme={null}
sudo su -
cd ~
```

Create a script that emits mock JSON HTTP logs:

```bash theme={null}
cat > generate_all.sh << 'EOF'
#!/bin/bash
echo '[' > events_all.json
for i in {1..50}; do
  ts=$(date +%s%3N)
  code=$(( (RANDOM % 5) * 100 + 200 ))
  printf '{"timestamp": %d, "message": "GET /endpoint HTTP/1.1\" %d"}' \
    "$ts" "$code" >> events_all.json
  [ $i -lt 50 ] && echo ',' >> events_all.json
done
echo ']' >> events_all.json
EOF
chmod +x generate_all.sh
```

Run the script and verify the output:

```bash theme={null}
./generate_all.sh
ls -l events_all.json
tail -n 5 events_all.json
```

***

## 5. Create a CloudWatch Logs Group & Stream

1. In the [CloudWatch console](https://console.aws.amazon.com/cloudwatch/), go to **Logs** > **Log groups** > **Create log group**.
   * **Name**: `application-404-error-tracker`
2. Select the new group and click **Create log stream**.
   * **Name**: `hostname`

Push your generated log events:

```bash theme={null}
aws logs put-log-events \
  --log-group-name application-404-error-tracker \
  --log-stream-name hostname \
  --log-events file://events_all.json
```

A successful response includes a `nextSequenceToken`. Confirm your logs appear under **Log streams**.
<Frame>
  ![The image shows an AWS EC2 management console with a running instance named "metrics-filter-demo" of type "t2.micro" in the "eu-central-1a" availability zone.](https://kodekloud.com/kk-media/image/upload/v1752862454/notes-assets/images/AWS-CloudWatch-Demo-Metric-Filter/aws-ec2-management-console-t2-micro.jpg)
</Frame>

***

## 6. Define a Metric Filter

1. In CloudWatch, open **Logs** > **Log groups**, select `application-404-error-tracker`, and click **Create metric filter**.
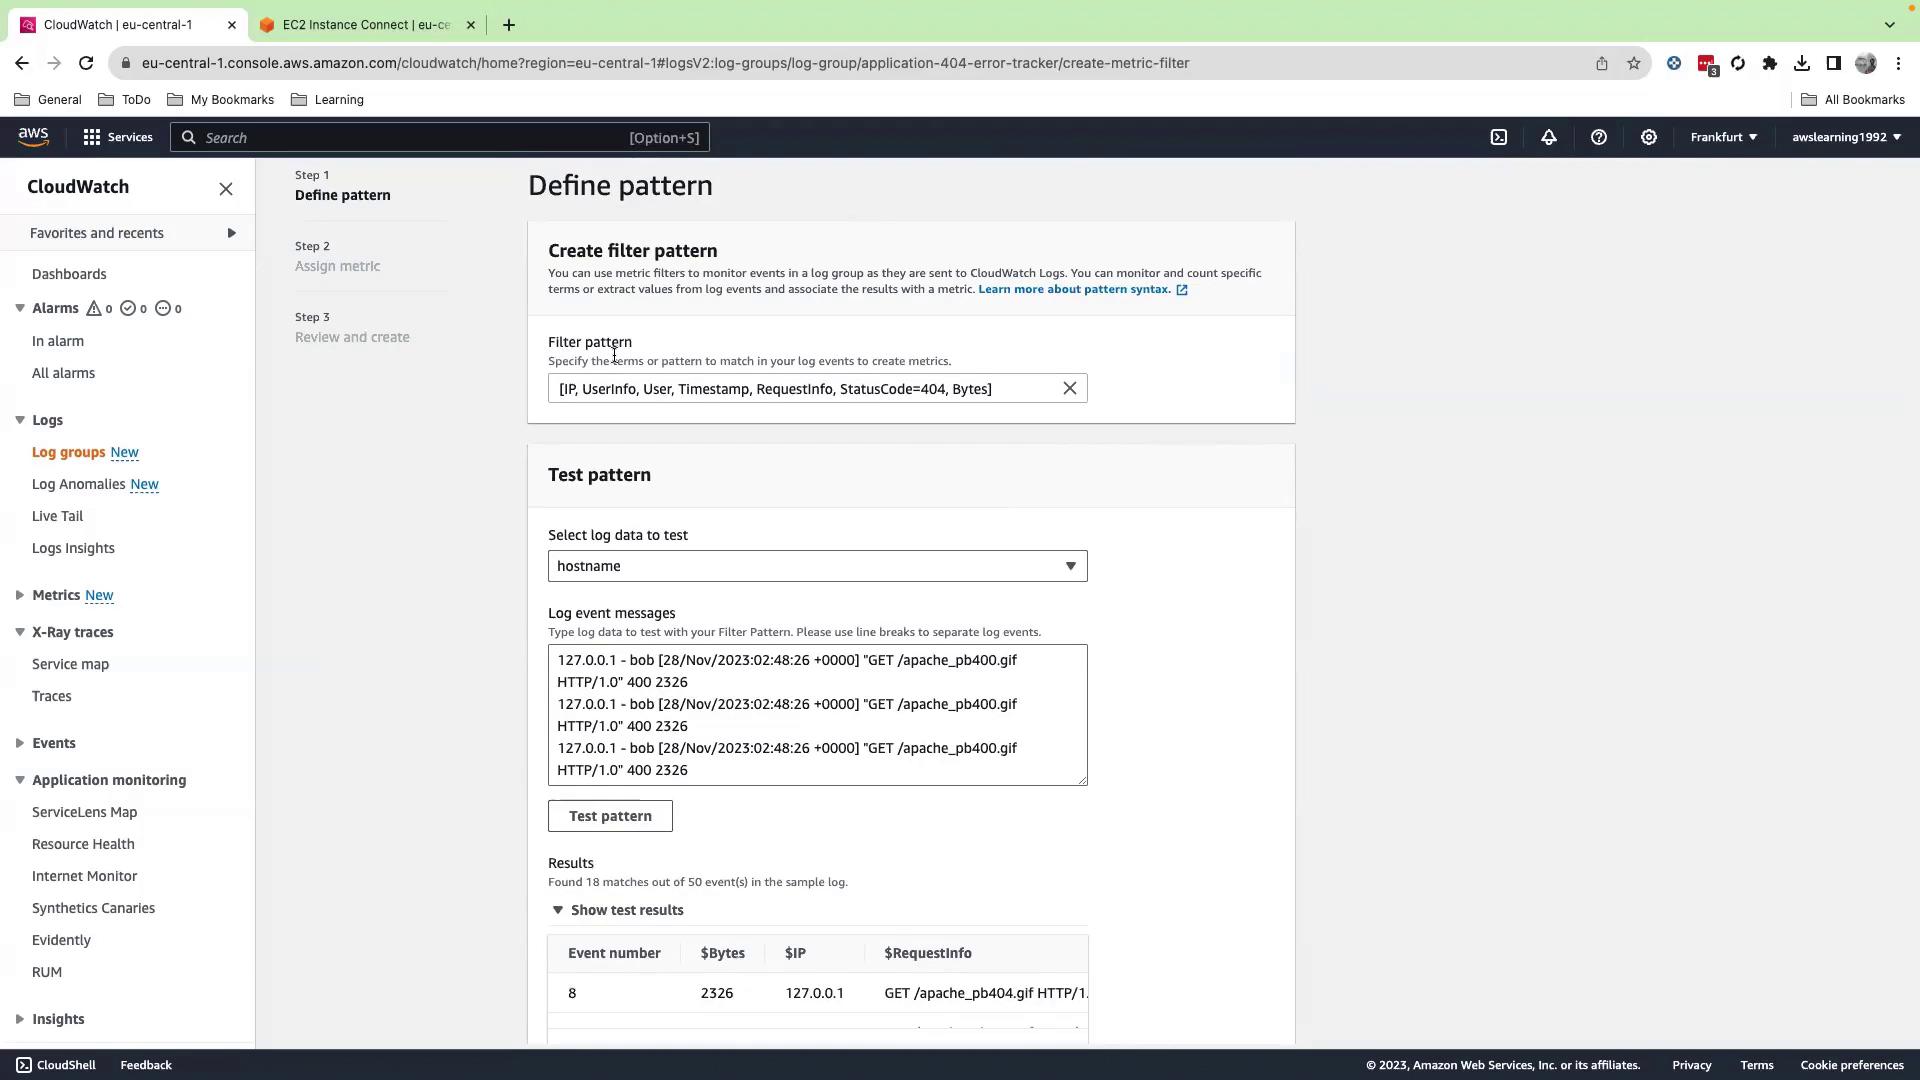
2. Enter this pattern to extract the HTTP status code:

```Python theme={null}
[_, _, _, _, status_code]
```

3. Test against the `hostname` stream to validate matches.
<Frame>
  ![The image shows an AWS CloudWatch interface where a filter pattern is being defined to monitor log events. It includes sections for creating a filter pattern, testing the pattern with log data, and displaying test results.](https://kodekloud.com/kk-media/image/upload/v1752862456/notes-assets/images/AWS-CloudWatch-Demo-Metric-Filter/aws-cloudwatch-filter-pattern-interface.jpg)
</Frame>

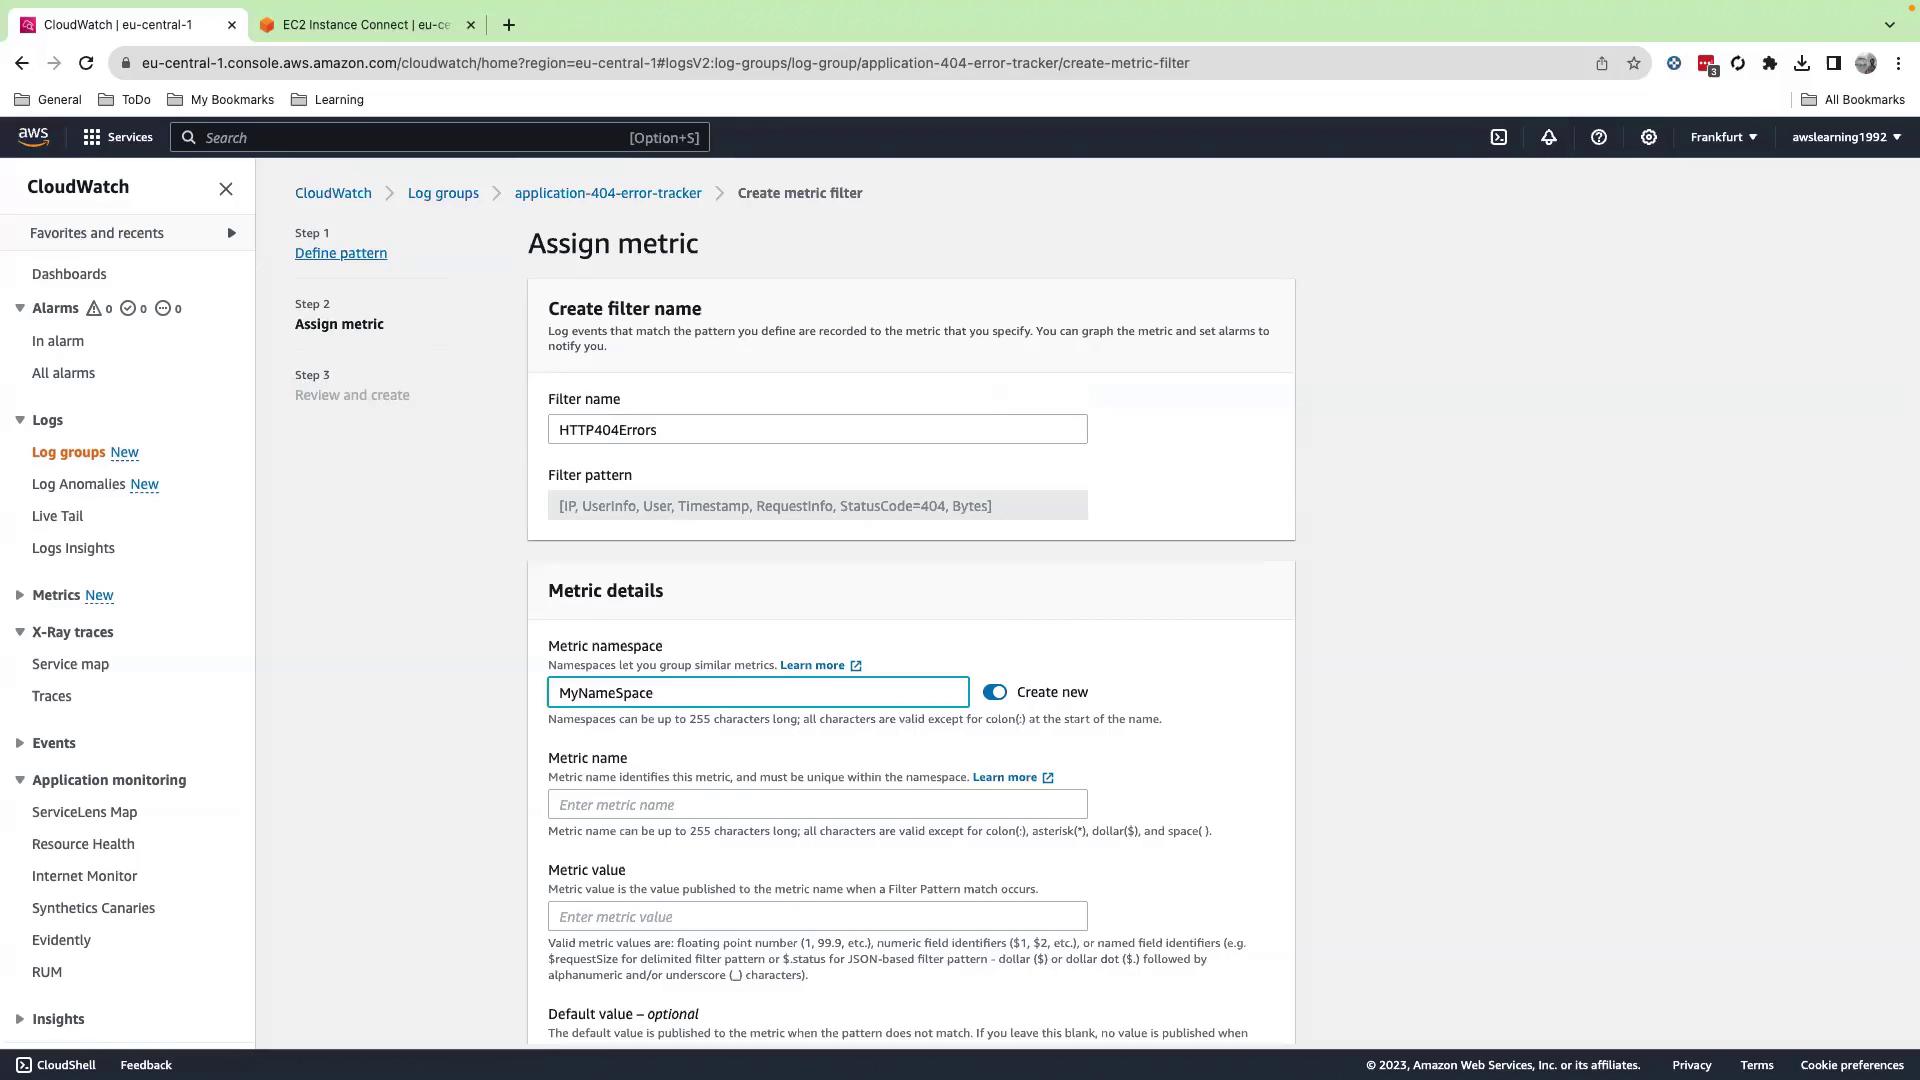
4. Click **Next** and configure the metric:

* **Filter name**: `HTTP404Filter`
* **Metric namespace**: `MyNamespace`
* **Metric name**: `ApacheNotFoundErrorCount`
* **Metric value**: `1`
* **Default value**: `0`
<Frame>
  ![The image shows an AWS CloudWatch interface where a user is assigning a metric for HTTP 404 errors, with fields for filter name, pattern, and metric details.](https://kodekloud.com/kk-media/image/upload/v1752862457/notes-assets/images/AWS-CloudWatch-Demo-Metric-Filter/aws-cloudwatch-http-404-metric.jpg)
</Frame>

<Frame>
  ![The image shows an AWS CloudWatch interface where a user is configuring metric details for log monitoring, including fields for metric namespace, name, and value.](https://kodekloud.com/kk-media/image/upload/v1752862459/notes-assets/images/AWS-CloudWatch-Demo-Metric-Filter/aws-cloudwatch-log-monitoring-metrics.jpg)
</Frame>

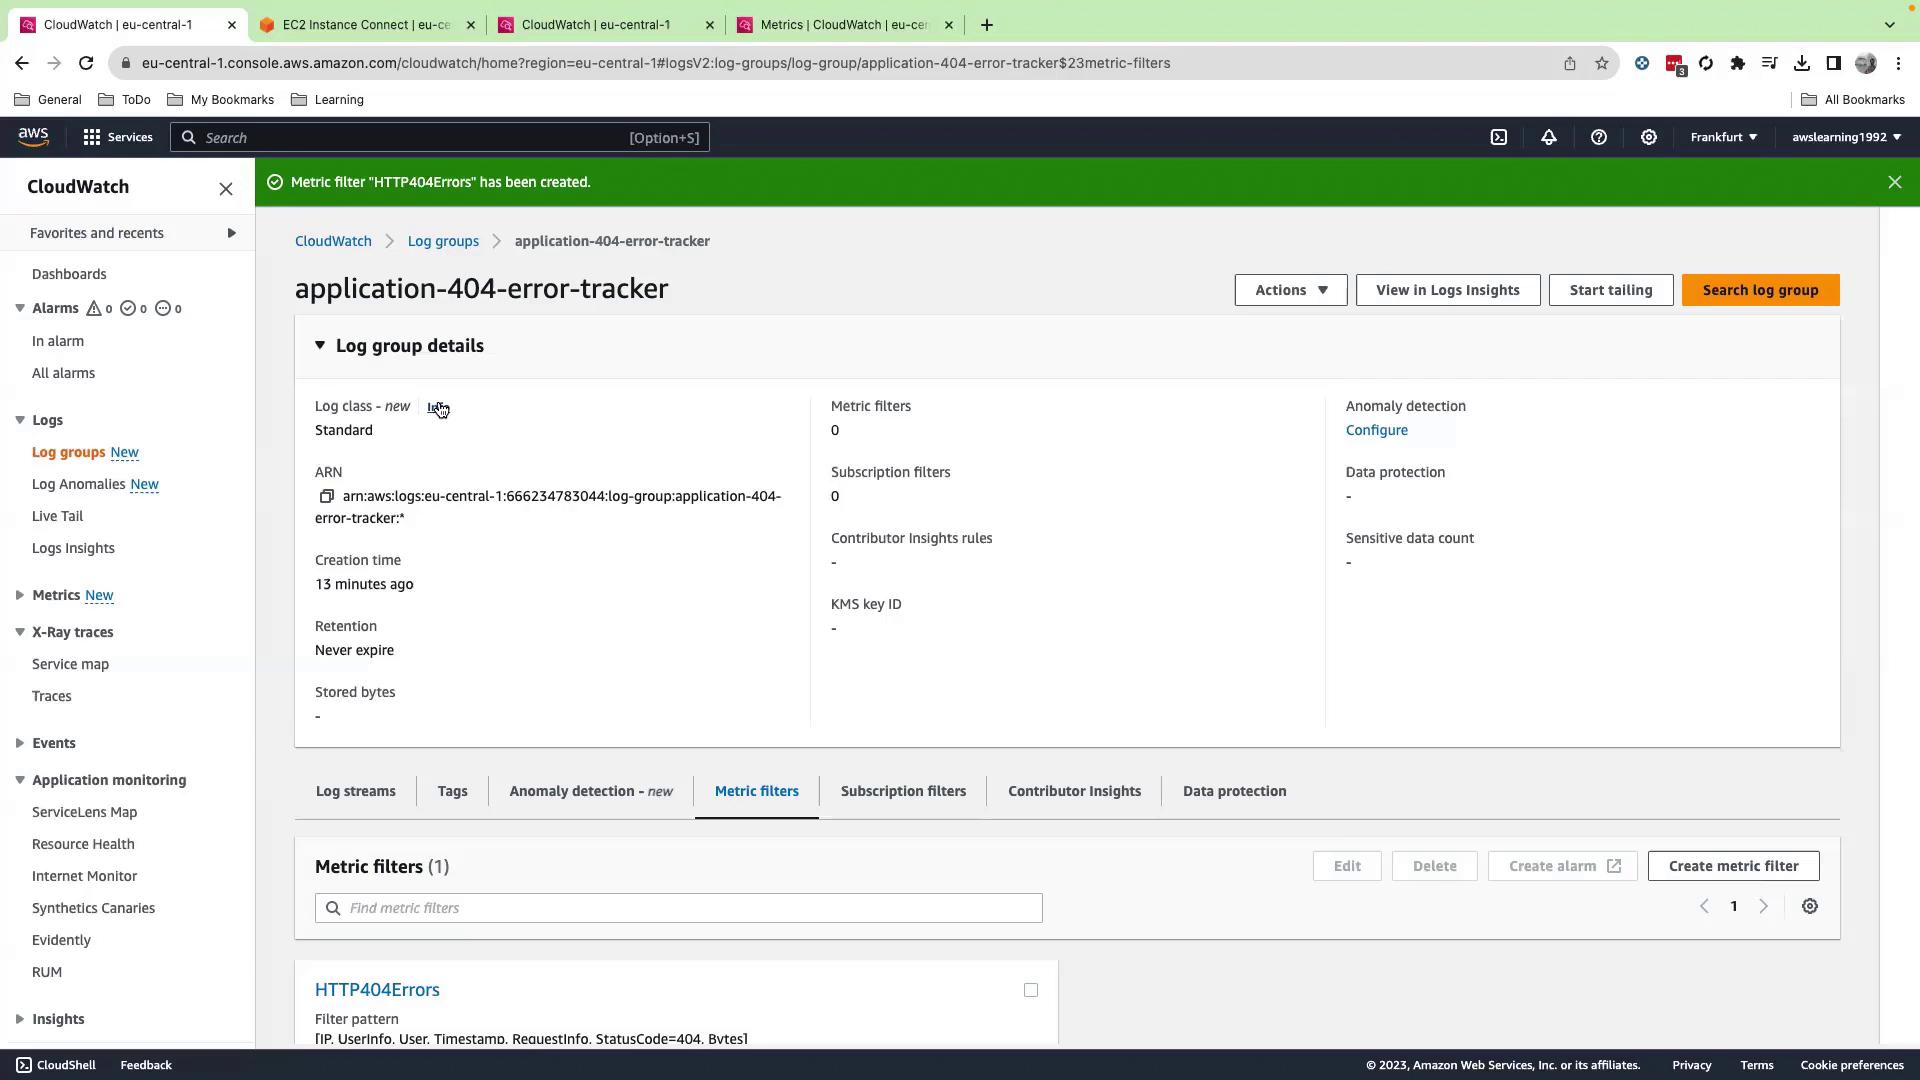
5. Review settings and click **Create metric filter**.
<Frame>
  ![The image shows an AWS CloudWatch interface displaying details of a log group named "application-404-error-tracker," including metrics and configuration options.](https://kodekloud.com/kk-media/image/upload/v1752862460/notes-assets/images/AWS-CloudWatch-Demo-Metric-Filter/aws-cloudwatch-log-group-application-404.jpg)
</Frame>

***

## 7. Push Additional Logs

<Callout icon="lightbulb" color="#1CB2FE">
  When sending subsequent log batches, include the `--sequence-token` you received from the previous `put-log-events` response.
</Callout>

```bash theme={null}
./generate_all.sh
aws logs put-log-events \
  --log-group-name application-404-error-tracker \
  --log-stream-name hostname \
  --log-events file://events_all.json
```

Wait a few minutes, then proceed to view your metric.

***

## 8. View Metric & Create an Alarm

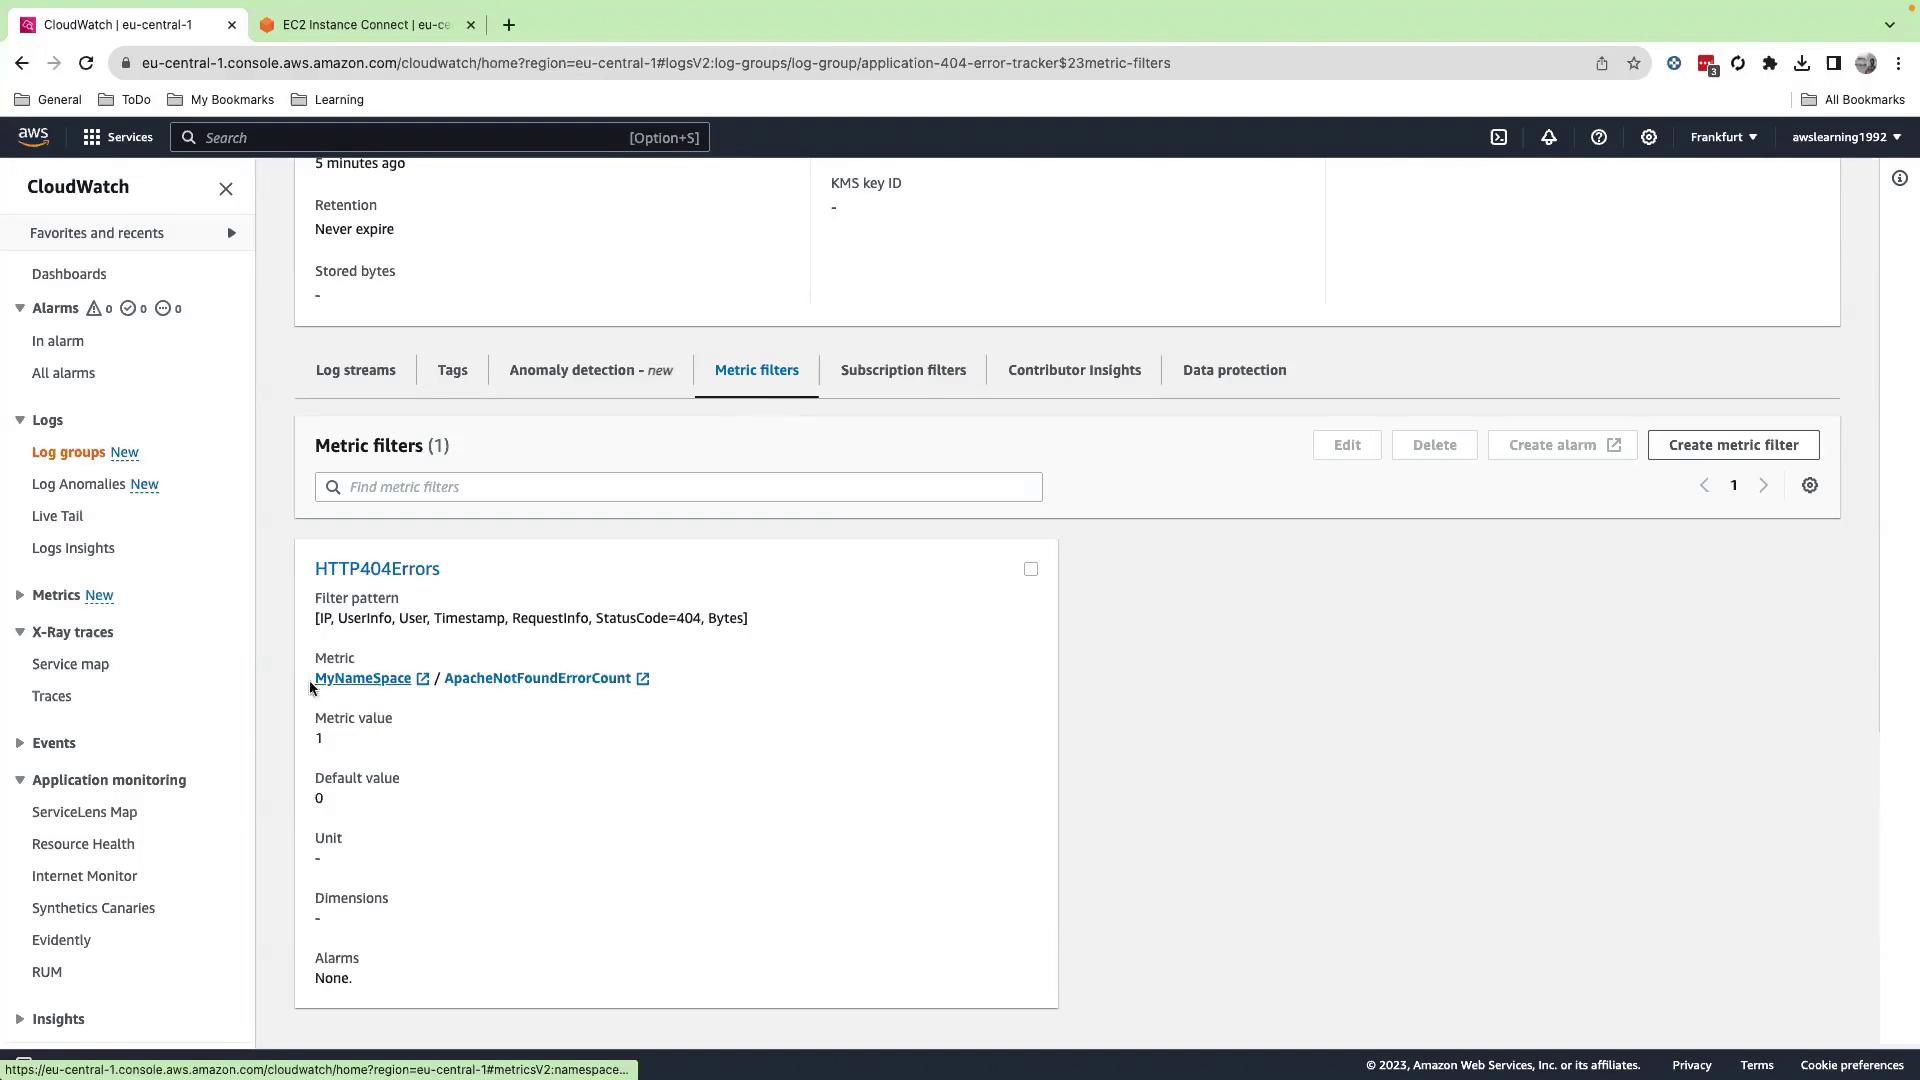
1. In CloudWatch, go to **Metrics** > **MyNamespace** > **ApacheNotFoundErrorCount**.
2. Select the metric and click **Create alarm**.
3. Set a threshold (for example, when > 1 events in 5 minutes) and configure a notification (SNS, email, etc.).
<Frame>
  ![The image shows an AWS CloudWatch interface displaying a metric filter for HTTP 404 errors, with details about the filter pattern and metric value.](https://kodekloud.com/kk-media/image/upload/v1752862461/notes-assets/images/AWS-CloudWatch-Demo-Metric-Filter/aws-cloudwatch-http-404-metric-filter.jpg)
</Frame>

<Frame>
  ![The image shows an AWS CloudWatch dashboard displaying a graph for the metric "ApacheNotFoundErrorCount" with no alarms set. The interface includes options for managing metrics and creating alarms.](https://kodekloud.com/kk-media/image/upload/v1752862462/notes-assets/images/AWS-CloudWatch-Demo-Metric-Filter/aws-cloudwatch-apachenotfounderrorcount-dashboard.jpg)
</Frame>

<Frame>
  ![The image shows an AWS CloudWatch configuration screen for setting an alarm based on the "ApacheNotFoundErrorCount" metric, with conditions for threshold settings.](https://kodekloud.com/kk-media/image/upload/v1752862463/notes-assets/images/AWS-CloudWatch-Demo-Metric-Filter/aws-cloudwatch-apachenotfounderrorcount-alarm.jpg)
</Frame>

***

## 9. Summary & Cleanup

You have successfully:

* Created a custom IAM policy and role for EC2 & CloudWatch Logs
* Launched an EC2 instance with the IAM role attached
* Generated and pushed application logs to CloudWatch Logs
* Defined a metric filter for HTTP 404 errors
* Viewed the metric and configured an alarm

**Cleanup:** Delete the log group, streams, alarms, EC2 instance, IAM role, and policy to avoid incurring charges.

| Resource           | Location                          | Action                   |
| ------------------ | --------------------------------- | ------------------------ |
| Log group & stream | CloudWatch → Logs                 | **Delete**               |
| Metric filter      | CloudWatch → Log groups → Metrics | **Remove**               |
| Alarm              | CloudWatch → Alarms               | **Delete**               |
| EC2 instance       | EC2 console                       | **Terminate instance**   |
| IAM role/policy    | IAM console                       | **Delete role & policy** |

***

## Links & References

* [AWS IAM Policies](https://docs.aws.amazon.com/IAM/latest/UserGuide/access_policies.html)
* [AWS CloudWatch Logs Documentation](https://docs.aws.amazon.com/AmazonCloudWatch/latest/logs/)
* [AWS CLI put-log-events](https://docs.aws.amazon.com/cli/latest/reference/logs/put-log-events.html)

<CardGroup>
  <Card title="Watch Video" icon="video" cta="Learn more" href="https://learn.kodekloud.com/user/courses/aws-cloudwatch/module/9fa50074-5184-4ea1-a0fb-233788bf9666/lesson/b0f951bf-874c-4e2b-97d6-b813385aacec" />
</CardGroup>
