> ## Documentation Index
> Fetch the complete documentation index at: https://notes.kodekloud.com/llms.txt
> Use this file to discover all available pages before exploring further.
# Cloudwatch Insights and X Ray
> Learn how Amazon CloudWatch Insights and AWS X-Ray work together for end-to-end monitoring and distributed tracing of modern applications.
In this lesson, you’ll learn how Amazon CloudWatch Insights and AWS X-Ray work together to deliver end-to-end monitoring and distributed tracing for modern applications. By combining detailed metrics, logs, and traces, you can detect issues faster, understand root causes, and automate responses.
***
## 1. CloudWatch Insights: Operational Visibility
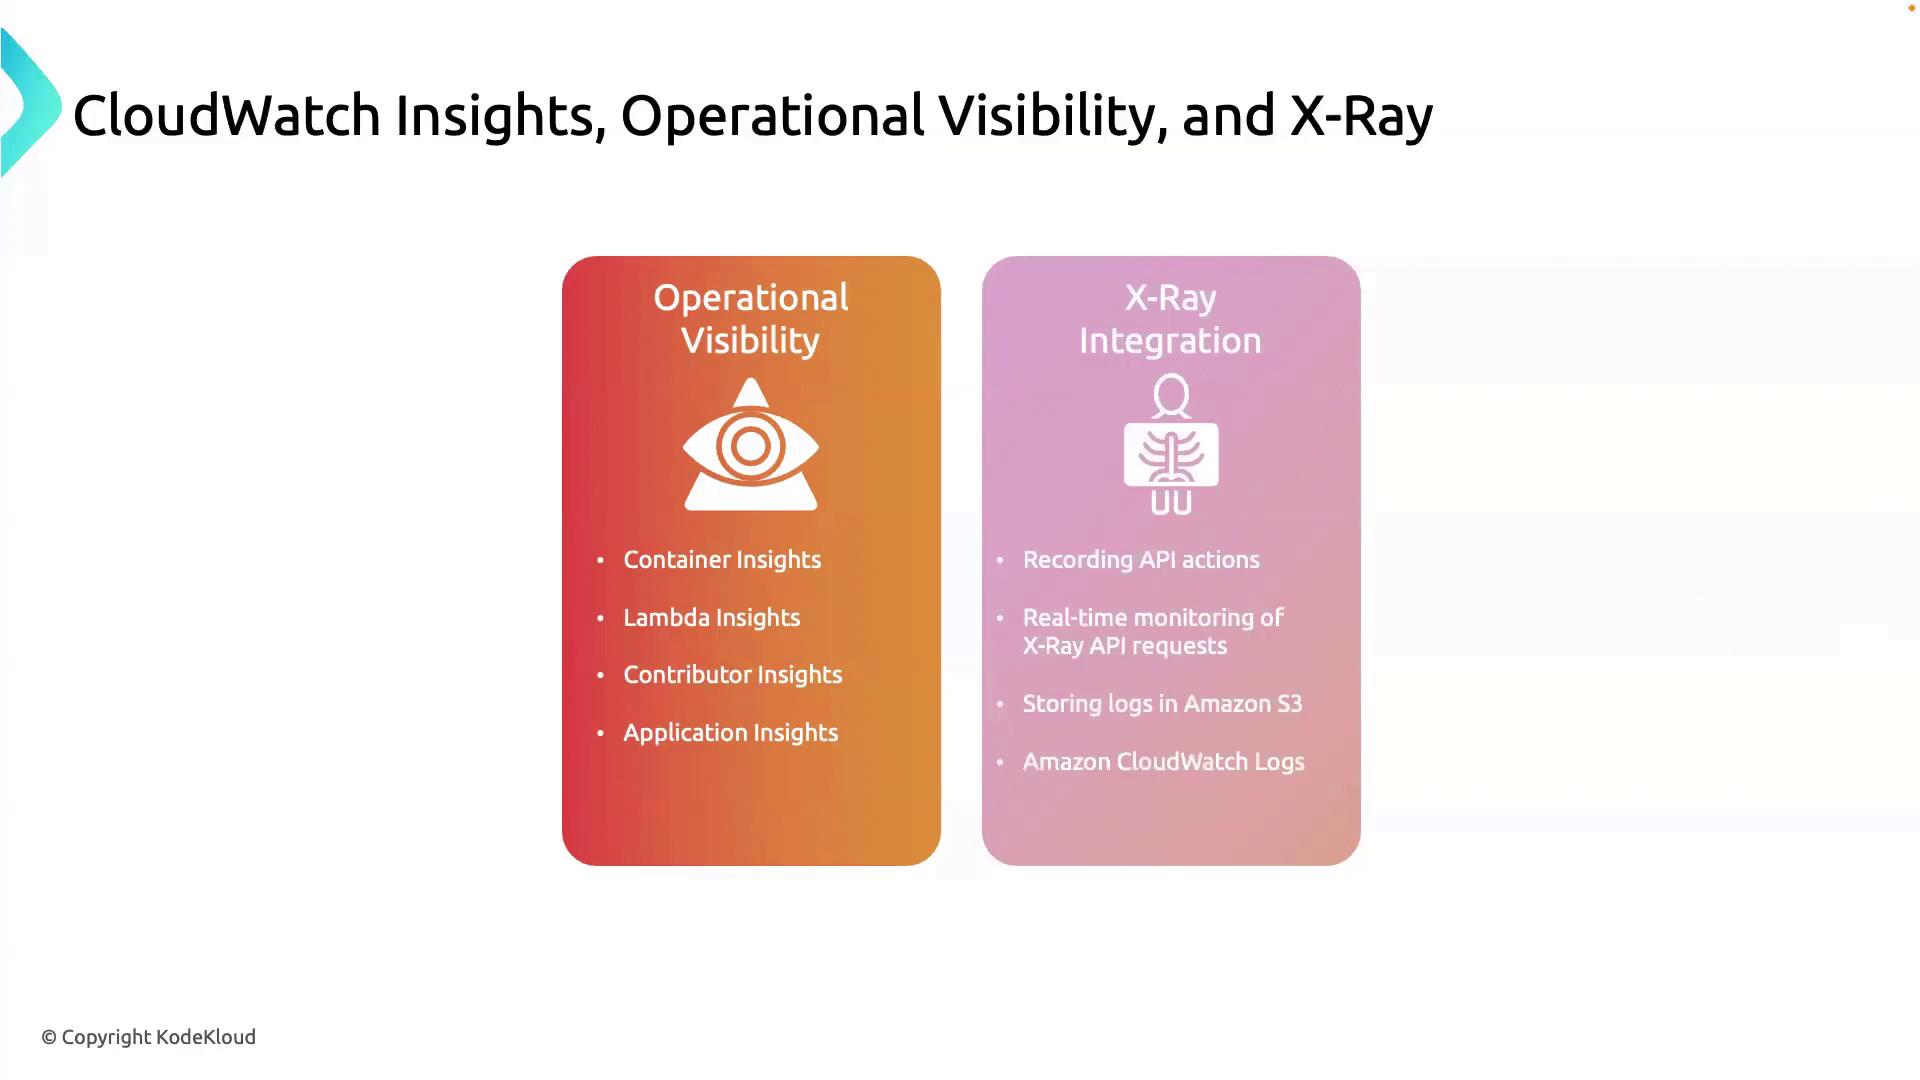
CloudWatch Insights provides granular visibility into your application stack. With built-in dashboards and customizable queries, you can quickly pinpoint performance bottlenecks.
| Feature | Description | Example CLI Command |
| -------------------- | -------------------------------------------------------------------------------- | -------------------------------------------------------------------------- |
| Container Insights | Monitor CPU, memory, and networking metrics for ECS, EKS, and Fargate workloads. | `aws cloudwatch get-metric-data --metric-data-queries file://queries.json` |
| Lambda Insights | Collect function-level metrics, logs, and duration histograms for AWS Lambda. | `aws lambda list-functions` |
| Contributor Insights | Identify top-N contributors to spikes in metrics like error rates or latency. | `aws cloudwatch describe-contributor-insights` |
| Application Insights | Automatically detect and visualize anomalies across metrics, logs, and events. | `aws opsworks describe-applications` |
Use CloudWatch Logs Insights queries to filter, aggregate, and visualize log data in seconds.\
For more details, see [CloudWatch Logs Insights](https://docs.aws.amazon.com/AmazonCloudWatch/latest/logs/Analytics.html).
***
## 2. AWS X-Ray: Distributed Tracing
AWS X-Ray captures detailed trace data to help you understand service interactions and latency across distributed architectures:
* **End-to-End Traces**: Follow a request as it travels through multiple services.
* **Service Map Visualization**: View a graph of service dependencies and latency.
* **Request Sampling**: Control the volume of traces collected to balance cost and visibility.
* **Storage in S3**: Archive and analyze trace data using tools like Athena or EMR.
Integrate X-Ray with CloudWatch Events to trigger automated alerts or Lambda functions when anomalies are detected.\
Learn more at [AWS X-Ray Developer Guide](https://docs.aws.amazon.com/xray/latest/devguide/aws-xray.html).
***
## 3. Integrating Insights & Tracing
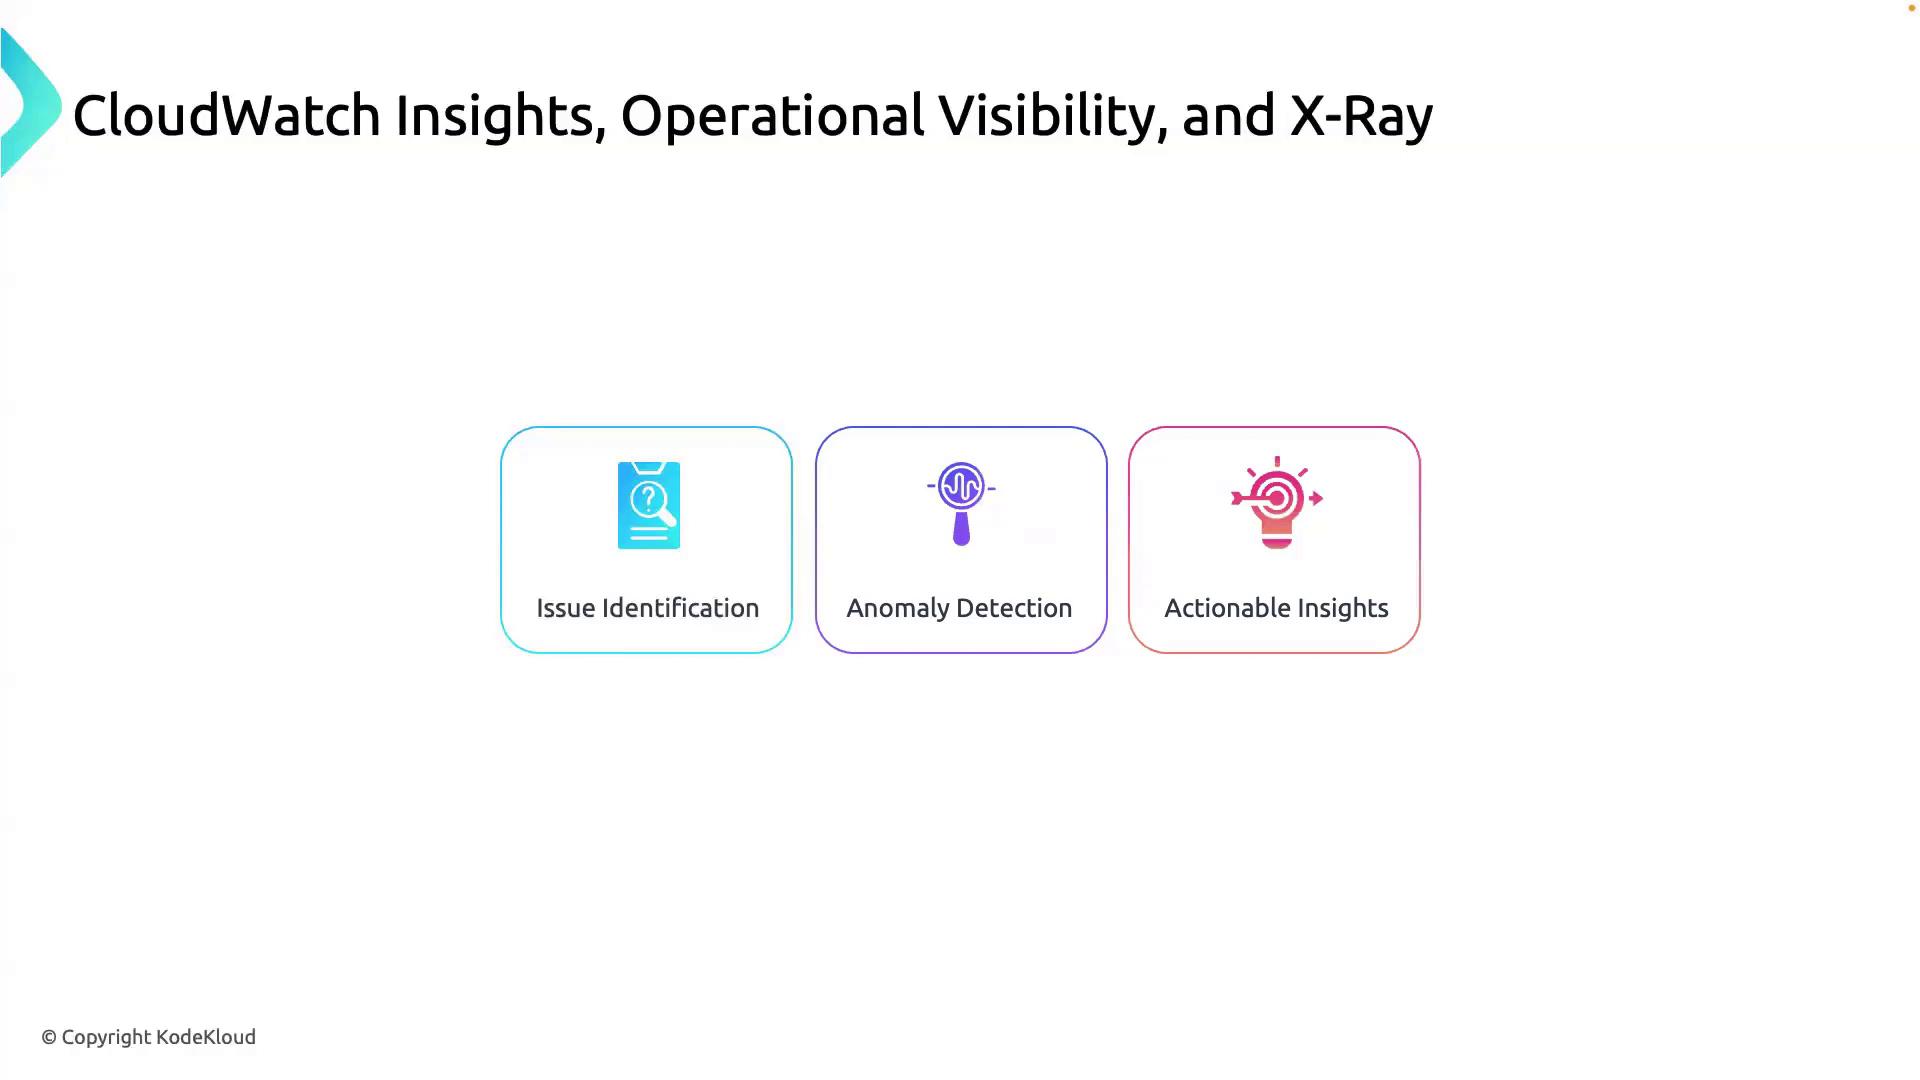
By correlating CloudWatch metrics and logs with X-Ray traces, you get a holistic observability solution:
1. **Issue Identification**
* Use CloudWatch Alarms to flag unusual metrics.
2. **Anomaly Detection**
* Drill down with Logs Insights queries and trace segments.
3. **Actionable Insights**
* Automate incident response with CloudWatch Events and Lambda.
Ensure that your services are instrumented correctly with the X-Ray SDK and that IAM roles grant permissions for both CloudWatch and X-Ray APIs. Failing to do so may result in incomplete trace data.
***
## 4. Proactive Issue Resolution
With combined observability:
* **Detect** anomalies before they affect end-users.
* **Trace** requests to their origin for root-cause analysis.
* **Respond** automatically using EventBridge rules and Lambda.
```bash theme={null}
# Start a CloudWatch Logs Insights query
aws logs start-query \
--log-group-names "/aws/lambda/my-function" \
--start-time $(date -v-1H +%s) \
--end-time $(date +%s) \
--query-string "fields @timestamp, @message | sort @timestamp desc | limit 20"
# Retrieve recent X-Ray traces
aws xray get-trace-summaries \
--start-time $(date -v-1H +%Y-%m-%dT%H:%M:%SZ) \
--end-time $(date +%Y-%m-%dT%H:%M:%SZ)
```
***
## Further Reading
* [Amazon CloudWatch Documentation](https://docs.aws.amazon.com/cloudwatch/index.html)
* [AWS X-Ray Developer Guide](https://docs.aws.amazon.com/xray/latest/devguide/)
* [Monitoring Best Practices](https://aws.amazon.com/architecture/well-architected/monitor/)