> ## Documentation Index
> Fetch the complete documentation index at: https://notes.kodekloud.com/llms.txt
> Use this file to discover all available pages before exploring further.
# Container InsightsLambda InsightsContributor InsightsApplication Insights
> This guide explores four AWS CloudWatch Insights tools to monitor, troubleshoot, and optimize applications under various workloads.
Welcome back! In this guide, we’ll explore four AWS CloudWatch Insights tools—Container Insights, Lambda Insights, Contributor Insights, and Application Insights—and show how they help you monitor, troubleshoot, and optimize your applications under any workload.
Use case scenario: Imagine preparing an e-commerce platform for Black Friday traffic. You need real-time visibility across containers, serverless functions, and microservices to ensure uptime and performance. Let’s dive in.
| Insight Type | Primary Use Case | Key Benefit |
| -------------------- | ------------------------------------------------------------ | ----------------------------------------- |
| Container Insights | Monitoring containerized applications (EKS, ECS, Kubernetes) | Unified metrics and logs for clusters |
| Lambda Insights | Observability for AWS Lambda functions | Spot function outliers and memory leaks |
| Contributor Insights | High-cardinality event analytics for microservices | Pinpoint source of errors and slowdowns |
| Application Insights | End-to-end web application monitoring | Auto-detect errors and performance issues |
***
## Container Insights
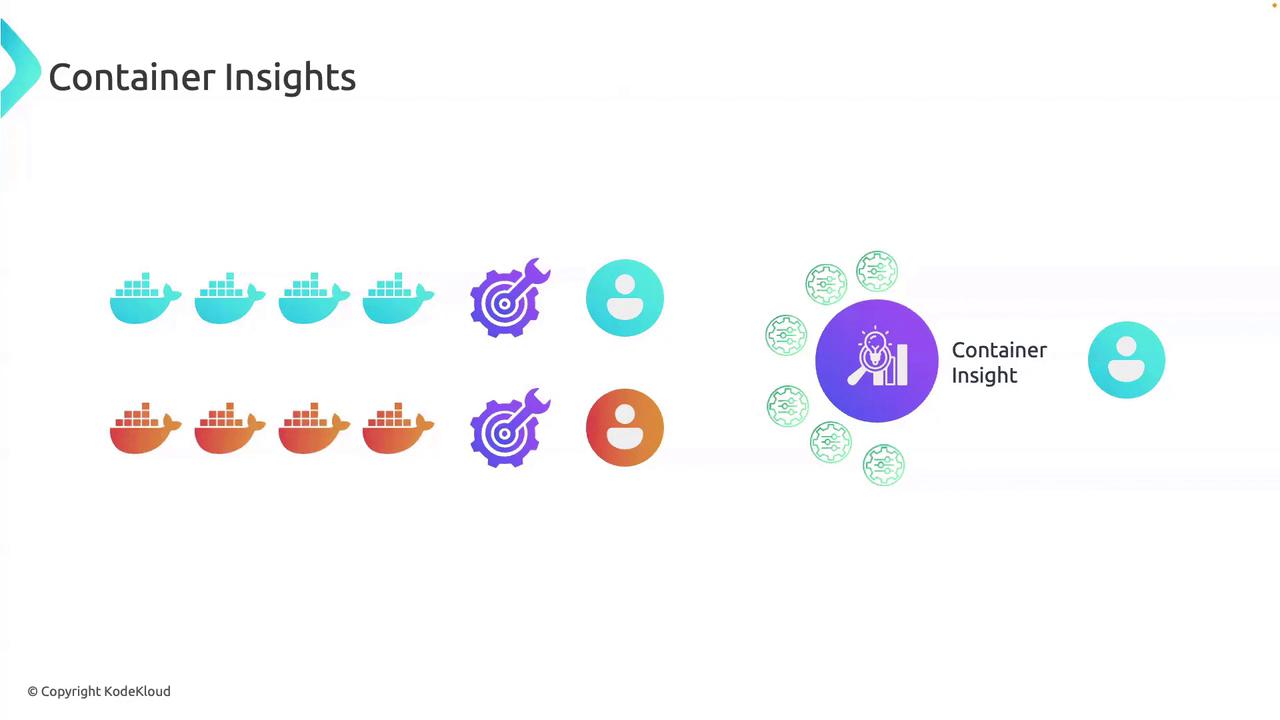
When running microservices in containers, you need a holistic view of CPU, memory, network, and logs—all in one dashboard. Container Insights collects, aggregates, and visualizes these metrics so you can take action before small issues become outages.
### Key Features
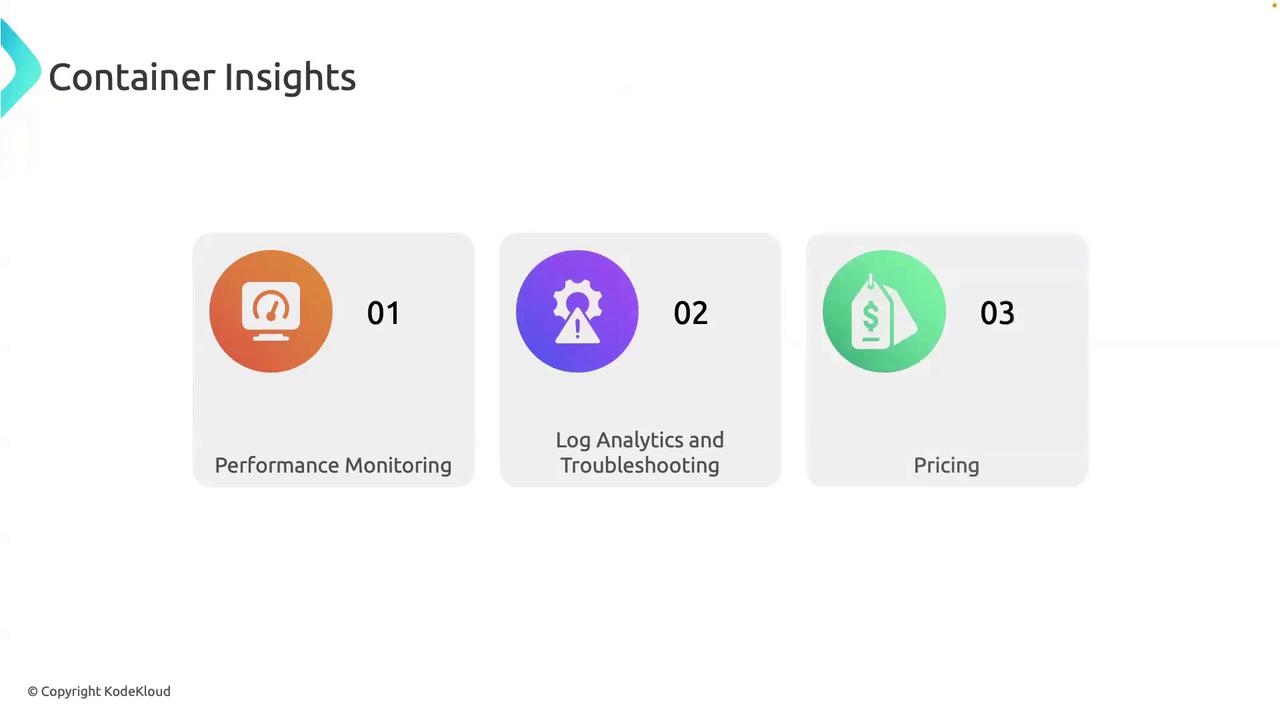
| Feature | Description |
| ------------------------------- | --------------------------------------------------------------------- |
| Performance Monitoring | Track CPU, memory, disk I/O, and network throughput in real time. |
| Log Analytics & Troubleshooting | Search, filter, and correlate container logs across clusters. |
| Auto-Scaling Integration | Trigger scaling policies based on custom metrics from your workloads. |
| Pay-As-You-Go Pricing | Only pay for the metrics and logs you collect; no upfront costs. |
You can enable Container Insights via the AWS Management Console, CLI, or CloudFormation in just a few clicks—no code changes required.
***
## Lambda Insights
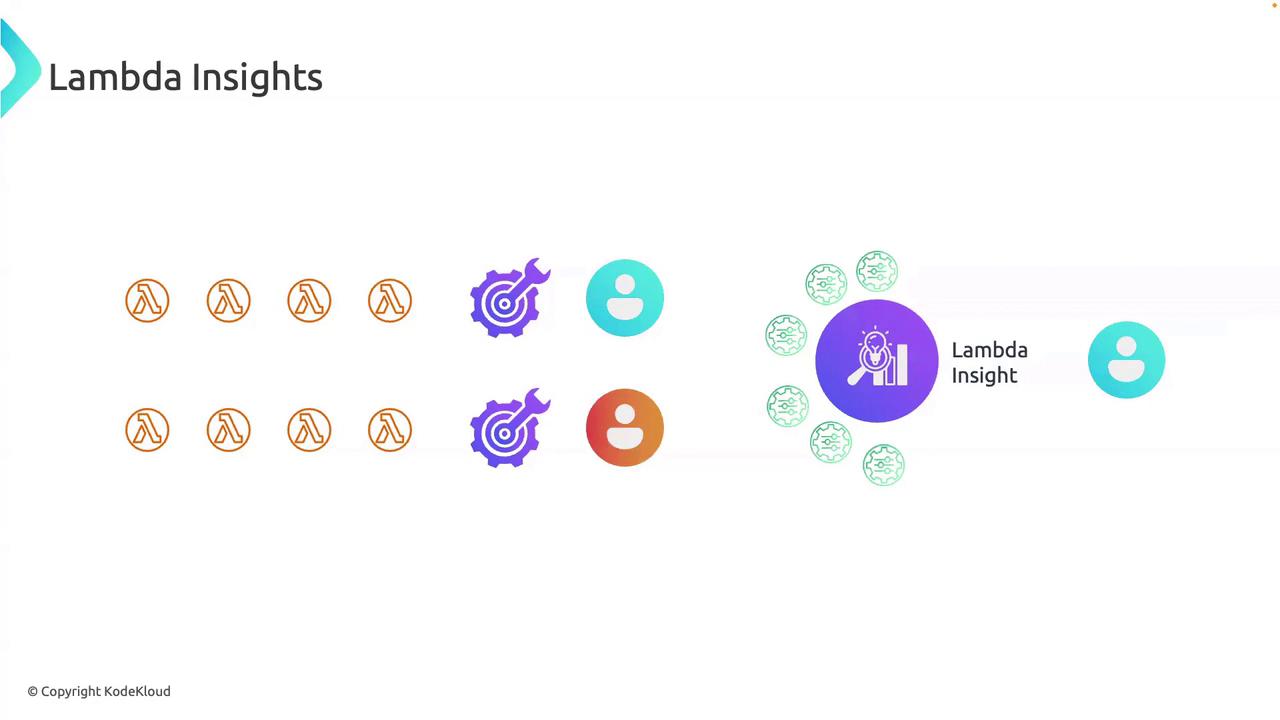
If your architecture relies on AWS Lambda for event-driven workloads (e.g., S3 triggers, EventBridge rules), Lambda Insights centralizes performance metrics and logs so you don’t have to investigate each function separately.
### Key Features
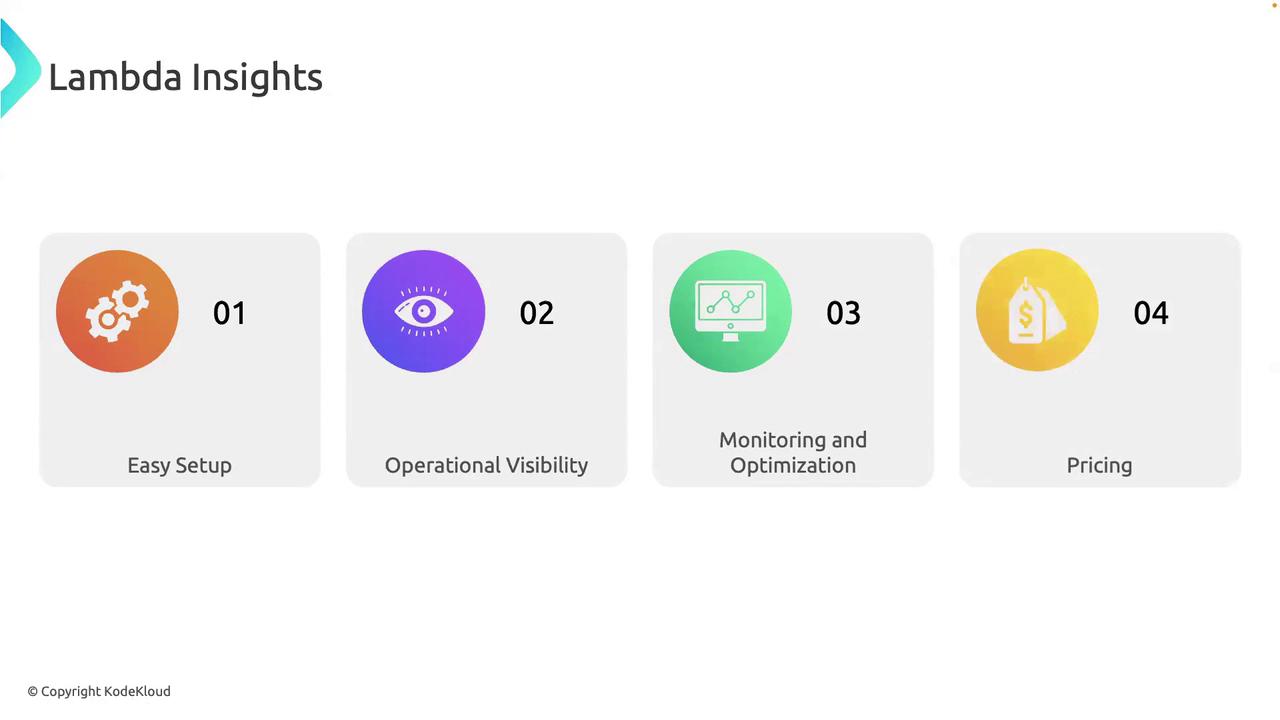
* Easy Setup: Enable instrumentation without modifying your existing code or deployment pipeline.
* Real-Time Metrics: Monitor execution duration, memory usage, cold starts, and concurrency.
* Bottleneck Detection: Quickly identify functions that exceed thresholds or show anomalous behavior.
* Cost Allocation: Break down Lambda charges by function to optimize spend.
Lambda Insights incurs a small additional cost per metric and log, but gives you actionable data to reduce overall Lambda spend.
***
## Contributor Insights
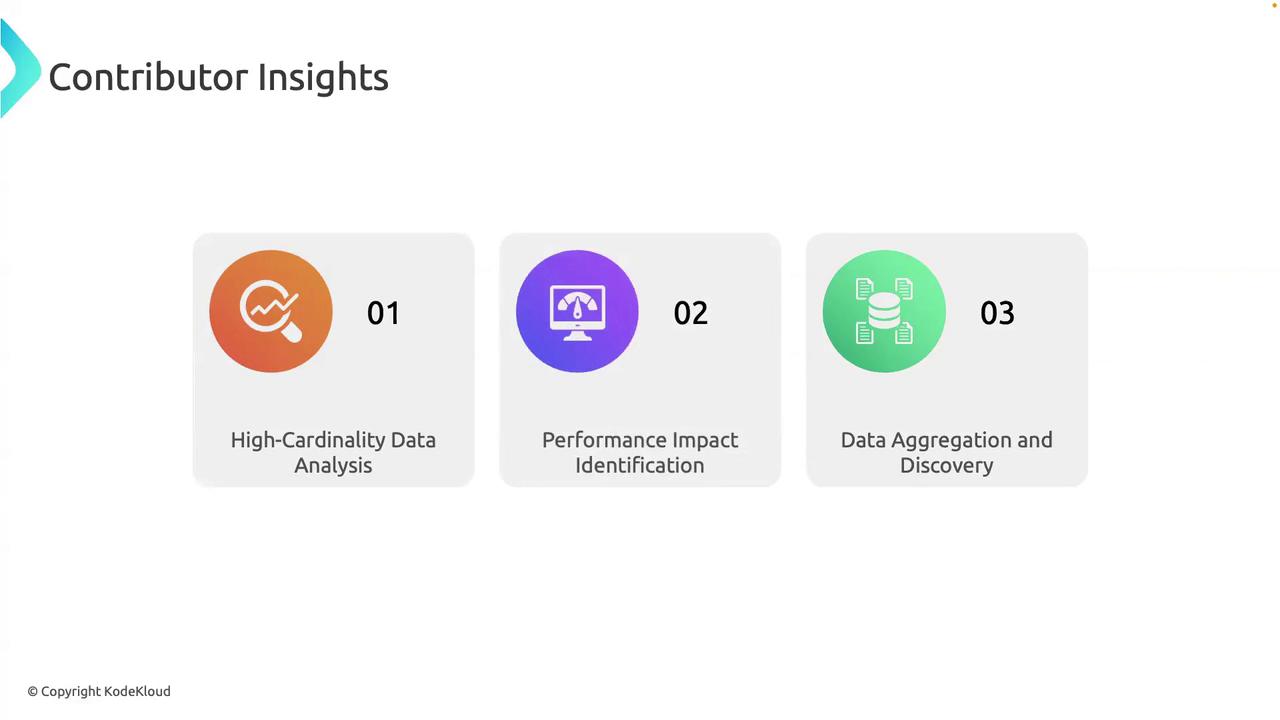
Contributor Insights provides real-time analytics on high-cardinality data (user IDs, API endpoints, order IDs) so you can pinpoint which component in your transaction pipeline is causing issues.
### Key Features
| Feature | Benefit |
| --------------------------------- | -------------------------------------------------------------------- |
| High-Cardinality Analysis | Drill into unique keys (e.g., user ID, session ID) to spot hotspots. |
| Performance Impact Identification | Correlate slow API calls or retries with downstream resource errors. |
| Trend Aggregation & Alerts | Aggregate events over time, set thresholds, and receive alerts. |
Contributor Insights shines as your microservice count grows. Use it proactively in production to detect anomalies early.
***
## Application Insights
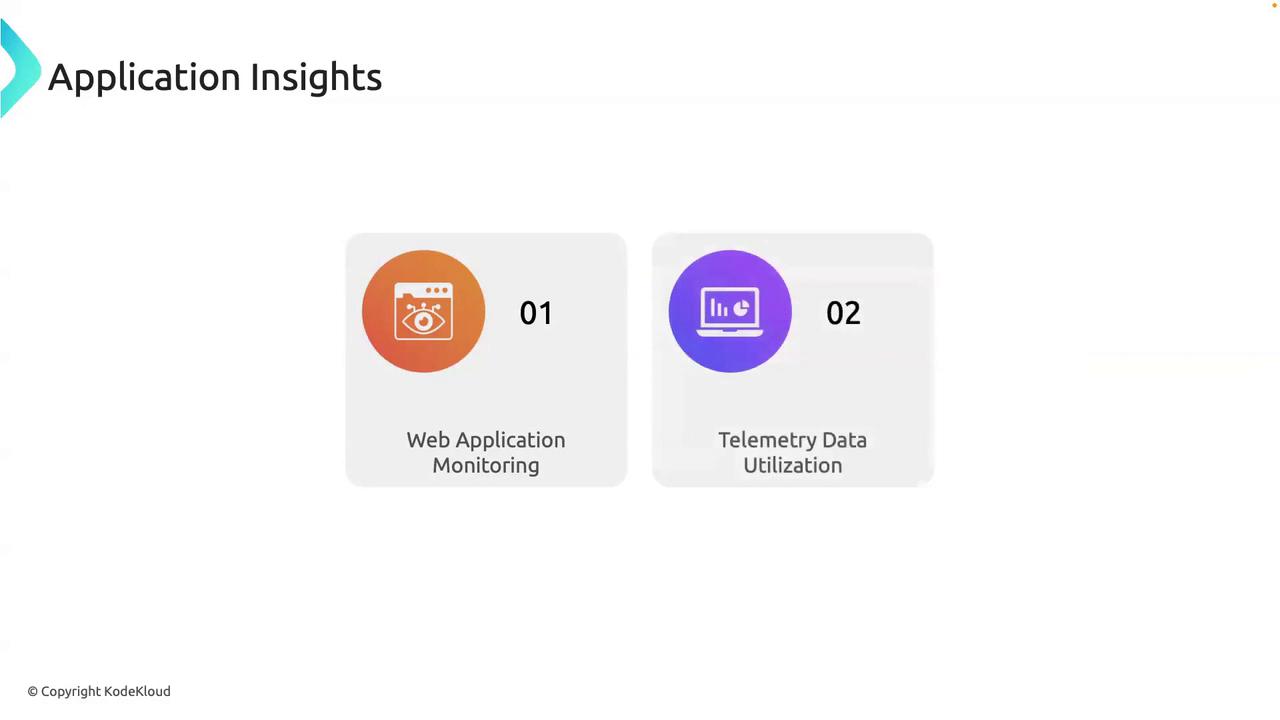
For full-stack web applications—like a live video streaming site—Application Insights offers automatic error detection, performance tracing, and dependency mapping to keep end users happy.
### Key Features
* Web Application Monitoring: Auto-discover exceptions, HTTP 5XX errors, and latency spikes.
* Dependency Mapping: Visualize calls to databases, caches, and external APIs.
* Telemetry Dashboard: Combine user, performance, and operational data in one view.
Application Insights adds overhead—enable it for mission-critical applications where user experience metrics are essential.
***
## Links and References
* AWS CloudWatch Container Insights
* AWS Lambda Insights
* AWS Contributor Insights
* AWS Application Insights
* [AWS CloudWatch Documentation](https://docs.aws.amazon.com/cloudwatch)