> ## Documentation Index
> Fetch the complete documentation index at: https://notes.kodekloud.com/llms.txt
> Use this file to discover all available pages before exploring further.
# Introduction to AWS CloudWatch Key Features
> Learn to build a centralized observability system in AWS using CloudWatch for alarms, notifications, logging, and maintaining application health.
Welcome! In this guide, you’ll learn how to build a centralized observability system in AWS using CloudWatch. You’ll see how to configure alarms, notifications, logging, and more—so you can maintain application health and swiftly diagnose issues.

## What Is AWS CloudWatch?
AWS CloudWatch is a unified monitoring service that collects metrics, logs, and events from your AWS resources, applications, and on-premises systems. It provides:
* **Full-stack visibility**: From infrastructure (EC2, Lambda) to application layers.
* **Centralized dashboarding**: Aggregate data in one place.
* **Automated actions**: Trigger alerts, runbooks, or remediation workflows.
CloudWatch integrates seamlessly with [AWS services](https://aws.amazon.com/products/management-and-governance/cloudwatch/) like EC2, RDS, Lambda, and EventBridge to give you holistic insight.
## Why Full-Stack Observability Matters
* **Early issue detection**: Catch anomalies before they impact users.
* **Faster troubleshooting**: Correlate logs, metrics, and traces in one console.
* **Cost optimization**: Identify underutilized resources.
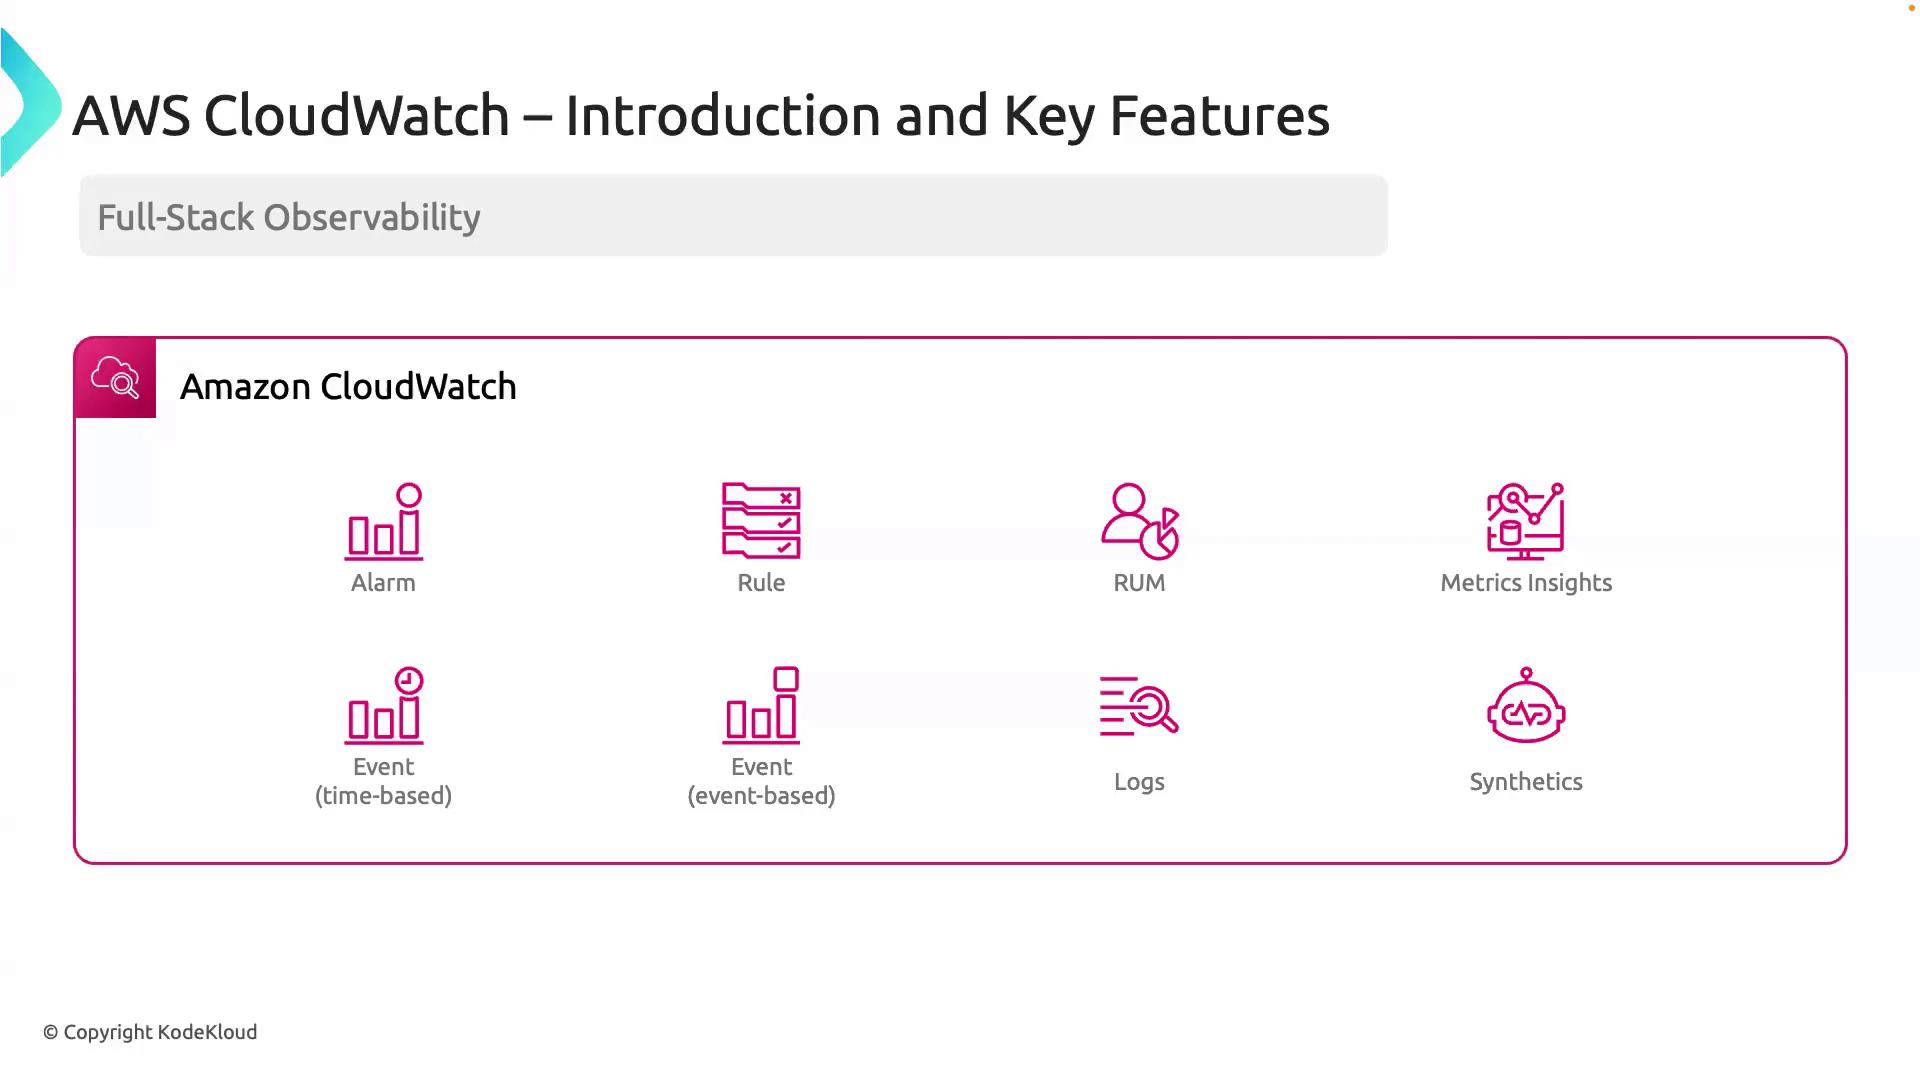
## AWS CloudWatch Feature Overview
| Feature | Description | Example Use Case |
| --------------------- | ------------------------------------------------------------- | ---------------------------------------------------------- |
| Alarms | Notify when metrics breach thresholds | Trigger an SNS notification if CPU > 80% for 5 minutes |
| Rules | Automate workflows based on event patterns | Run a Lambda function on EC2 state change |
| Real User Monitoring | Collect user session data to analyze performance and behavior | Track page load times for web customers |
| Metrics Insights | Perform SQL-like queries on metric data | Analyze trends across multiple dimensions |
| Events | Schedule or respond to infrastructure and application events | Schedule daily backups; react to Auto Scaling events |
| Logs | Ingest, store, and analyze log data | Create dashboards to track error rates in application logs |
| CloudWatch Synthetics | Run canaries to simulate user journeys and API checks | Verify endpoint availability every 5 minutes |
## Deep Dive: Key Features
### 1. Alarms
CloudWatch Alarms monitor metrics and send notifications when values cross thresholds. Use SNS, Lambda, or Auto Scaling actions for immediate response.
Example: Create an alarm for high CPU utilization
```bash theme={null}
aws cloudwatch put-metric-alarm \
--alarm-name HighCPU \
--metric-name CPUUtilization \
--namespace AWS/EC2 \
--statistic Average \
--period 300 \
--threshold 80 \
--comparison-operator GreaterThanThreshold \
--dimensions Name=InstanceId,Value=i-0123456789abcdef0 \
--evaluation-periods 2 \
--alarm-actions arn:aws:sns:us-east-1:123456789012:HighCPUAlert
```
### 2. Rules
CloudWatch Rules (EventBridge) let you define event patterns or schedules to trigger actions.
Example: Schedule a Lambda function at midnight
```bash theme={null}
aws events put-rule \
--name DailyJob \
--schedule-expression "cron(0 0 * * ? *)"
```
### 3. Real User Monitoring (RUM)
RUM captures actual user sessions in web applications to reveal performance bottlenecks and user behavior patterns.
Monitor RUM data ingestion and retention settings to control costs—especially for high-traffic applications.
### 4. Metrics Insights
Run advanced, ad-hoc queries on your metrics with a SQL-like language. This helps you spot trends and correlations across large datasets.
### 5. Events
CloudWatch supports:
* **Time-based events** (scheduled tasks)
* **Event-driven triggers** (e.g., EC2 state changes, CodePipeline transitions)
### 6. Logs
Centralize application and system logs. Use filters to extract meaningful patterns, set metric filters, and attach alarms.
Example: Create a metric filter for ERROR logs
```bash theme={null}
aws logs put-metric-filter \
--log-group-name /aws/my-app \
--filter-name ErrorFilter \
--filter-pattern "ERROR" \
--metric-transformations \
metricName=ErrorCount,metricNamespace=MyApp,metricValue=1
```
### 7. CloudWatch Synthetics
Create canaries—scripts that run on a schedule to simulate user workflows, ping APIs, and validate endpoints.
Example: Define a canary in YAML
```yaml theme={null}
Name: MyCanary
Schedule:
Expression: rate(5 minutes)
Source:
Handler: index.handler
Script: |
const synthetics = require('Synthetics');
// your canary script here
RuntimeVersion: syn-nodejs-puppeteer-3.4
```
## Next Steps
In the following lessons, we'll walk through hands-on examples:
* Deploying alarms and dashboards via Terraform
* Querying Metrics Insights for capacity planning
* Automating log analysis with Lambda
## References and Further Reading
* [AWS CloudWatch Documentation](https://docs.aws.amazon.com/cloudwatch/)
* [Amazon EventBridge (CloudWatch Events)](https://docs.aws.amazon.com/eventbridge/)
* [AWS CloudWatch Synthetics](https://docs.aws.amazon.com/AmazonCloudWatch/latest/monitoring/CloudWatch_Synthetics.html)