> ## Documentation Index
> Fetch the complete documentation index at: https://notes.kodekloud.com/llms.txt
> Use this file to discover all available pages before exploring further.
# What is observability
> This article explores observability in AWS CloudWatch, detailing its importance for system health, performance, and root-cause analysis.
In this lesson, we’ll explore how AWS CloudWatch empowers you with observability—your window into system health, performance, and root-cause analysis. But first, **what is observability?**
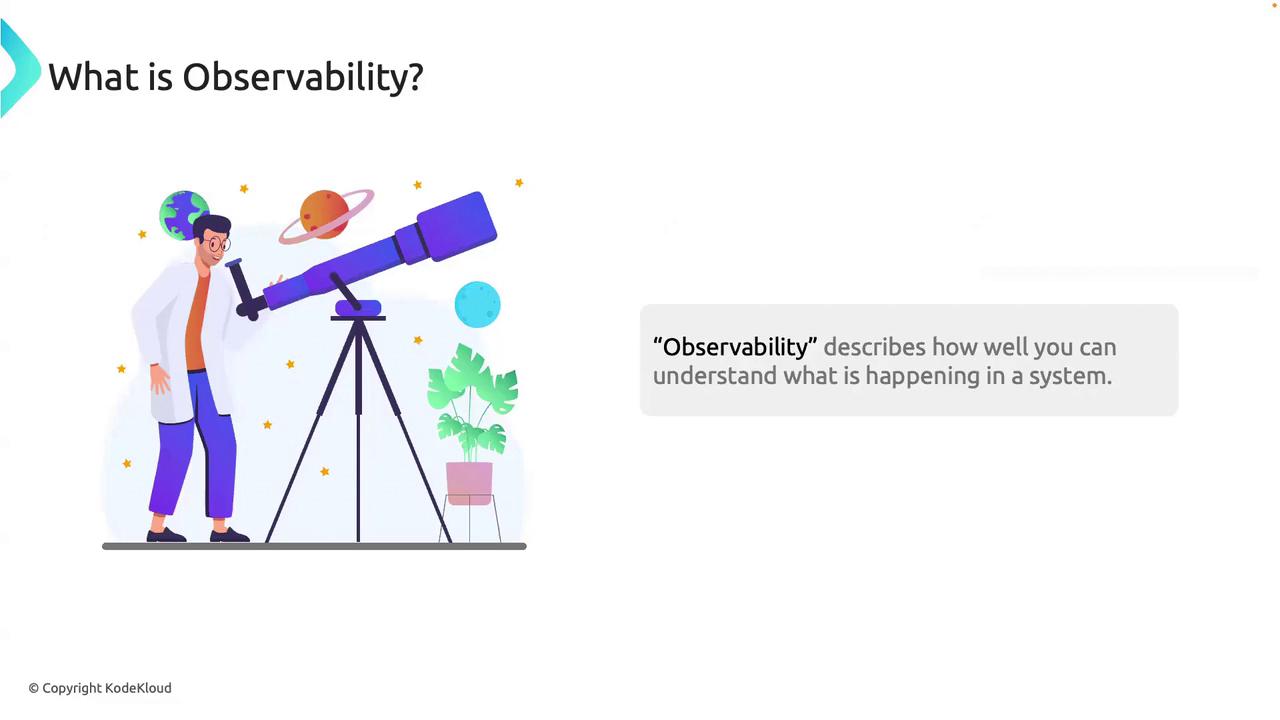
Observability is the ability to understand the internal state of a system by analyzing its external outputs. It goes beyond raw data collection—observability turns metrics, logs, and traces into actionable insights.
Imagine an alert at 2 AM telling you, “Your application is responding slowly.” Is the service down? Which component is the bottleneck? Could you detect the issue sooner? With a mature observability practice, you consult targeted dashboards, review critical metrics, drill into relevant logs, and follow request traces to identify, for example, a slow database query. You mitigate immediately and schedule a permanent fix during working hours—no all-hands wake‐up call for the database team.
Observability tools let you ask precise questions of your system—and get precise answers.
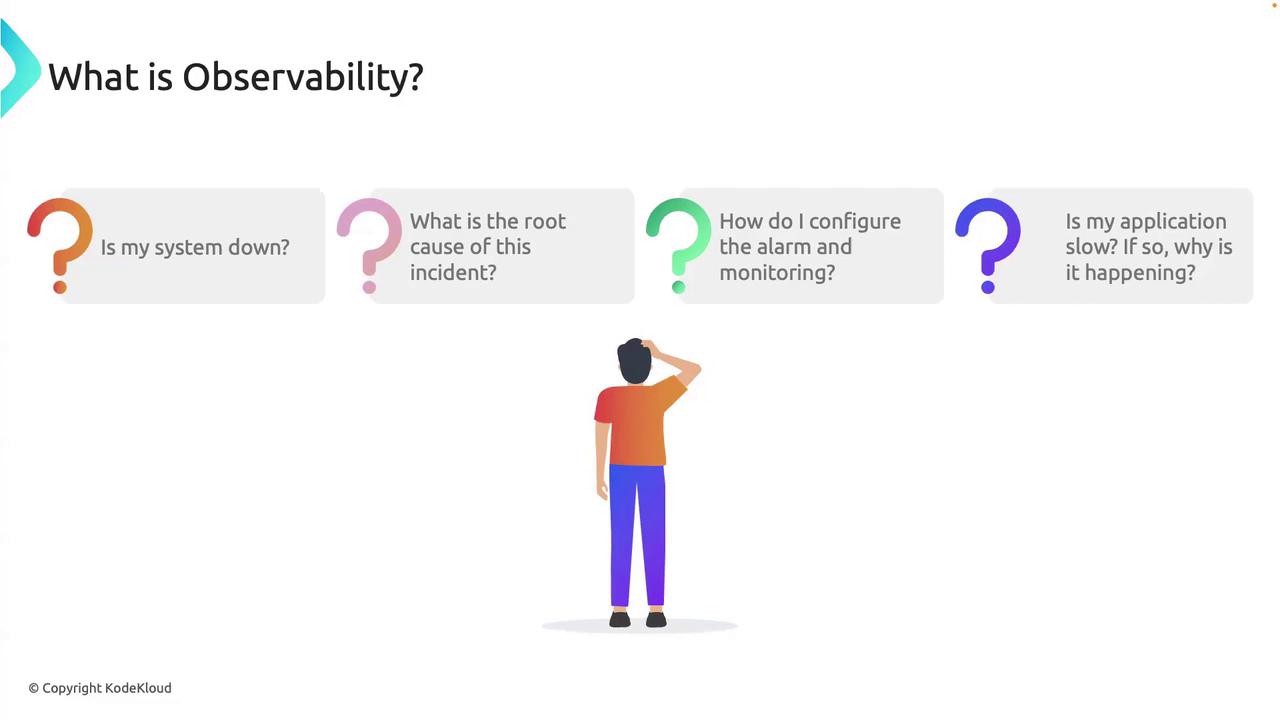
Think of observability as a telescope for your infrastructure. A naked-eye view shows you a few stars; with a telescope, you discover galaxies. Observability reveals not only *when* a service degrades, but **why**.
## The Three Pillars of Observability
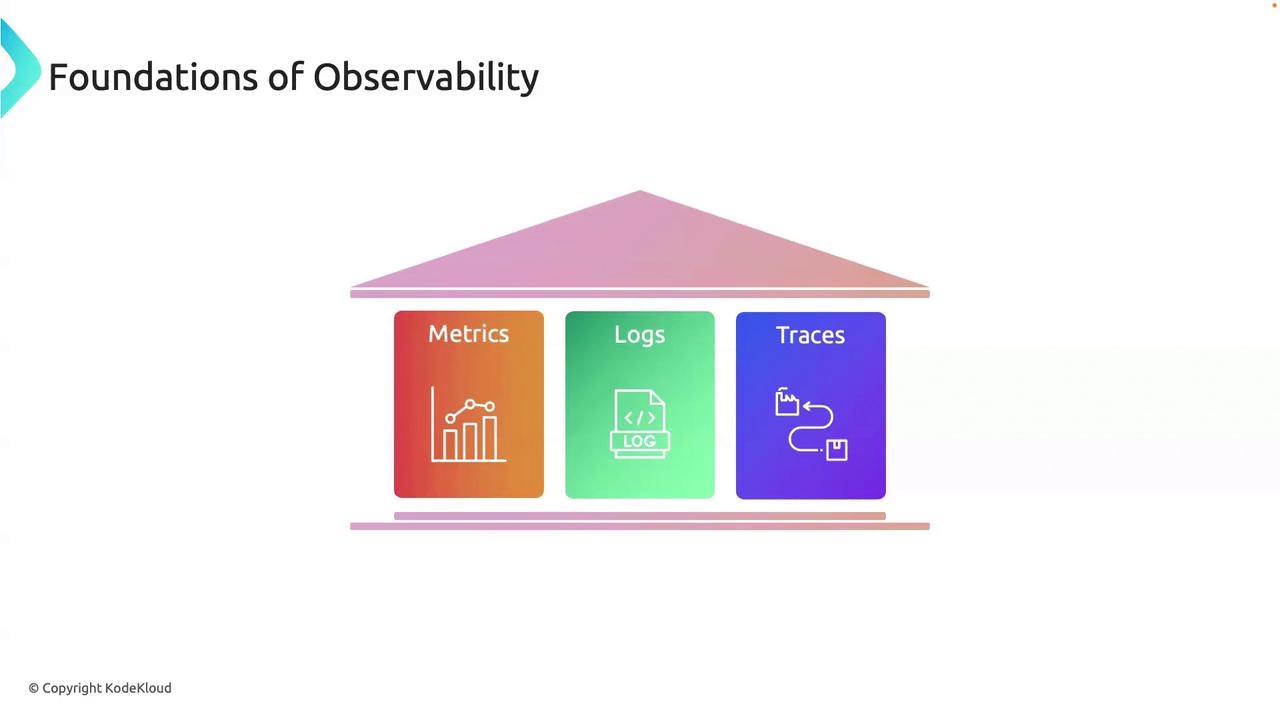
Observability stands on three foundational pillars. Together, they provide a comprehensive view of system behavior:
| Pillar | Purpose | Example in AWS CloudWatch |
| ------- | -------------------------------------- | ------------------------------------------------- |
| Metrics | Quantitative measures of system health | CPUUtilization, RequestCount, Latency |
| Logs | Timestamped event records for context | Application logs, AWS Lambda logs, VPC flow logs |
| Traces | End-to-end transaction tracking | AWS X-Ray traces showing service-to-service calls |
Metrics offer the “vital signs” of your infrastructure, logs provide the detailed event history, and traces map the journey of individual requests.
When ingesting high-cardinality logs, ensure you set appropriate log retention and indexing filters in [CloudWatch Logs](https://docs.aws.amazon.com/AmazonCloudWatch/latest/logs/). This avoids unnecessary costs and search delays.
## An Observability Action Plan
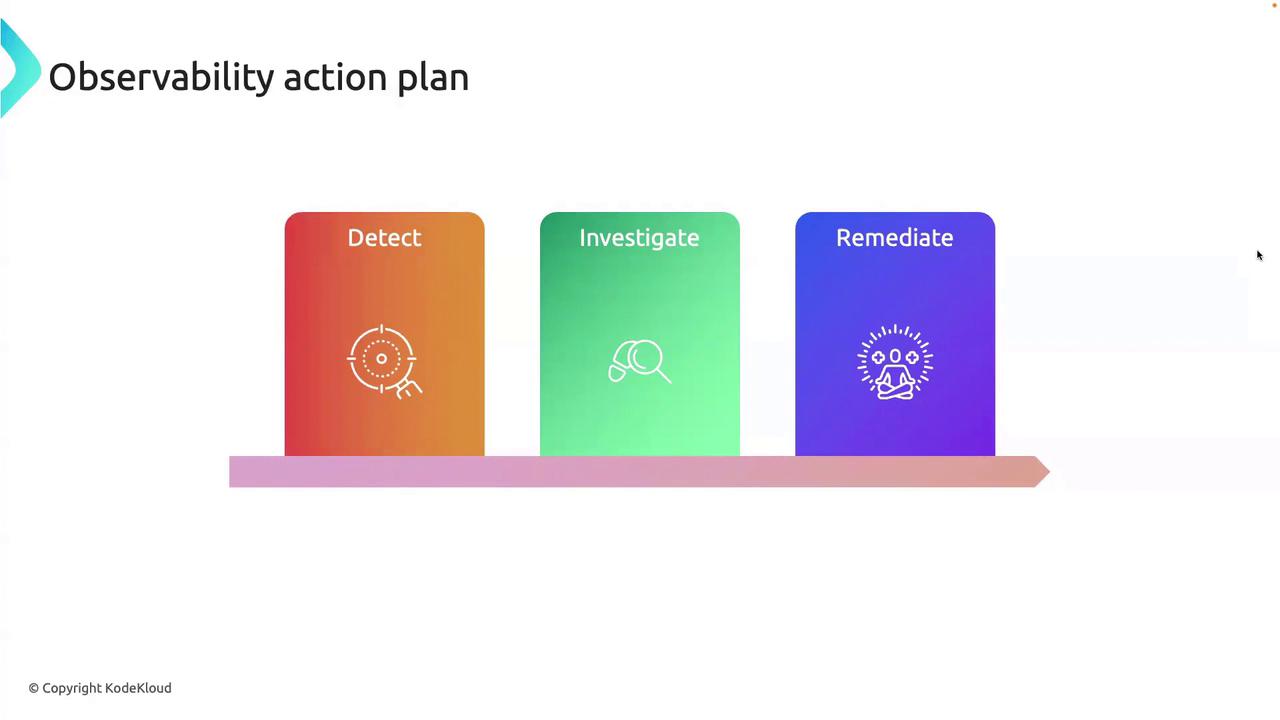
To operationalize observability, follow this three-stage cycle:
| Stage | Description |
| ----------- | ------------------------------------------------------------------------------------------------ |
| Detect | Continuously monitor key metrics; configure alarms for threshold breaches and anomaly detection. |
| Investigate | Use logs and traces to drill into anomalies, identify error patterns, and locate bottlenecks. |
| Remediate | Apply an immediate workaround, then analyze findings to implement a long-term solution. |
1. **Detect**\
Set up CloudWatch Alarms on metrics like `Latency`, `ErrorRate`, or custom business KPIs. Enable [Anomaly Detection](https://docs.aws.amazon.com/AmazonCloudWatch/latest/monitoring/CloudWatch_Anomaly_Detection.html) to catch unexpected patterns.
2. **Investigate**\
Open CloudWatch Logs insights queries or AWS X-Ray service maps. Correlate timestamped logs with trace spans to uncover the root cause quickly.
3. **Remediate**\
Roll out hotfixes via AWS Systems Manager or CI/CD pipelines. Then refine your alerts, add dashboards, and update runbooks to prevent recurrence.
Over-alerting leads to alert fatigue. Review and tune thresholds regularly—only notify when action is truly required.
## Conclusion
Observability is your competitive advantage in cloud-native environments. By harnessing **metrics**, **logs**, and **traces**—and rigorously following the **detect → investigate → remediate** cycle—you ensure resilient, high-performing systems. The more observable your stack, the more confidently you can deploy, scale, and innovate with AWS CloudWatch at your side.
***
## Links and References
* [AWS CloudWatch Documentation](https://docs.aws.amazon.com/cloudwatch/)
* [AWS X-Ray Developer Guide](https://docs.aws.amazon.com/xray/latest/devguide/)
* [Amazon CloudWatch Logs Insights](https://docs.aws.amazon.com/AmazonCloudWatch/latest/logs/AnalyzingLogData.html)
* [Kubernetes Logging and Monitoring](https://kubernetes.io/docs/concepts/cluster-administration/logging/)