> ## Documentation Index
> Fetch the complete documentation index at: https://notes.kodekloud.com/llms.txt
> Use this file to discover all available pages before exploring further.
# EKS monitoring
> This guide covers monitoring and observing Amazon EKS clusters using AWS-native services for effective performance tracking and troubleshooting.
In this guide, we’ll cover how to monitor and observe your Amazon EKS clusters using AWS-native and managed services. Effective observability is essential for day-two operations, enabling you to track performance, troubleshoot issues, and maintain compliance.
## 1. EKS Control Plane Logging
Enable control plane logging when creating your EKS cluster to capture API activity and control plane events. Logged data flows automatically to Amazon CloudWatch Logs in a log group named after your cluster.
Control plane logs are invaluable for auditing and security compliance. Enable them at cluster creation—AWS handles the log delivery.
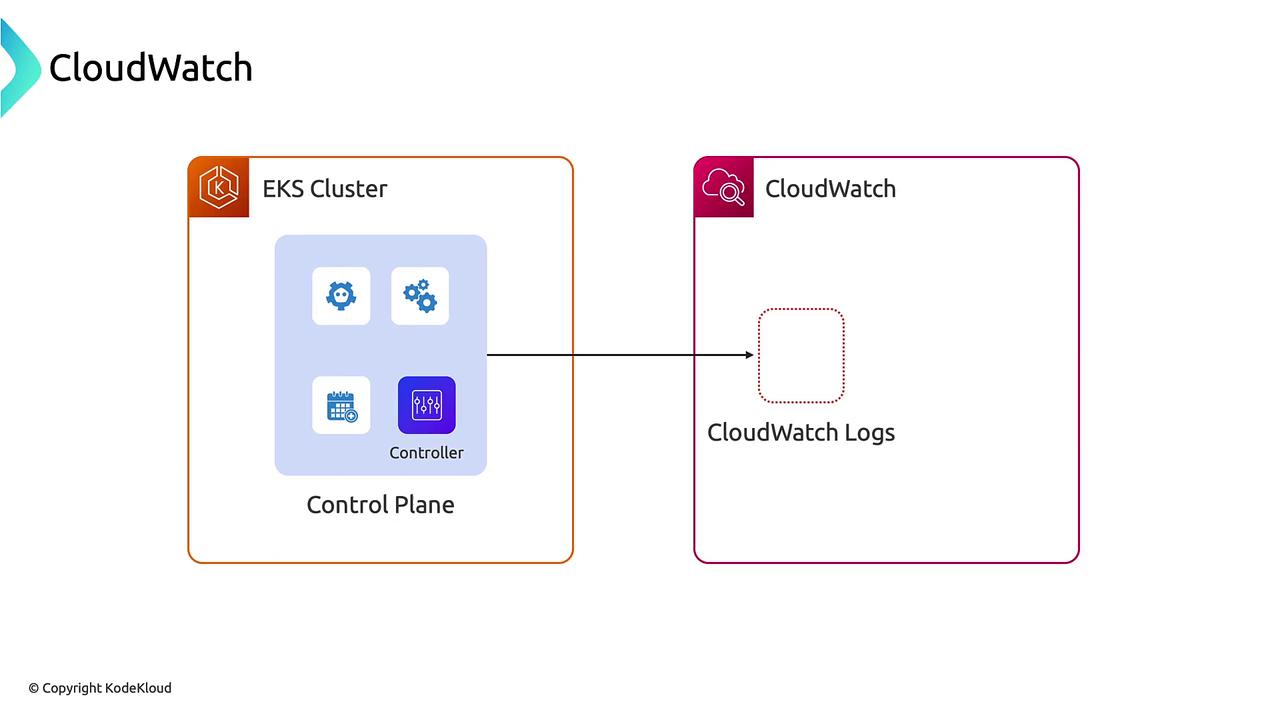
You can then use the [CloudWatch console](https://console.aws.amazon.com/cloudwatch/) to:
* Query and filter control plane logs
* Create CloudWatch Alarms on specific API calls
* Build dashboards to surface real-time cluster health
## 2. Node-Level Logging with CloudWatch Agents
To capture node-level system logs and container stdout/stderr streams, deploy the CloudWatch Logs agent on each EC2 node via the AWS Observability Add-on.
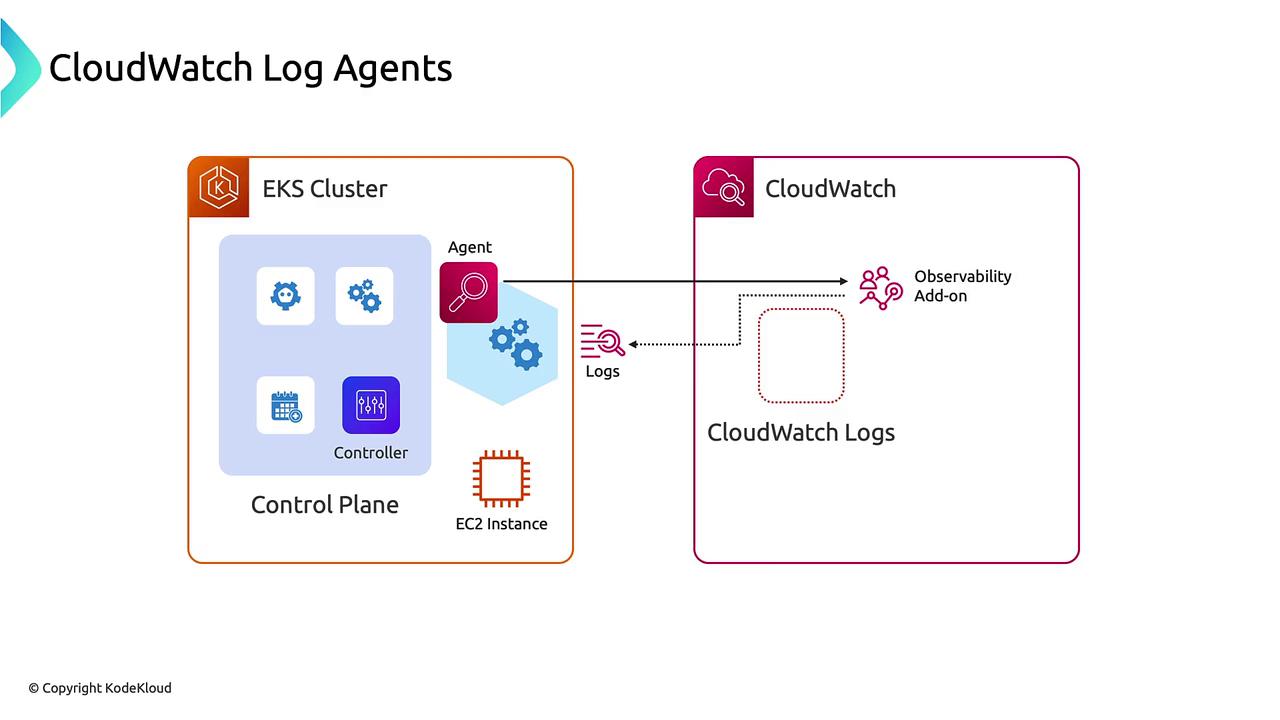
Key log sources:
| Log Source | Path/Type | Description |
| ------------------ | ------------------- | ------------------------------------- |
| Node system logs | `/var/log/messages` | OS events, kernel and system messages |
| Container logs | stdout/stderr | Application output and errors |
| Kubernetes metrics | Prometheus endpoint | CPU, memory, and pod-level metrics |
## 3. Workload Insights with ADOT
The AWS Distro for OpenTelemetry (ADOT) add-on extends CloudWatch Logs agent capabilities by collecting metrics, logs, and distributed traces. You can send data to CloudWatch or any OpenTelemetry-compatible backend.
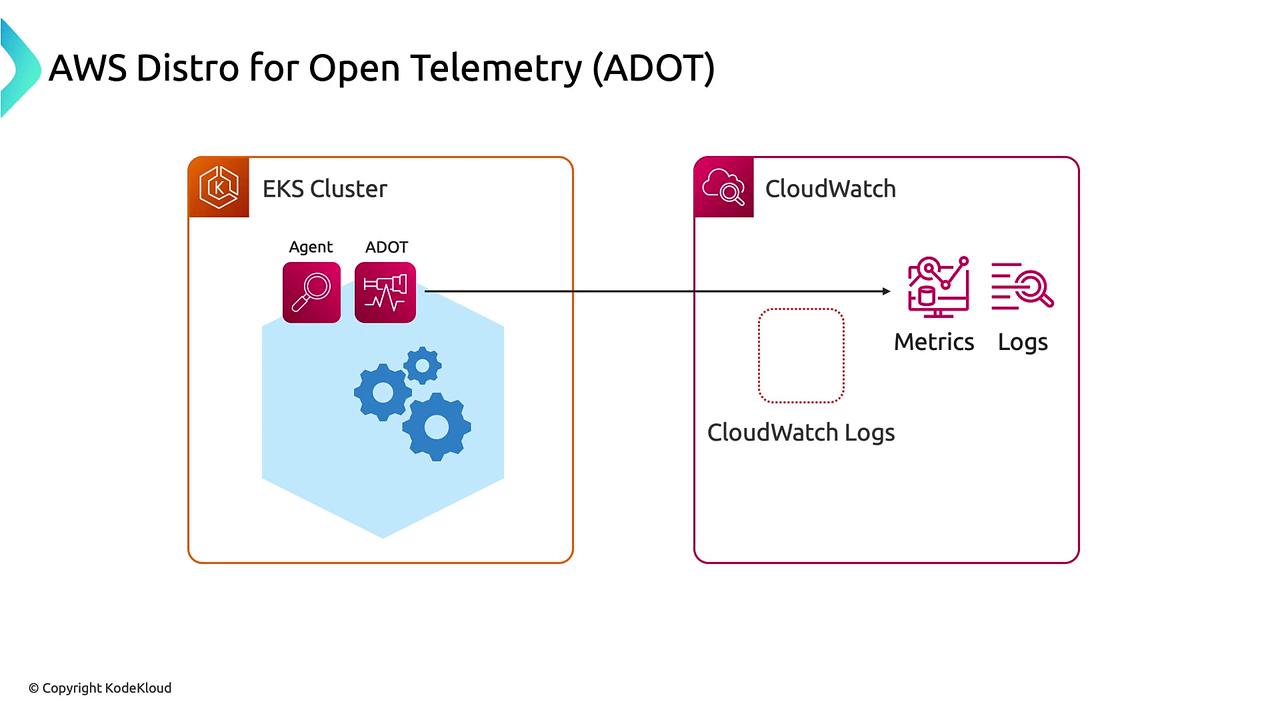
Benefits of ADOT:
* Unified collection pipeline for logs, metrics, and traces
* Native support for custom OpenTelemetry backends
* Correlation of application logs with performance metrics
### Tracing with AWS X-Ray
Layer the AWS X-Ray add-on on ADOT to enable end-to-end distributed tracing across microservices. Trace data is automatically visible in the [X-Ray console](https://docs.aws.amazon.com/xray/latest/devguide/aws-xray.html).
## 4. Fargate Logging
EKS on Fargate uses a managed Fluent Bit agent (similar to FireLens). Deploy logging by:
1. Creating an AWS Observability namespace in your cluster.
2. Applying the provided ConfigMap to configure Fluent Bit.
Fluent Bit collects container logs and forwards them to CloudWatch Logs. Note that underlying Fargate infrastructure metrics (CPU, memory) aren’t exposed the same way as on EC2.
Fargate only captures application container logs. If you require node-level metrics, consider EC2-based nodes or use Prometheus scraping.
## 5. Amazon Managed Prometheus and Grafana
For a fully managed Prometheus/Grafana experience, AWS offers:
| Service | Use Case | Key Features |
| ------------------------- | ------------------------------------ | ---------------------------------------------------- |
| Amazon Managed Prometheus | Scalable metrics ingestion & storage | Auto scale, high availability, Prometheus-compatible |
| Amazon Managed Grafana | Dashboards & alerting | IAM integration, plugins, team management |
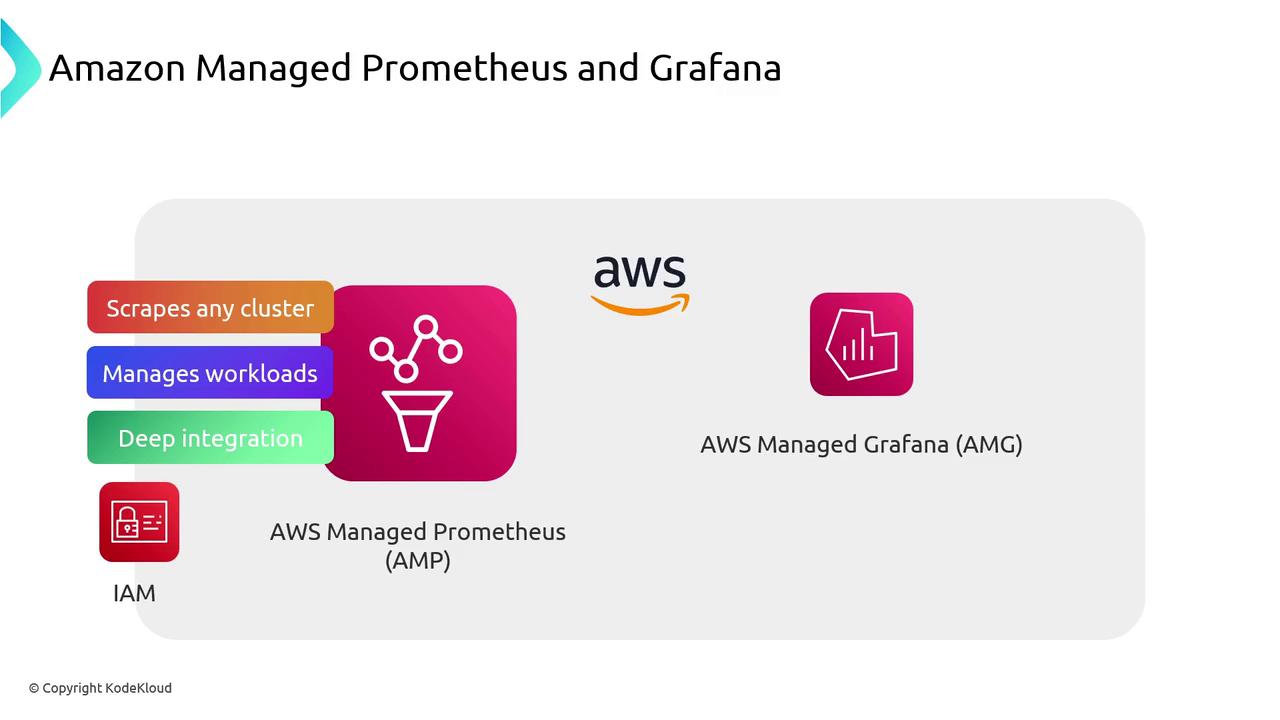
Configure AMP to scrape your EKS cluster endpoints, then build rich, interactive dashboards in AMG.
## Conclusion
AWS offers a comprehensive observability suite for EKS:
* **Control Plane Logs** via CloudWatch Logs
* **Node & Container Logs** with CloudWatch Logs agent and Observability Add-on
* **Unified Telemetry** using ADOT
* **Distributed Tracing** with AWS X-Ray
* **Fargate Logging** through managed Fluent Bit
* **Managed Metrics & Visualization** with AMP and AMG
Choose the right mix for your team’s needs and integrate with AWS IAM for secure, scalable monitoring.
## Links and References
* [EKS Overview](https://docs.aws.amazon.com/eks/latest/userguide/what-is-eks.html)
* [CloudWatch Logs](https://docs.aws.amazon.com/AmazonCloudWatch/latest/logs/WhatIsCloudWatchLogs.html)
* [CloudWatch Logs Agent Reference](https://docs.aws.amazon.com/AmazonCloudWatch/latest/logs/AgentReference.html)
* [EKS Observability Add-on](https://docs.aws.amazon.com/eks/latest/userguide/eks-observability.html)
* [AWS Distro for OpenTelemetry](https://aws.amazon.com/otel/)
* [AWS X-Ray Developer Guide](https://docs.aws.amazon.com/xray/latest/devguide/aws-xray.html)
* [EKS on Fargate](https://docs.aws.amazon.com/eks/latest/userguide/fargate.html)
* [Fluent Bit Documentation](https://docs.fluentbit.io/manual/)
* [Amazon Managed Prometheus](https://aws.amazon.com/prometheus/)
* [Amazon Managed Grafana](https://aws.amazon.com/grafana/)