> ## Documentation Index
> Fetch the complete documentation index at: https://notes.kodekloud.com/llms.txt
> Use this file to discover all available pages before exploring further.
# AWS CloudWatch
> Guide to using AWS CloudWatch to collect and analyze logs, metrics, alarms, traces, events, and dashboards for monitoring, troubleshooting, and visualizing applications and infrastructure
This lesson demonstrates how to use Amazon CloudWatch to monitor, troubleshoot, and visualize your AWS resources and applications. CloudWatch is a suite of related features—logs, metrics, alarms, traces, events (EventBridge), and dashboards—rather than a single monolithic service. Below we step through the common CloudWatch workflows you’ll use most often and include practical examples you can replicate in the console.
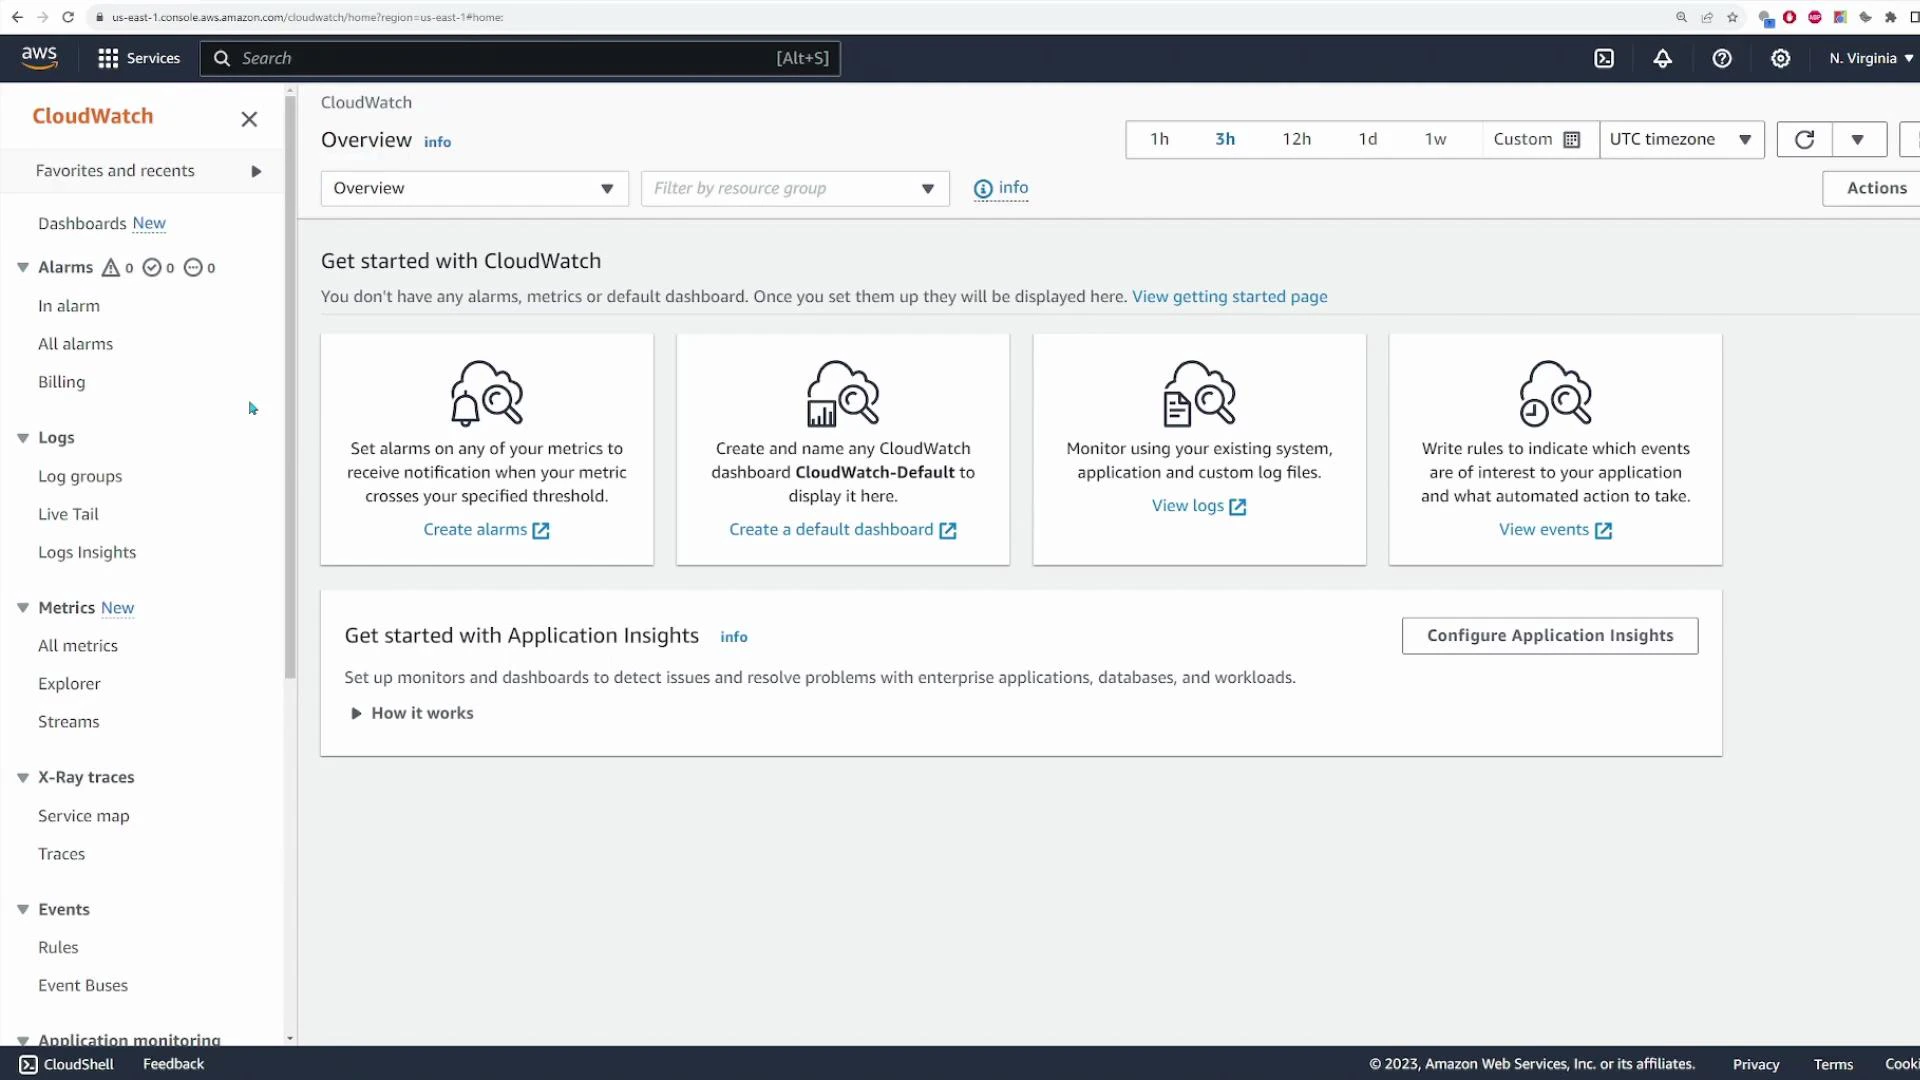 ## Logs (CloudWatch Logs)
CloudWatch Logs centralizes log data from AWS services and your applications. Use it to search, analyze, and retain logs in a single place.
* Log groups organize related logs (service, application, or resource).
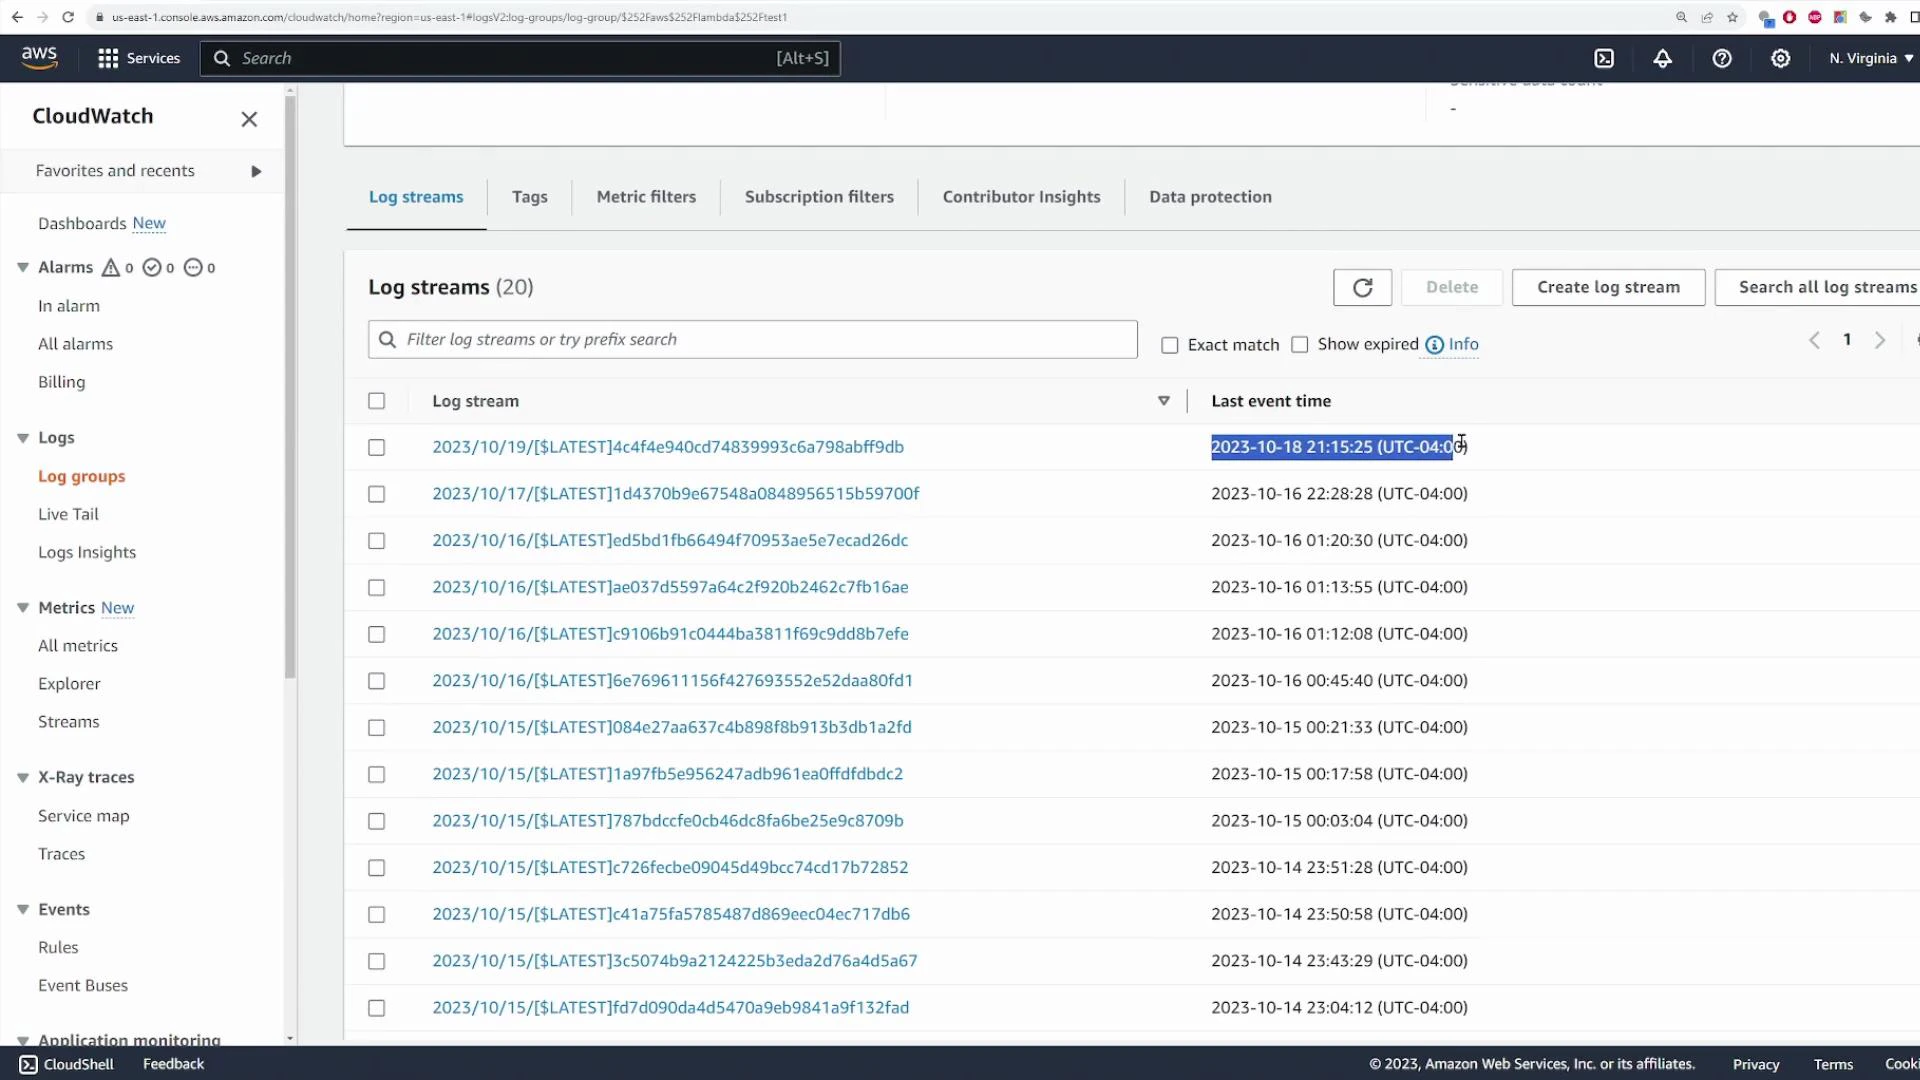
* Log streams store the sequence of events for a given resource or execution (for example, a Lambda invocation).
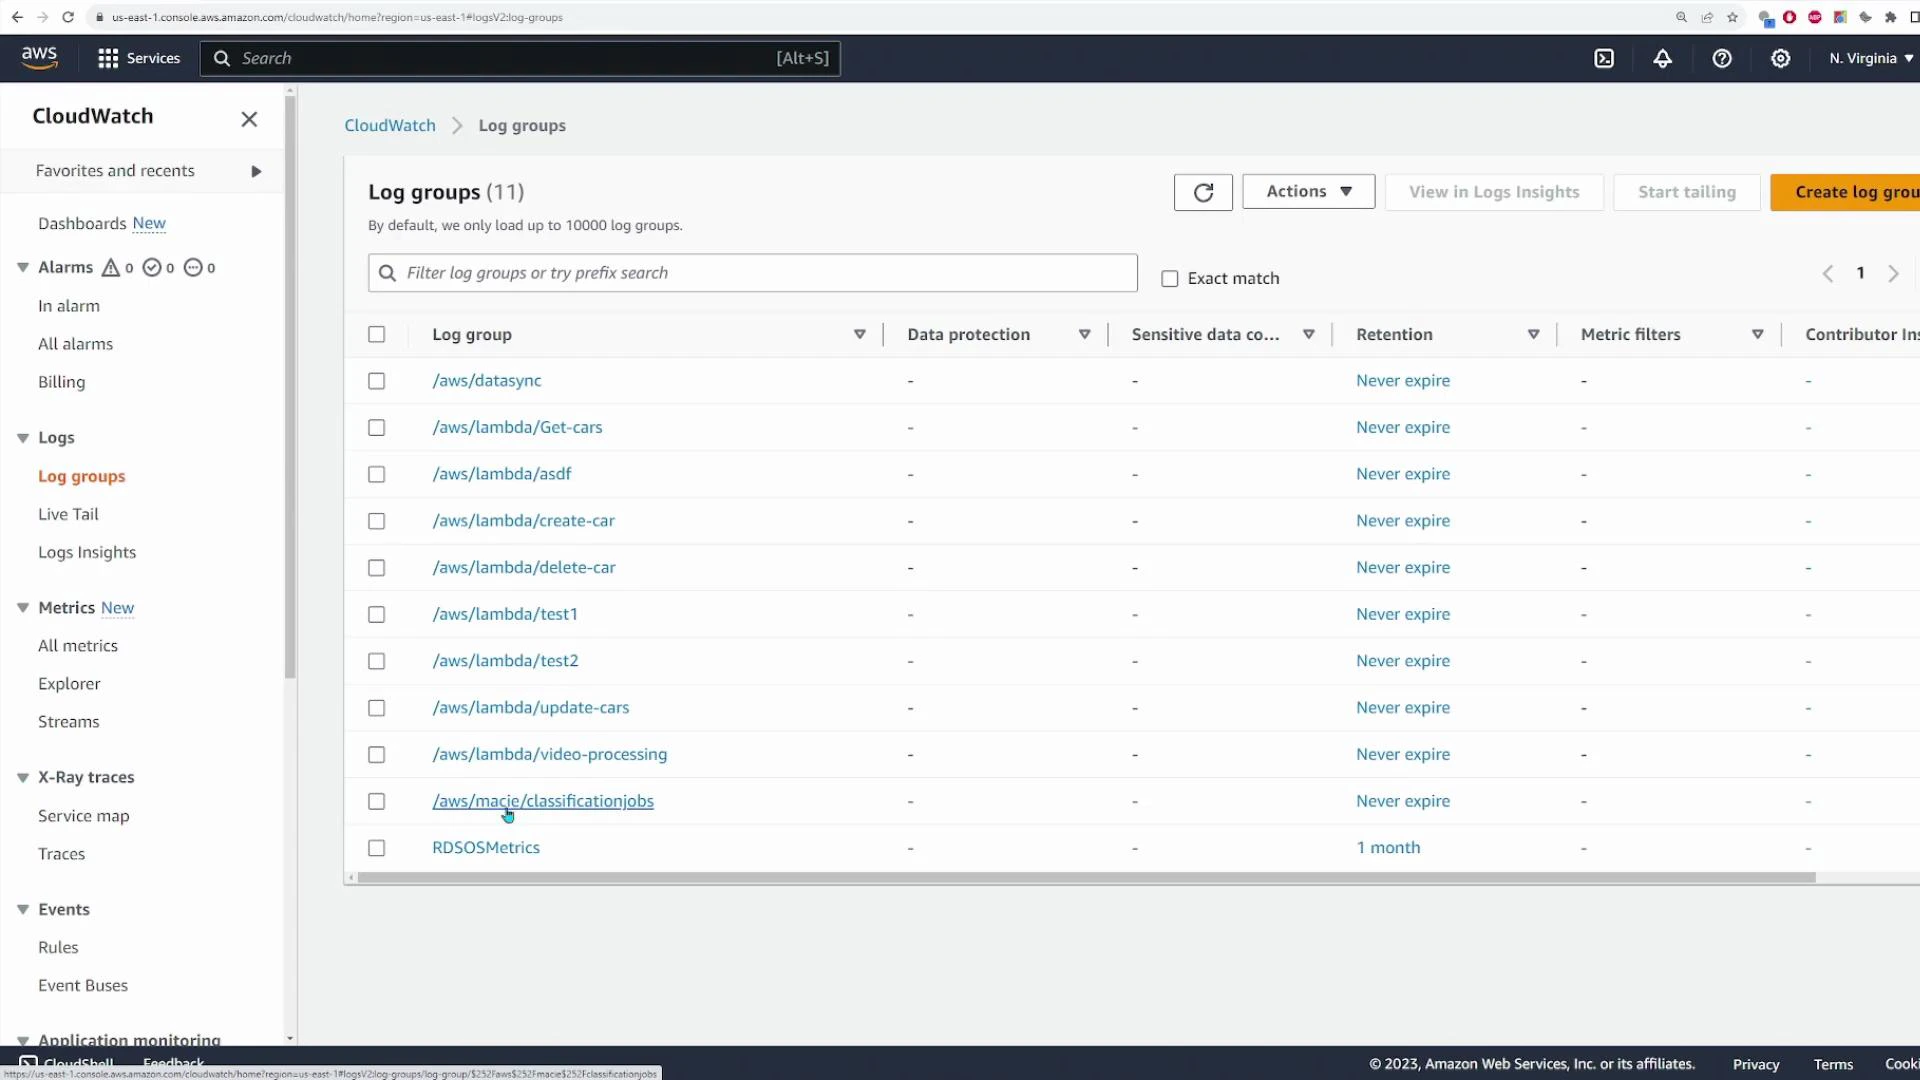
Example: Lambda functions often create log groups under `/aws/lambda/` and each invocation appears in a log stream.
## Logs (CloudWatch Logs)
CloudWatch Logs centralizes log data from AWS services and your applications. Use it to search, analyze, and retain logs in a single place.
* Log groups organize related logs (service, application, or resource).
* Log streams store the sequence of events for a given resource or execution (for example, a Lambda invocation).
Example: Lambda functions often create log groups under `/aws/lambda/` and each invocation appears in a log stream.
 Within a log group, open a log stream to inspect timestamped events for that period or invocation.
 Example Lambda logs (truncated):
```text theme={null}
2023-10-18T21:15:24.406-04:00 INIT_START Runtime Version: nodejs:18.v13 Runtime RuntimeARN: arn:aws:lambda:us-east-1:123456789012:runtime:0229ff5ced939264450549058d8f267110e92677c27063e6dcd78
2023-10-18T21:15:24.573-04:00 START RequestId: ece4ff36-0ad6-49a8-bb0e-4da06f561e77 Version: $LATEST
2023-10-18T21:15:24.574-04:00 2023-10-19T01:15:24.574Z ece4ff36-0ad6-49a8-bb0e-4da06f561e77 INFO {
Records: [
{
eventID: 'c4ca4238a0b923820dcc509a6f75849b',
eventName: 'INSERT',
eventVersion: '1.1',
eventSource: 'aws:dynamodb',
awsRegion: 'us-east-1',
dynamodb: [Object],
eventSourceARN: 'arn:aws:dynamodb:us-east-1:123456789012:table/ExampleTableWithStream/stream/2015-06-27T00:48:05.899'
},
{
eventID: 'c81e728d9d4c2f636f067f89cc14862c',
eventName: 'MODIFY',
eventVersion: '1.1',
eventSource: 'aws:dynamodb',
awsRegion: 'us-east-1',
dynamodb: [Object],
eventSourceARN: 'arn:aws:dynamodb:us-east-1:123456789012:table/ExampleTableWithStream/stream/2015-06-27T00:48:05.899'
}
]
}
2023-10-18T21:15:24.700-04:00 END RequestId: ece4ff36-0ad6-49a8-bb0e-4da06f561e77
2023-10-18T21:15:24.701-04:00 REPORT RequestId: ece4ff36-0ad6-49a8-bb0e-4da06f561e77 Duration: 126.12 ms Billed Duration: 127 ms Memory Size: 128 MB Max Memory Used: 69 MB
```
Macie job event logs are typical JSON objects describing lifecycle events:
```json theme={null}
{
"adminAccountId": "841860927337",
"jobId": "89bbfa2335dce8a8b3c1a1d38d78c12c",
"eventType": "JOB_CREATED",
"occurredAt": "2023-10-17T01:06:24.566653Z",
"description": "The job was created.",
"jobName": "macie-test-job"
}
```
Other lifecycle examples:
```json theme={null}
{
"eventType": "ONE_TIME_JOB_STARTED",
"occurredAt": "2023-10-17T01:06:29.618922Z",
"description": "The job started running.",
"jobName": "macie-test-job",
"runDate": "2023-10-17T01:06:24.365688Z"
}
```
```json theme={null}
{
"eventType": "JOB_COMPLETED",
"occurredAt": "2023-10-17T01:16:47.152607Z",
"description": "The job finished running.",
"jobName": "macie-test-job",
"runDate": "2023-10-17T01:06:24.365688Z"
}
```
Note: Log formats vary by service; treat each service’s logs as its canonical source for events and context.
Tip: Organize log groups by application, environment (prod/stage), and function to simplify searches and retention policies. Use descriptive names like `/aws/lambda/myapp-prod-createUser`.
### Live tailing logs
CloudWatch supports live tailing: stream new log events in real time for one or multiple log groups—useful for debugging or observing deployments.
Example Lambda logs (truncated):
```text theme={null}
2023-10-18T21:15:24.406-04:00 INIT_START Runtime Version: nodejs:18.v13 Runtime RuntimeARN: arn:aws:lambda:us-east-1:123456789012:runtime:0229ff5ced939264450549058d8f267110e92677c27063e6dcd78
2023-10-18T21:15:24.573-04:00 START RequestId: ece4ff36-0ad6-49a8-bb0e-4da06f561e77 Version: $LATEST
2023-10-18T21:15:24.574-04:00 2023-10-19T01:15:24.574Z ece4ff36-0ad6-49a8-bb0e-4da06f561e77 INFO {
Records: [
{
eventID: 'c4ca4238a0b923820dcc509a6f75849b',
eventName: 'INSERT',
eventVersion: '1.1',
eventSource: 'aws:dynamodb',
awsRegion: 'us-east-1',
dynamodb: [Object],
eventSourceARN: 'arn:aws:dynamodb:us-east-1:123456789012:table/ExampleTableWithStream/stream/2015-06-27T00:48:05.899'
},
{
eventID: 'c81e728d9d4c2f636f067f89cc14862c',
eventName: 'MODIFY',
eventVersion: '1.1',
eventSource: 'aws:dynamodb',
awsRegion: 'us-east-1',
dynamodb: [Object],
eventSourceARN: 'arn:aws:dynamodb:us-east-1:123456789012:table/ExampleTableWithStream/stream/2015-06-27T00:48:05.899'
}
]
}
2023-10-18T21:15:24.700-04:00 END RequestId: ece4ff36-0ad6-49a8-bb0e-4da06f561e77
2023-10-18T21:15:24.701-04:00 REPORT RequestId: ece4ff36-0ad6-49a8-bb0e-4da06f561e77 Duration: 126.12 ms Billed Duration: 127 ms Memory Size: 128 MB Max Memory Used: 69 MB
```
Macie job event logs are typical JSON objects describing lifecycle events:
```json theme={null}
{
"adminAccountId": "841860927337",
"jobId": "89bbfa2335dce8a8b3c1a1d38d78c12c",
"eventType": "JOB_CREATED",
"occurredAt": "2023-10-17T01:06:24.566653Z",
"description": "The job was created.",
"jobName": "macie-test-job"
}
```
Other lifecycle examples:
```json theme={null}
{
"eventType": "ONE_TIME_JOB_STARTED",
"occurredAt": "2023-10-17T01:06:29.618922Z",
"description": "The job started running.",
"jobName": "macie-test-job",
"runDate": "2023-10-17T01:06:24.365688Z"
}
```
```json theme={null}
{
"eventType": "JOB_COMPLETED",
"occurredAt": "2023-10-17T01:16:47.152607Z",
"description": "The job finished running.",
"jobName": "macie-test-job",
"runDate": "2023-10-17T01:06:24.365688Z"
}
```
Note: Log formats vary by service; treat each service’s logs as its canonical source for events and context.
Tip: Organize log groups by application, environment (prod/stage), and function to simplify searches and retention policies. Use descriptive names like `/aws/lambda/myapp-prod-createUser`.
### Live tailing logs
CloudWatch supports live tailing: stream new log events in real time for one or multiple log groups—useful for debugging or observing deployments.
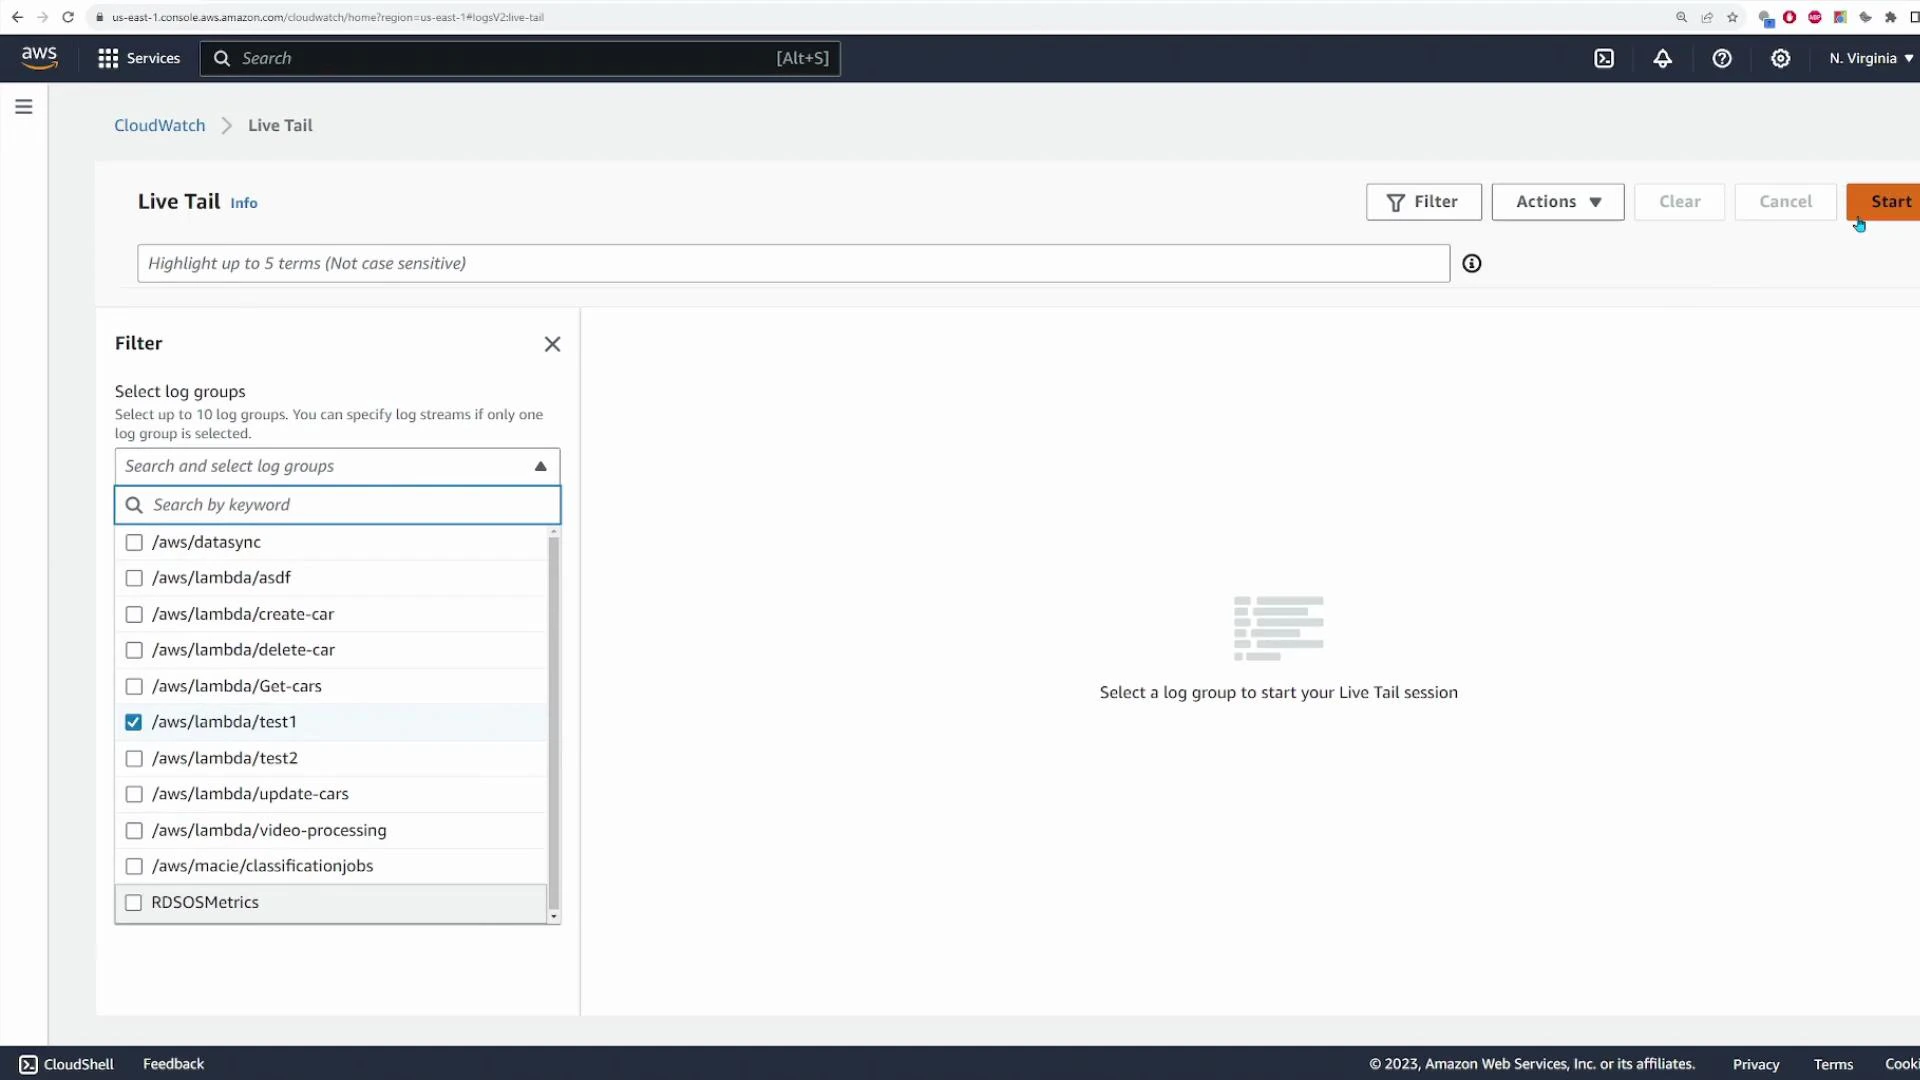 Example tail output:
```text theme={null}
Timestamp (Local) Message
2023-10-18T21:20:54.310-04:00 START RequestId: 78d5a620-3f88-4ed2-aec1-150ee81539ae Version: $LATEST
2023-10-18T21:20:54.405-04:00 2023-10-19T01:20:54.405Z 78d5a620-3f88-4ed2-aec1-150ee81539ae INFO { Records: [ { eventID: 'c4ca4238a0b923820dcc509a6f75849b', eventName: 'INSERT', ... } ] }
2023-10-18T21:20:54.426-04:00 END RequestId: 78d5a620-3f88-4ed2-aec1-150ee81539ae
2023-10-18T21:20:54.426-04:00 REPORT RequestId: 78d5a620-3f88-4ed2-aec1-150ee81539ae Duration: 116.26 ms Billed Duration: 117 ms Memory Size: 128 MB Max Memory Used: 69 MB
```
You can combine live tailing with filters (substring, JSON field, or log level) to reduce noise and focus on the events you need.
Warning: Live tailing and storing large volumes of logs can increase CloudWatch costs. Apply retention policies and filters to limit retained data and reduce expense.
## Log Insights (CloudWatch Logs Insights)
CloudWatch Logs Insights is a powerful, SQL-like query engine to search, parse, and visualize log data. It’s ideal for aggregations, pattern searches, and extracting structured fields from JSON logs.
Basic query examples:
* Recent 20 messages (descending timestamp):
```text theme={null}
fields @timestamp, @message, @logStream, @log
| sort @timestamp desc
| limit 20
```
* Oldest 5 messages (ascending):
```text theme={null}
fields @timestamp, @message, @logStream, @log
| sort @timestamp asc
| limit 5
```
Run queries against chosen log groups to produce interactive histograms and to inspect matching log events.
## Metrics
CloudWatch Metrics stores and visualizes time-series data for AWS services and custom metrics. Browse “All metrics” to see namespaces such as AWS/EC2, AWS/Lambda, AWS/S3, and custom namespaces.
Example tail output:
```text theme={null}
Timestamp (Local) Message
2023-10-18T21:20:54.310-04:00 START RequestId: 78d5a620-3f88-4ed2-aec1-150ee81539ae Version: $LATEST
2023-10-18T21:20:54.405-04:00 2023-10-19T01:20:54.405Z 78d5a620-3f88-4ed2-aec1-150ee81539ae INFO { Records: [ { eventID: 'c4ca4238a0b923820dcc509a6f75849b', eventName: 'INSERT', ... } ] }
2023-10-18T21:20:54.426-04:00 END RequestId: 78d5a620-3f88-4ed2-aec1-150ee81539ae
2023-10-18T21:20:54.426-04:00 REPORT RequestId: 78d5a620-3f88-4ed2-aec1-150ee81539ae Duration: 116.26 ms Billed Duration: 117 ms Memory Size: 128 MB Max Memory Used: 69 MB
```
You can combine live tailing with filters (substring, JSON field, or log level) to reduce noise and focus on the events you need.
Warning: Live tailing and storing large volumes of logs can increase CloudWatch costs. Apply retention policies and filters to limit retained data and reduce expense.
## Log Insights (CloudWatch Logs Insights)
CloudWatch Logs Insights is a powerful, SQL-like query engine to search, parse, and visualize log data. It’s ideal for aggregations, pattern searches, and extracting structured fields from JSON logs.
Basic query examples:
* Recent 20 messages (descending timestamp):
```text theme={null}
fields @timestamp, @message, @logStream, @log
| sort @timestamp desc
| limit 20
```
* Oldest 5 messages (ascending):
```text theme={null}
fields @timestamp, @message, @logStream, @log
| sort @timestamp asc
| limit 5
```
Run queries against chosen log groups to produce interactive histograms and to inspect matching log events.
## Metrics
CloudWatch Metrics stores and visualizes time-series data for AWS services and custom metrics. Browse “All metrics” to see namespaces such as AWS/EC2, AWS/Lambda, AWS/S3, and custom namespaces.
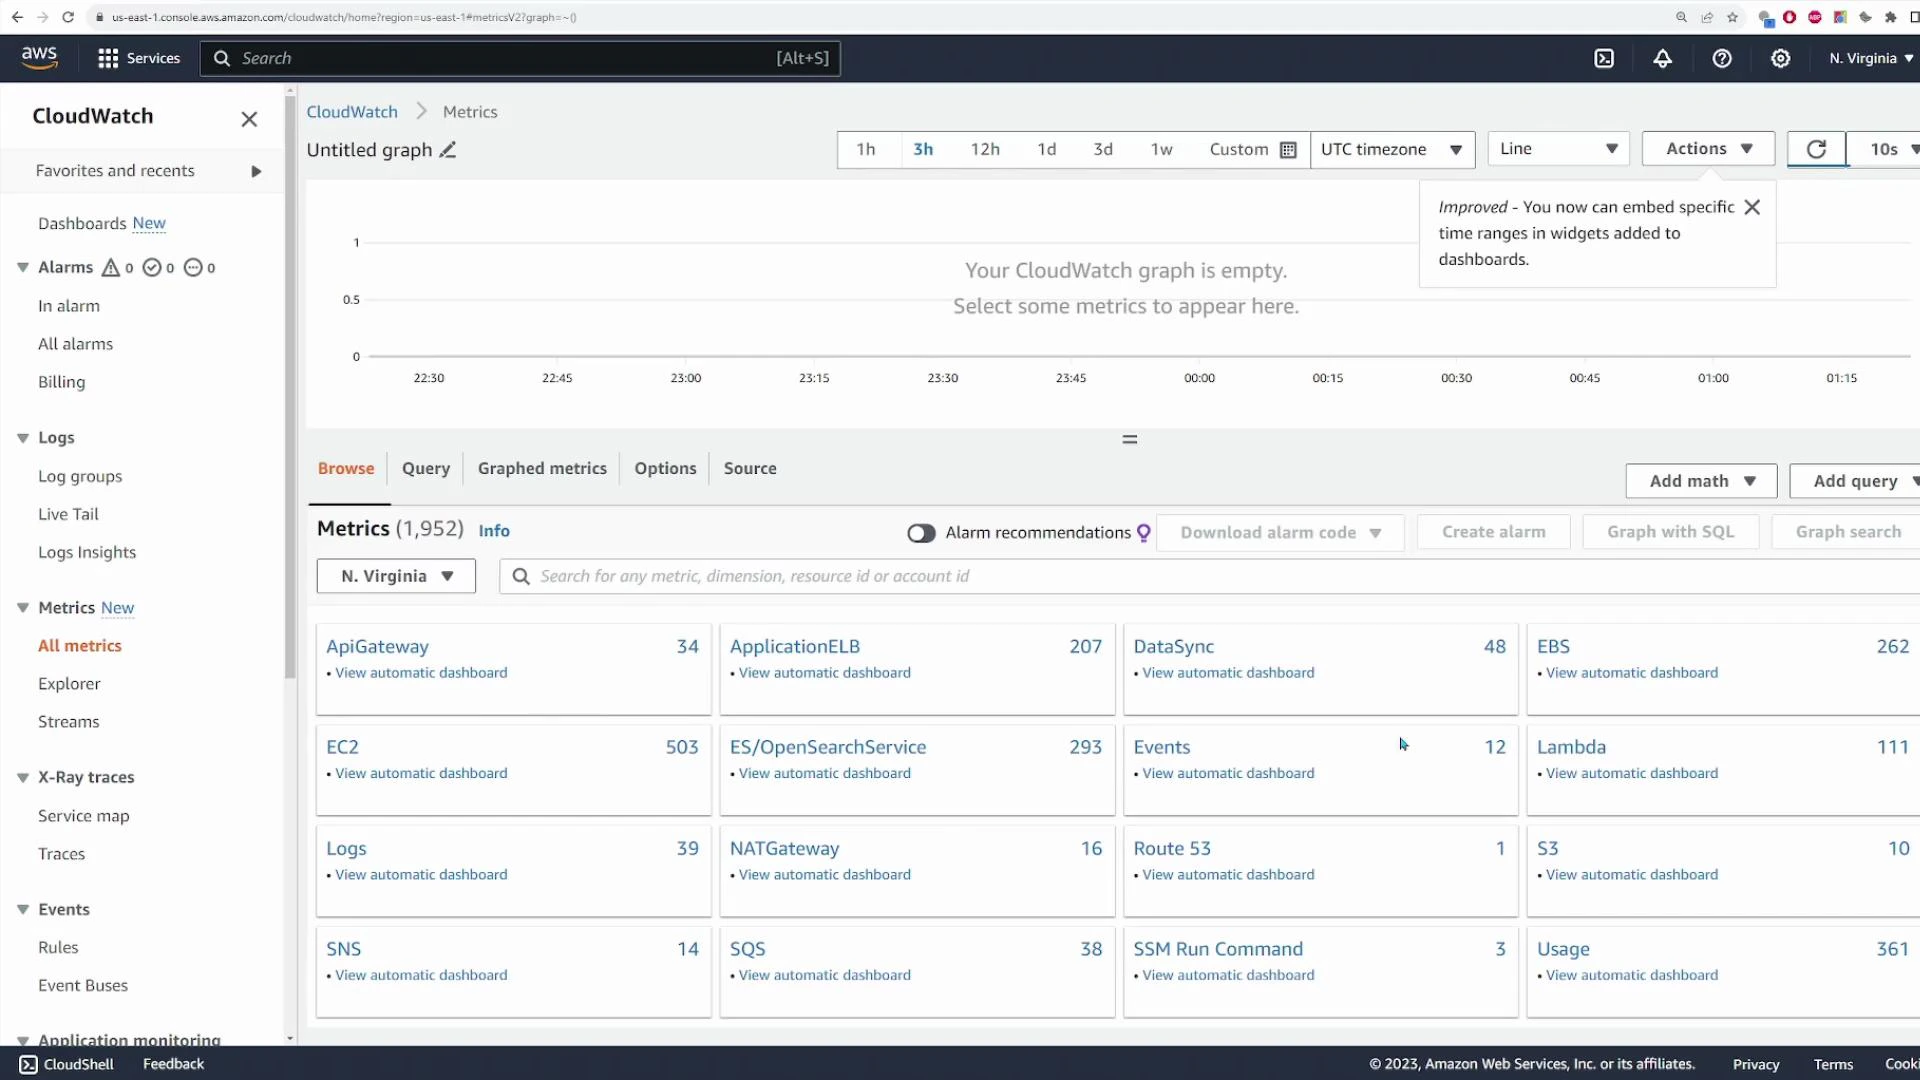 Common EC2 metrics:
| Metric name | Use case |
| -------------------------- | ------------------------------------------------------- |
| CPUUtilization | Detect high CPU usage and performance bottlenecks |
| NetworkIn / NetworkOut | Monitor traffic patterns and potential bandwidth issues |
| DiskReadOps / DiskWriteOps | Track IO pressure on storage |
| StatusCheckFailed | Alert on instance-level health problems |
When viewing a metric, configure the time range, statistic (Average, Sum, Min, Max), and graph type to match your monitoring needs.
## Alarms
CloudWatch Alarms monitor metrics and trigger actions when a defined threshold is breached. Actions include publishing to SNS topics, invoking Auto Scaling policies, or triggering Lambda functions.
To create an alarm:
1. Choose a metric (for example, AWS/EC2 → CPUUtilization).
2. Select statistic and period (e.g., Average over 5 minutes).
3. Set threshold conditions (e.g., Greater than 60%).
4. Configure actions and notification targets (SNS, Auto Scaling, etc.).
5. Review and create the alarm.
Common EC2 metrics:
| Metric name | Use case |
| -------------------------- | ------------------------------------------------------- |
| CPUUtilization | Detect high CPU usage and performance bottlenecks |
| NetworkIn / NetworkOut | Monitor traffic patterns and potential bandwidth issues |
| DiskReadOps / DiskWriteOps | Track IO pressure on storage |
| StatusCheckFailed | Alert on instance-level health problems |
When viewing a metric, configure the time range, statistic (Average, Sum, Min, Max), and graph type to match your monitoring needs.
## Alarms
CloudWatch Alarms monitor metrics and trigger actions when a defined threshold is breached. Actions include publishing to SNS topics, invoking Auto Scaling policies, or triggering Lambda functions.
To create an alarm:
1. Choose a metric (for example, AWS/EC2 → CPUUtilization).
2. Select statistic and period (e.g., Average over 5 minutes).
3. Set threshold conditions (e.g., Greater than 60%).
4. Configure actions and notification targets (SNS, Auto Scaling, etc.).
5. Review and create the alarm.
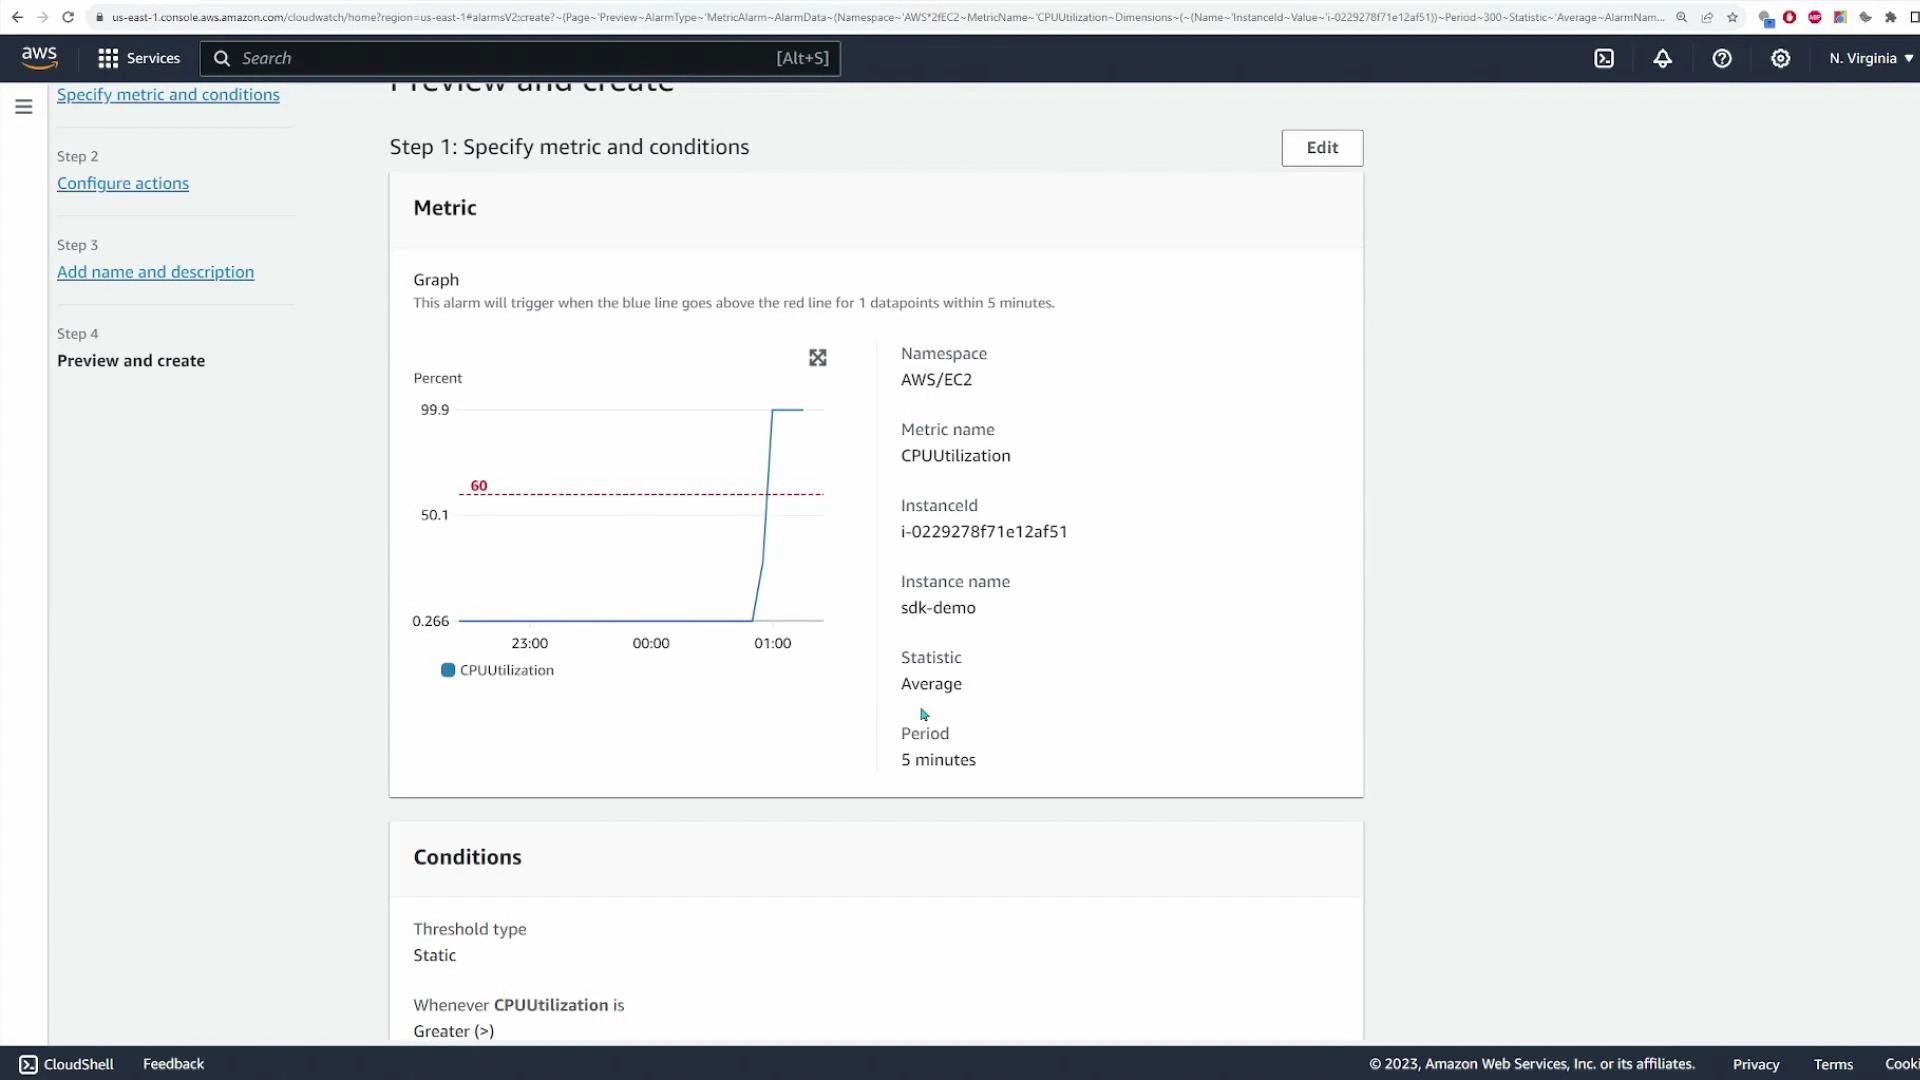
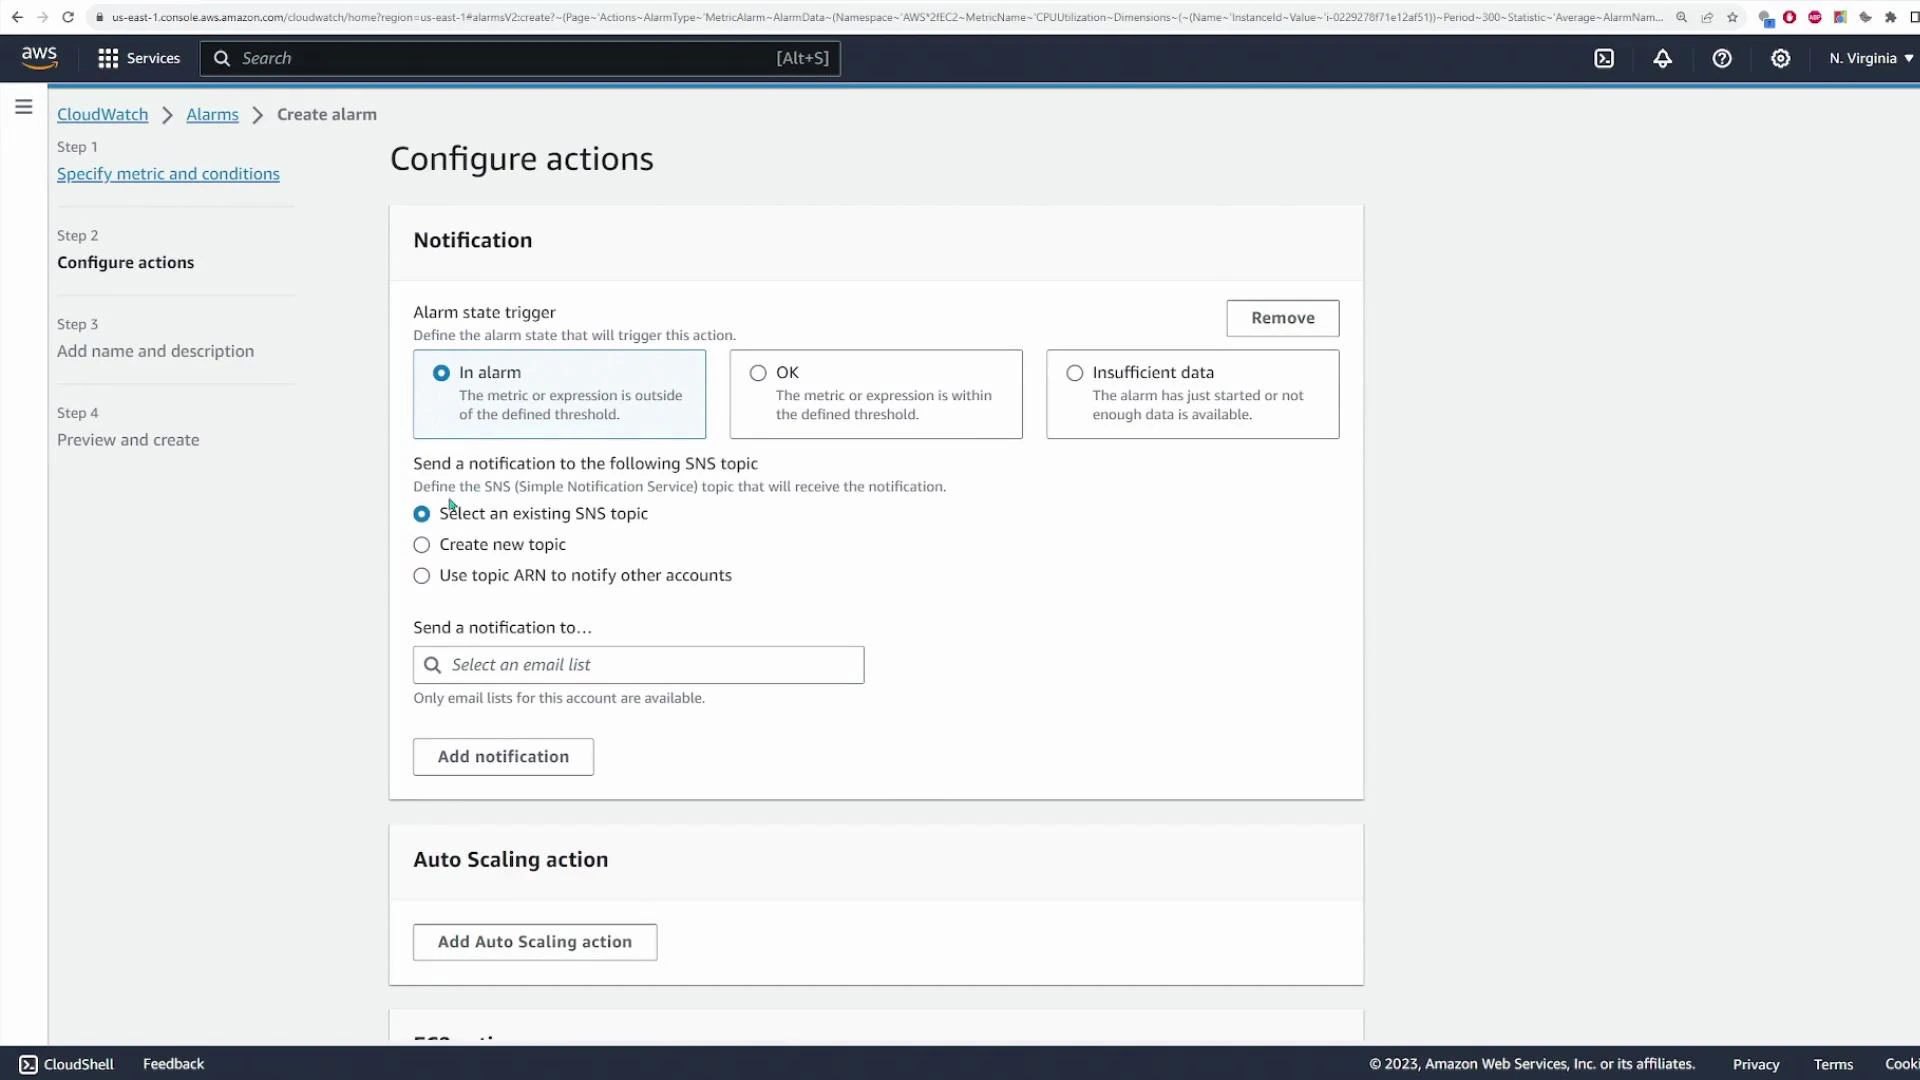 Example: Monitor EC2 CPUUtilization and notify via SNS when the average CPU exceeds 60% for a 5-minute period.
 ## Traces and Insights (X-Ray integration)
CloudWatch integrates with AWS X-Ray for distributed tracing. Instrument your application with X-Ray SDKs to capture trace segments from serverless functions, containers, and EC2 services. View traces in the Traces/Service Map pages to diagnose latencies and pinpoint bottlenecks.
CloudWatch also includes specialized insights:
* Container Insights — ECS/EKS monitoring and diagnostics
* Lambda Insights — deeper Lambda performance telemetry
* Application Insights — application-level health and troubleshooting
Refer to the X-Ray docs for instrumentation guidance: [https://aws.amazon.com/xray/](https://aws.amazon.com/xray/)
## Events / EventBridge
CloudWatch Events evolved into Amazon EventBridge. EventBridge routes events using rules to targets such as Lambda, SNS, and SQS. Use it to react to state changes, schedule tasks, or architect event-driven systems.
## Traces and Insights (X-Ray integration)
CloudWatch integrates with AWS X-Ray for distributed tracing. Instrument your application with X-Ray SDKs to capture trace segments from serverless functions, containers, and EC2 services. View traces in the Traces/Service Map pages to diagnose latencies and pinpoint bottlenecks.
CloudWatch also includes specialized insights:
* Container Insights — ECS/EKS monitoring and diagnostics
* Lambda Insights — deeper Lambda performance telemetry
* Application Insights — application-level health and troubleshooting
Refer to the X-Ray docs for instrumentation guidance: [https://aws.amazon.com/xray/](https://aws.amazon.com/xray/)
## Events / EventBridge
CloudWatch Events evolved into Amazon EventBridge. EventBridge routes events using rules to targets such as Lambda, SNS, and SQS. Use it to react to state changes, schedule tasks, or architect event-driven systems.
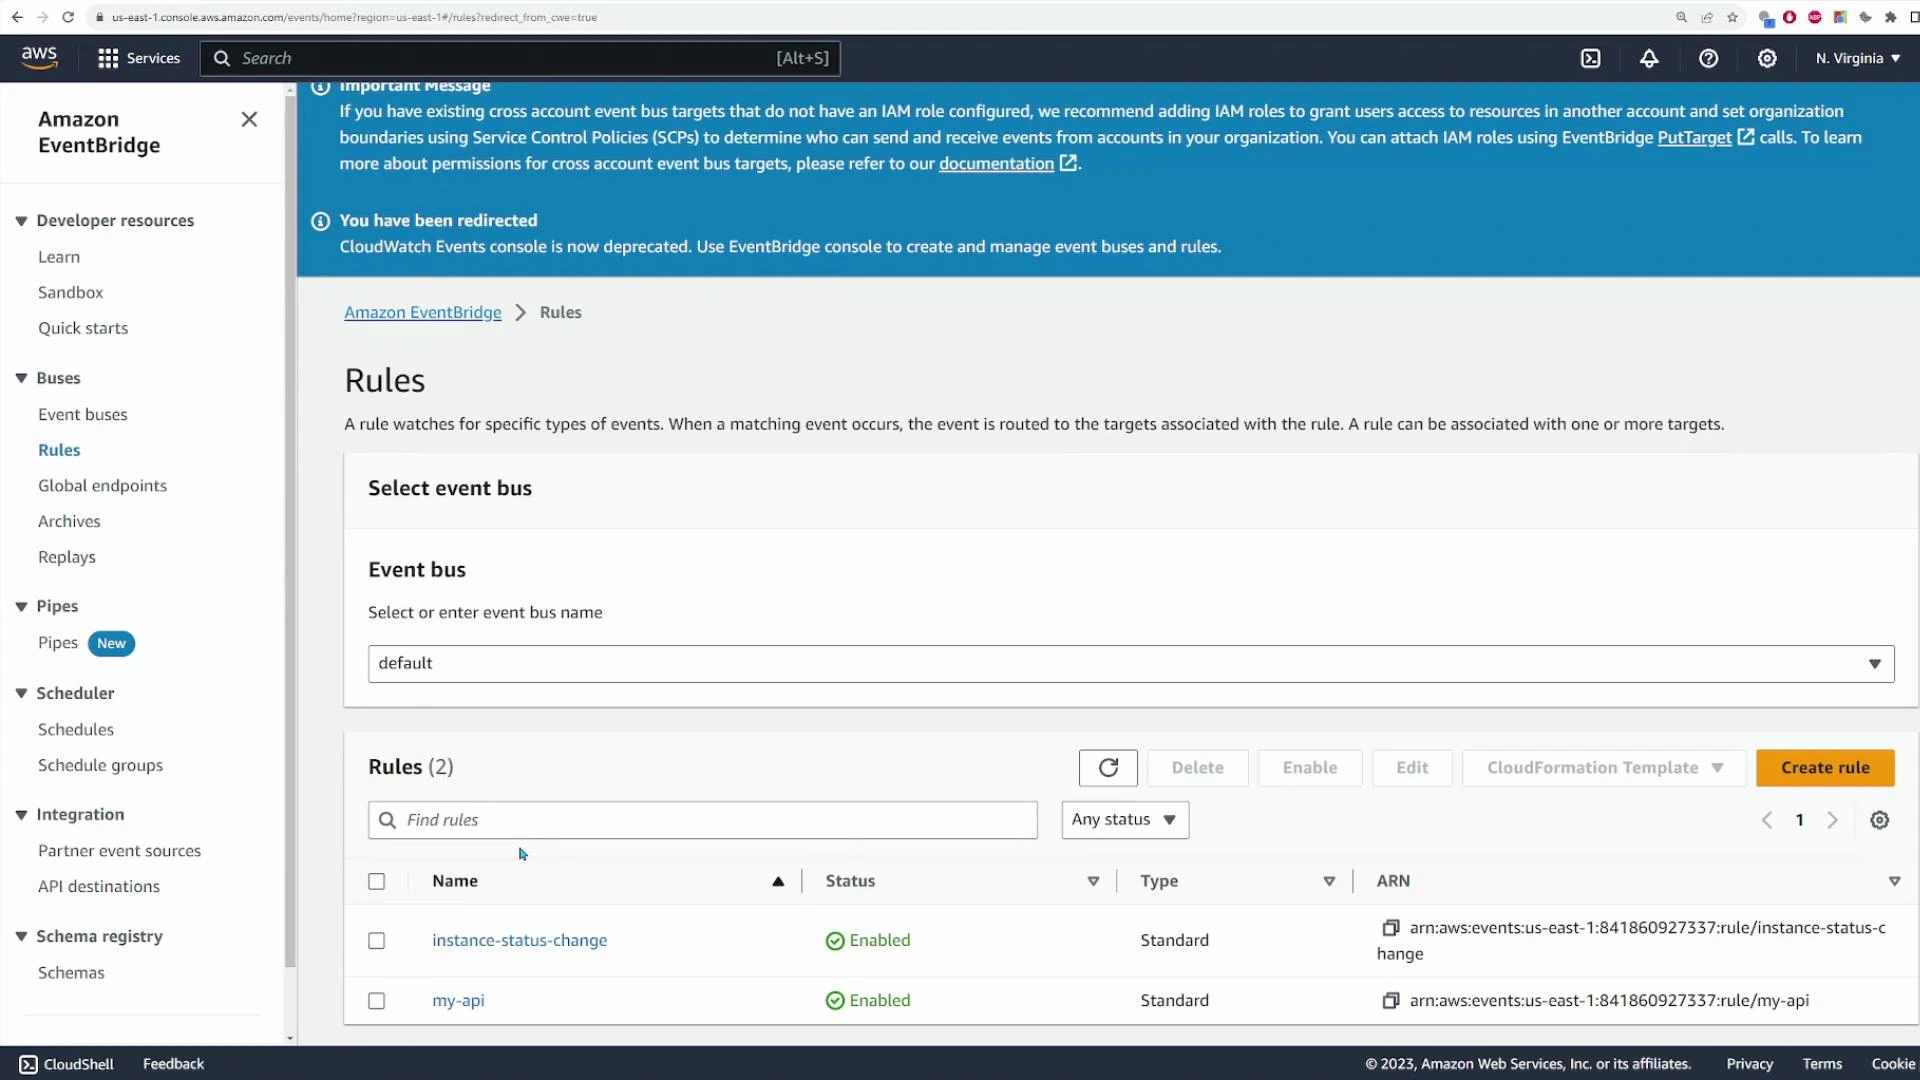 Use cases:
* Trigger a Lambda when an EC2 instance changes state.
* Schedule maintenance tasks with a cron-style rule.
* Route SaaS partner events to internal targets.
For details and examples, see the EventBridge user guide: [https://docs.aws.amazon.com/eventbridge/latest/userguide/](https://docs.aws.amazon.com/eventbridge/latest/userguide/)
## Dashboards
CloudWatch Dashboards let you compose widgets—metric graphs, single-value numbers, logs tables, and text—into a consolidated monitoring view.
To create a dashboard:
1. Give it a name (e.g., demo-dashboard).
2. Add widgets: Line, Number, Gauge, Bar, Logs table, etc.
3. Select metrics or logs for each widget and arrange them on the canvas.
4. Save and share or embed the dashboard as needed.
Use cases:
* Trigger a Lambda when an EC2 instance changes state.
* Schedule maintenance tasks with a cron-style rule.
* Route SaaS partner events to internal targets.
For details and examples, see the EventBridge user guide: [https://docs.aws.amazon.com/eventbridge/latest/userguide/](https://docs.aws.amazon.com/eventbridge/latest/userguide/)
## Dashboards
CloudWatch Dashboards let you compose widgets—metric graphs, single-value numbers, logs tables, and text—into a consolidated monitoring view.
To create a dashboard:
1. Give it a name (e.g., demo-dashboard).
2. Add widgets: Line, Number, Gauge, Bar, Logs table, etc.
3. Select metrics or logs for each widget and arrange them on the canvas.
4. Save and share or embed the dashboard as needed.
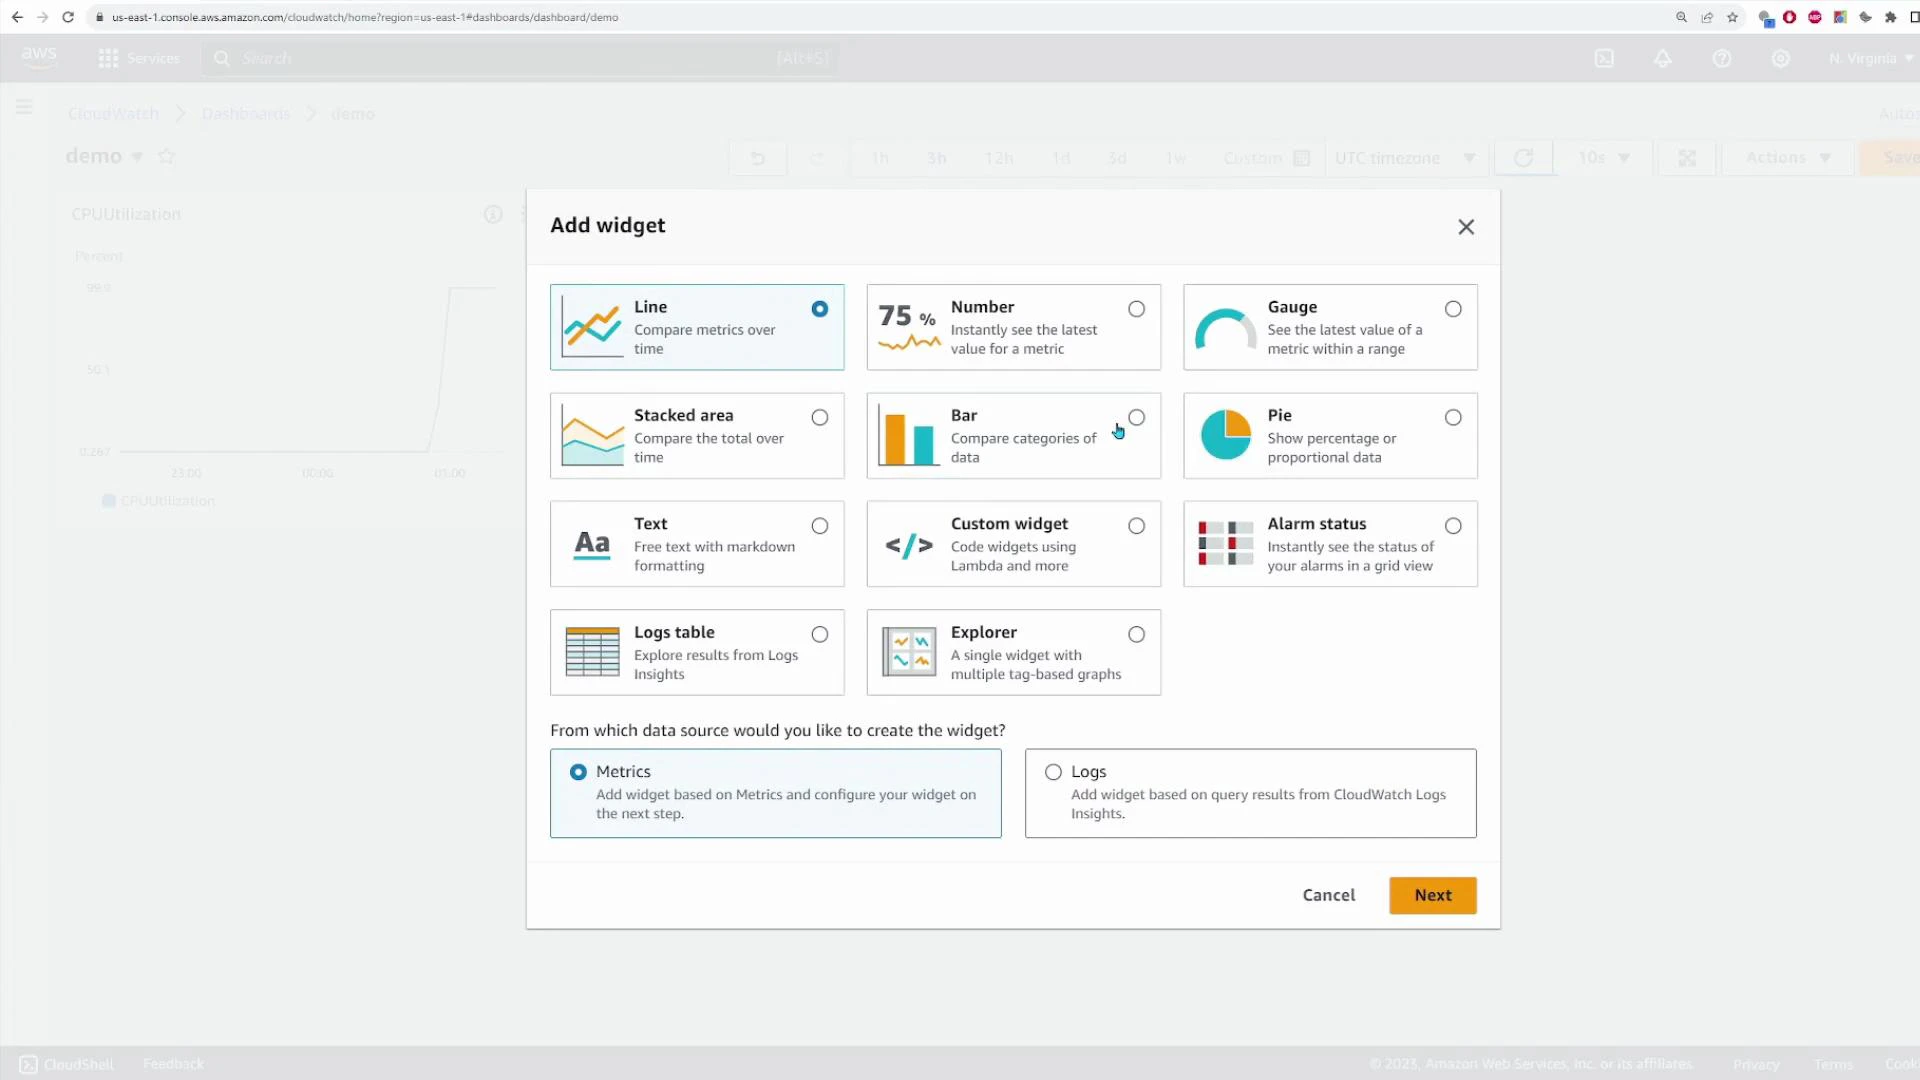 Example dashboard composition:
* Line widget: EC2 CPUUtilization
* Number widget: NetworkPacketsOut
* Logs widget: Lambda invocation errors
Name the dashboard (for example, `EC2-and-Lambda-overview`) and resize widgets to prioritize key metrics.
## CloudWatch Features at a Glance
| Feature | Purpose | When to use |
| -----------: | ------------------------------------- | ----------------------------------------------------- |
| Logs | Centralized log storage and search | Aggregate app/service logs and troubleshoot |
| Log Insights | Query and visualize logs | Analyze patterns, extract fields, and do aggregations |
| Live tail | Real-time log streaming | Immediate troubleshooting during deployments |
| Metrics | Time-series telemetry | Baseline performance and capacity planning |
| Alarms | Threshold-based notifications/actions | Auto-remediation or operator alerts |
| EventBridge | Event routing & scheduling | Event-driven architectures and automation |
| Dashboards | Custom monitoring views | Executive or ops single-pane-of-glass |
## Best practices
* Apply retention policies on log groups to control costs.
* Use structured JSON logging to simplify Logs Insights queries.
* Tag dashboards and metrics for easier filtering and access control.
* Route alarms to SNS topics for centralized notifications.
* Instrument services with X-Ray for distributed tracing across microservices.
## Summary
* CloudWatch centralizes logs, metrics, alarms, traces, events, and dashboards across your AWS account.
* Use Log groups and log streams to organize logs; leverage Live Tail and Logs Insights for real-time and query-based analysis.
* Metrics are the primary time-series signals; Alarms automate monitoring responses.
* EventBridge (CloudWatch Events) handles event routing to build event-driven systems.
* Dashboards provide consolidated visualizations to monitor applications and infrastructure.
Explore the CloudWatch console sections—Logs, Metrics, Alarms, Traces, Events, and Dashboards—to gain hands-on experience with each feature.
## Links and references
* CloudWatch documentation: [https://docs.aws.amazon.com/cloudwatch/](https://docs.aws.amazon.com/cloudwatch/)
* EventBridge user guide: [https://docs.aws.amazon.com/eventbridge/latest/userguide/](https://docs.aws.amazon.com/eventbridge/latest/userguide/)
* AWS X-Ray: [https://aws.amazon.com/xray/](https://aws.amazon.com/xray/)
* Best practices for logs and metrics: [https://docs.aws.amazon.com/whitepapers/](https://docs.aws.amazon.com/whitepapers/) (search CloudWatch best practices)
Example dashboard composition:
* Line widget: EC2 CPUUtilization
* Number widget: NetworkPacketsOut
* Logs widget: Lambda invocation errors
Name the dashboard (for example, `EC2-and-Lambda-overview`) and resize widgets to prioritize key metrics.
## CloudWatch Features at a Glance
| Feature | Purpose | When to use |
| -----------: | ------------------------------------- | ----------------------------------------------------- |
| Logs | Centralized log storage and search | Aggregate app/service logs and troubleshoot |
| Log Insights | Query and visualize logs | Analyze patterns, extract fields, and do aggregations |
| Live tail | Real-time log streaming | Immediate troubleshooting during deployments |
| Metrics | Time-series telemetry | Baseline performance and capacity planning |
| Alarms | Threshold-based notifications/actions | Auto-remediation or operator alerts |
| EventBridge | Event routing & scheduling | Event-driven architectures and automation |
| Dashboards | Custom monitoring views | Executive or ops single-pane-of-glass |
## Best practices
* Apply retention policies on log groups to control costs.
* Use structured JSON logging to simplify Logs Insights queries.
* Tag dashboards and metrics for easier filtering and access control.
* Route alarms to SNS topics for centralized notifications.
* Instrument services with X-Ray for distributed tracing across microservices.
## Summary
* CloudWatch centralizes logs, metrics, alarms, traces, events, and dashboards across your AWS account.
* Use Log groups and log streams to organize logs; leverage Live Tail and Logs Insights for real-time and query-based analysis.
* Metrics are the primary time-series signals; Alarms automate monitoring responses.
* EventBridge (CloudWatch Events) handles event routing to build event-driven systems.
* Dashboards provide consolidated visualizations to monitor applications and infrastructure.
Explore the CloudWatch console sections—Logs, Metrics, Alarms, Traces, Events, and Dashboards—to gain hands-on experience with each feature.
## Links and references
* CloudWatch documentation: [https://docs.aws.amazon.com/cloudwatch/](https://docs.aws.amazon.com/cloudwatch/)
* EventBridge user guide: [https://docs.aws.amazon.com/eventbridge/latest/userguide/](https://docs.aws.amazon.com/eventbridge/latest/userguide/)
* AWS X-Ray: [https://aws.amazon.com/xray/](https://aws.amazon.com/xray/)
* Best practices for logs and metrics: [https://docs.aws.amazon.com/whitepapers/](https://docs.aws.amazon.com/whitepapers/) (search CloudWatch best practices)