> ## Documentation Index
> Fetch the complete documentation index at: https://notes.kodekloud.com/llms.txt
> Use this file to discover all available pages before exploring further.
# Monitoring Options
> This article explores monitoring AWS Lambda using CloudWatch, Lambda Insights, AWS X-Ray, and VPC Flow Logs for troubleshooting and optimizing serverless applications.
In this lesson, we explore how to monitor AWS Lambda using Amazon CloudWatch, Lambda Insights, AWS X-Ray, and VPC Flow Logs. These tools provide metrics, logs, and tracing to help troubleshoot and optimize serverless applications at scale.
## Amazon CloudWatch Metrics
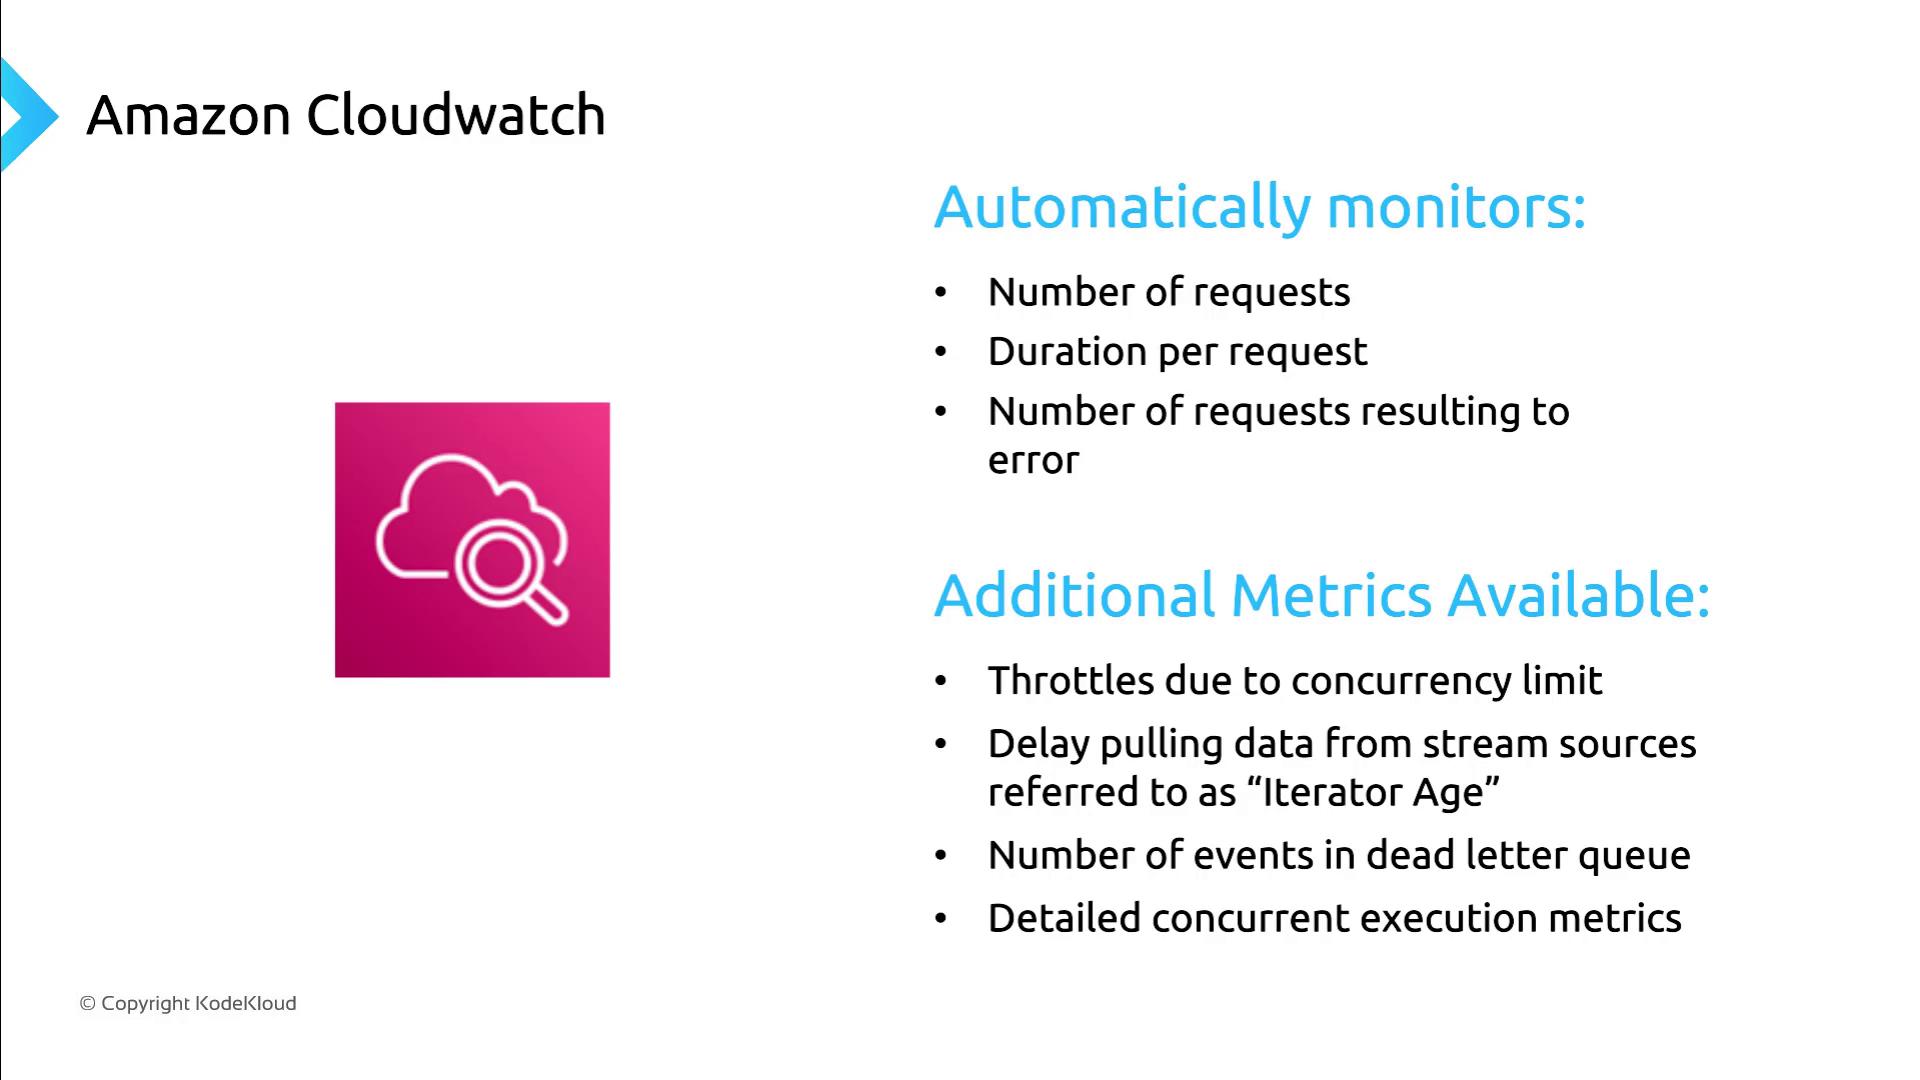
AWS Lambda automatically sends key performance metrics to [Amazon CloudWatch](https://aws.amazon.com/cloudwatch/), allowing you to track function execution, errors, and performance trends.
| Metric | Description | Default |
| -------------------- | ---------------------------------------------- | ------- |
| Invocations | Total number of function calls | ✔️ |
| Duration | Time taken per invocation (in milliseconds) | ✔️ |
| Errors | Number of failed invocations | ✔️ |
| Throttles | Invocations throttled due to concurrency limit | ☐ |
| IteratorAge | Lag time for stream-based event sources | ☐ |
| DeadLetterErrors | Failures delivering to a dead-letter queue | ☐ |
| ConcurrentExecutions | Real-time concurrency usage | ☐ |
To collect additional metrics, enable enhanced monitoring in your function’s configuration or use [AWS CLI](https://aws.amazon.com/cli/) / [AWS SDKs](https://aws.amazon.com/developer/tools/) to customize metric filters.
If you need an aggregated view across all functions, CloudWatch dashboards can display combined metrics and alert on threshold breaches:
## Lambda Insights
[Lambda Insights](https://docs.aws.amazon.com/AmazonCloudWatch/latest/monitoring/Lambda-Insights.html) extends CloudWatch with deeper visibility into function behavior, resource utilization, and performance anomalies.
Key benefits:
* Comprehensive dashboard for all functions in an AWS account or region
* Detailed per-function views of CPU, memory, disk, and network usage
* Customizable alerts on unusual trends or resource spikes

Use Lambda Insights to:
* Troubleshoot individual functions efficiently
* Analyze resource utilization over time
* Detect performance bottlenecks and anomalies
## AWS X-Ray Tracing
[AWS X-Ray](https://aws.amazon.com/xray/) provides distributed tracing for end-to-end request analysis. By instrumenting your Lambda functions with X-Ray, you can:
* Visualize service maps and trace requests through microservices
* Measure latency and identify performance hotspots
* Pinpoint errors across the execution flow
Enabling AWS X-Ray may incur additional costs and slight latency overhead. Evaluate tracing requirements before enabling in production.
## VPC Flow Logs for Network Monitoring
To capture TCP/IP-level details such as source and destination IP addresses, use [VPC Flow Logs](https://docs.aws.amazon.com/vpc/latest/userguide/flow-logs.html). Since Lambda functions run outside your VPC by default, you must configure them to run within a VPC to generate flow logs.
Steps to enable:
1. Attach your Lambda function to a VPC subnet and security group.
2. Create a VPC Flow Log to an Amazon CloudWatch Logs group or Amazon S3 bucket.
3. Analyze logs for network performance and security insights.
Ensure your Lambda execution role has permissions for both VPC configuration and flow log creation (`ec2:CreateFlowLogs`, `logs:CreateLogGroup`, `logs:PutLogEvents`).
## References
* [AWS Lambda Documentation](https://docs.aws.amazon.com/lambda/latest/dg/welcome.html)
* [Amazon CloudWatch Metrics](https://docs.aws.amazon.com/lambda/latest/dg/monitoring-metrics.html)
* [Lambda Insights Overview](https://docs.aws.amazon.com/AmazonCloudWatch/latest/monitoring/Lambda-Insights.html)
* [AWS X-Ray Developer Guide](https://docs.aws.amazon.com/xray/latest/devguide/aws-xray.html)
* [VPC Flow Logs User Guide](https://docs.aws.amazon.com/vpc/latest/userguide/flow-logs.html)