> ## Documentation Index
> Fetch the complete documentation index at: https://notes.kodekloud.com/llms.txt
> Use this file to discover all available pages before exploring further.
# Monitoring RDS databases
> Guidance on monitoring and alerting for AWS RDS including metrics, logs, Performance Insights, CloudWatch, Enhanced Monitoring, alerting best practices, and troubleshooting playbooks to maintain performance and availability
Hello and welcome back. In this lesson we focus on alerting and monitoring for managed relational databases (AWS RDS). Monitoring is critical: databases power most applications, and slow or unavailable databases quickly degrade user experience and increase costs. A layered monitoring strategy — metrics, logs, and query-level visibility — helps you detect issues early, diagnose root causes, and right-size infrastructure.
## Why monitor a cloud database?
* Proactive issue detection: surface small problems before they become outages with alerts and anomaly detection.
* Performance optimization: identify slow SQL, missing indexes, and resource bottlenecks to improve latency and throughput.
* Availability and reliability: track failover events, replica lag, and health checks to maintain SLAs.
* Capacity planning and cost control: use trends (CPU, memory, connections, I/O) to scale appropriately and reduce waste.
Example scenario
* If the DB CPU utilization consistently hovers around 80% on a general-purpose instance, monitoring shows evidence to move to a compute-optimized instance or scale read replicas. Trends and correlated query data make these decisions measurable rather than speculative.
Enable Performance Insights and relevant query logging (slow query logs, pg\_stat\_statements) to gain SQL-level context. These features improve troubleshooting but can add cost and storage overhead depending on retention.
## What to monitor
Track a mix of infrastructure and database-specific metrics, plus logs and query diagnostics.
| Metric / Signal | Purpose / What it indicates | Recommended alert guidance |
| ------------------------------ | ------------------------------------------------------------------------------------------------------: | ------------------------------------------------------------ |
| CPU utilization | High sustained CPU -> consider instance type or query optimization | Alert when > 75% for 5–15 minutes |
| Memory usage & swap | Memory pressure often leads to latency and swapping (requires Enhanced Monitoring for OS-level metrics) | Alert when free memory low or swap used |
| Read/write IOPS & latency | Storage contention causes slow queries and timeouts | Alert when I/O latency or queue depth spikes |
| Disk free space & throughput | Prevent outages from full disks | Alert when free space \< X% or \< Y GB |
| DB connections & churn | Too many connections or connection storms can exhaust resources | Alert on sustained connection count near max |
| Query latencies / slow queries | Identifies long-running or inefficient statements | Capture slow query logs and alert on threshold breaches |
| Failover / replication health | Replica lag or failed failovers affect HA and read scaling | Alert on replica lag > threshold or instance failover events |
## AWS tools for monitoring RDS
* Amazon CloudWatch\
Collects core RDS metrics (CPU, IOPS, latency, free storage, DB connections). Use CloudWatch Alarms and Dashboards for alerting and visual summaries. See CloudWatch metrics for Amazon RDS: [https://docs.aws.amazon.com/AmazonRDS/latest/UserGuide/monitoring-cloudwatch.html](https://docs.aws.amazon.com/AmazonRDS/latest/UserGuide/monitoring-cloudwatch.html)
* RDS Enhanced Monitoring\
Provides host-level (OS) metrics such as memory and swap. These metrics are published to CloudWatch Logs and are useful for diagnosing memory pressure and OS-level signals. More: [https://docs.aws.amazon.com/AmazonRDS/latest/UserGuide/USER\_Monitoring.OS.html](https://docs.aws.amazon.com/AmazonRDS/latest/UserGuide/USER_Monitoring.OS.html)
* RDS Performance Insights\
Offers a DB-optimized dashboard showing load, top SQL, waits, and historical patterns. Enable per instance for deep SQL-level visibility. More: [https://docs.aws.amazon.com/AmazonRDS/latest/UserGuide/USER\_PerfInsights.html](https://docs.aws.amazon.com/AmazonRDS/latest/UserGuide/USER_PerfInsights.html)
* Database engine logs and query instrumentation
* MySQL: general and slow query logs
* PostgreSQL: pg\_stat\_statements, log\_min\_duration\_statement\
Export logs to CloudWatch Logs or S3 for retention, searching, and integration with alerting.
* RDS Recommendations & Trusted Advisor\
RDS console may surface sizing or configuration recommendations; review these to improve cost and performance.
### Quick examples (AWS CLI)
Create a CloudWatch alarm for CPU utilization:
```Expected Output: theme={null}
bash
aws cloudwatch put-metric-alarm \
--alarm-name "RDS-High-CPU" \
--metric-name CPUUtilization \
--namespace AWS/RDS \
--dimensions Name=DBInstanceIdentifier,Value=my-db-instance \
--statistic Average \
--period 300 --evaluation-periods 3 \
--threshold 75 --comparison-operator GreaterThanOrEqualToThreshold \
--alarm-actions arn:aws:sns:us-east-1:123456789012:notify-team
```
Enable Enhanced Monitoring on a DB instance:
```AWS CLI theme={null}
aws rds modify-db-instance \
--db-instance-identifier my-db-instance \
--monitoring-interval 60 \
--monitoring-role-arn arn:aws:iam::123456789012:role/rds-monitoring-role \
--apply-immediately
```
## Alerts and playbooks
Design alerts to be actionable and reduce noise:
* Prefer multi-period or anomaly-based alerts to avoid false positives (e.g., sustained 5–15 minutes).
* Correlate alerts across metrics (CPU + I/O + slow queries) to prioritize root cause.
* Create runbooks for common alerts: slow queries, replica lag, full storage, connection storms, and failover events.
* Channel alerts to the right teams (DBA, platform, on-call) and include recovery steps.
Enabling Performance Insights, increased log retention, or high-frequency monitoring can increase costs. Review retention settings and retention policies to balance visibility and expense.
## Monitoring goals (summary)
* Detect anomalies before users are impacted.
* Reduce mean time to resolution (MTTR) using correlated metrics and query-level data.
* Maintain availability through automated failover monitoring and replica health checks.
* Optimize capacity and costs with trend-driven scaling decisions.
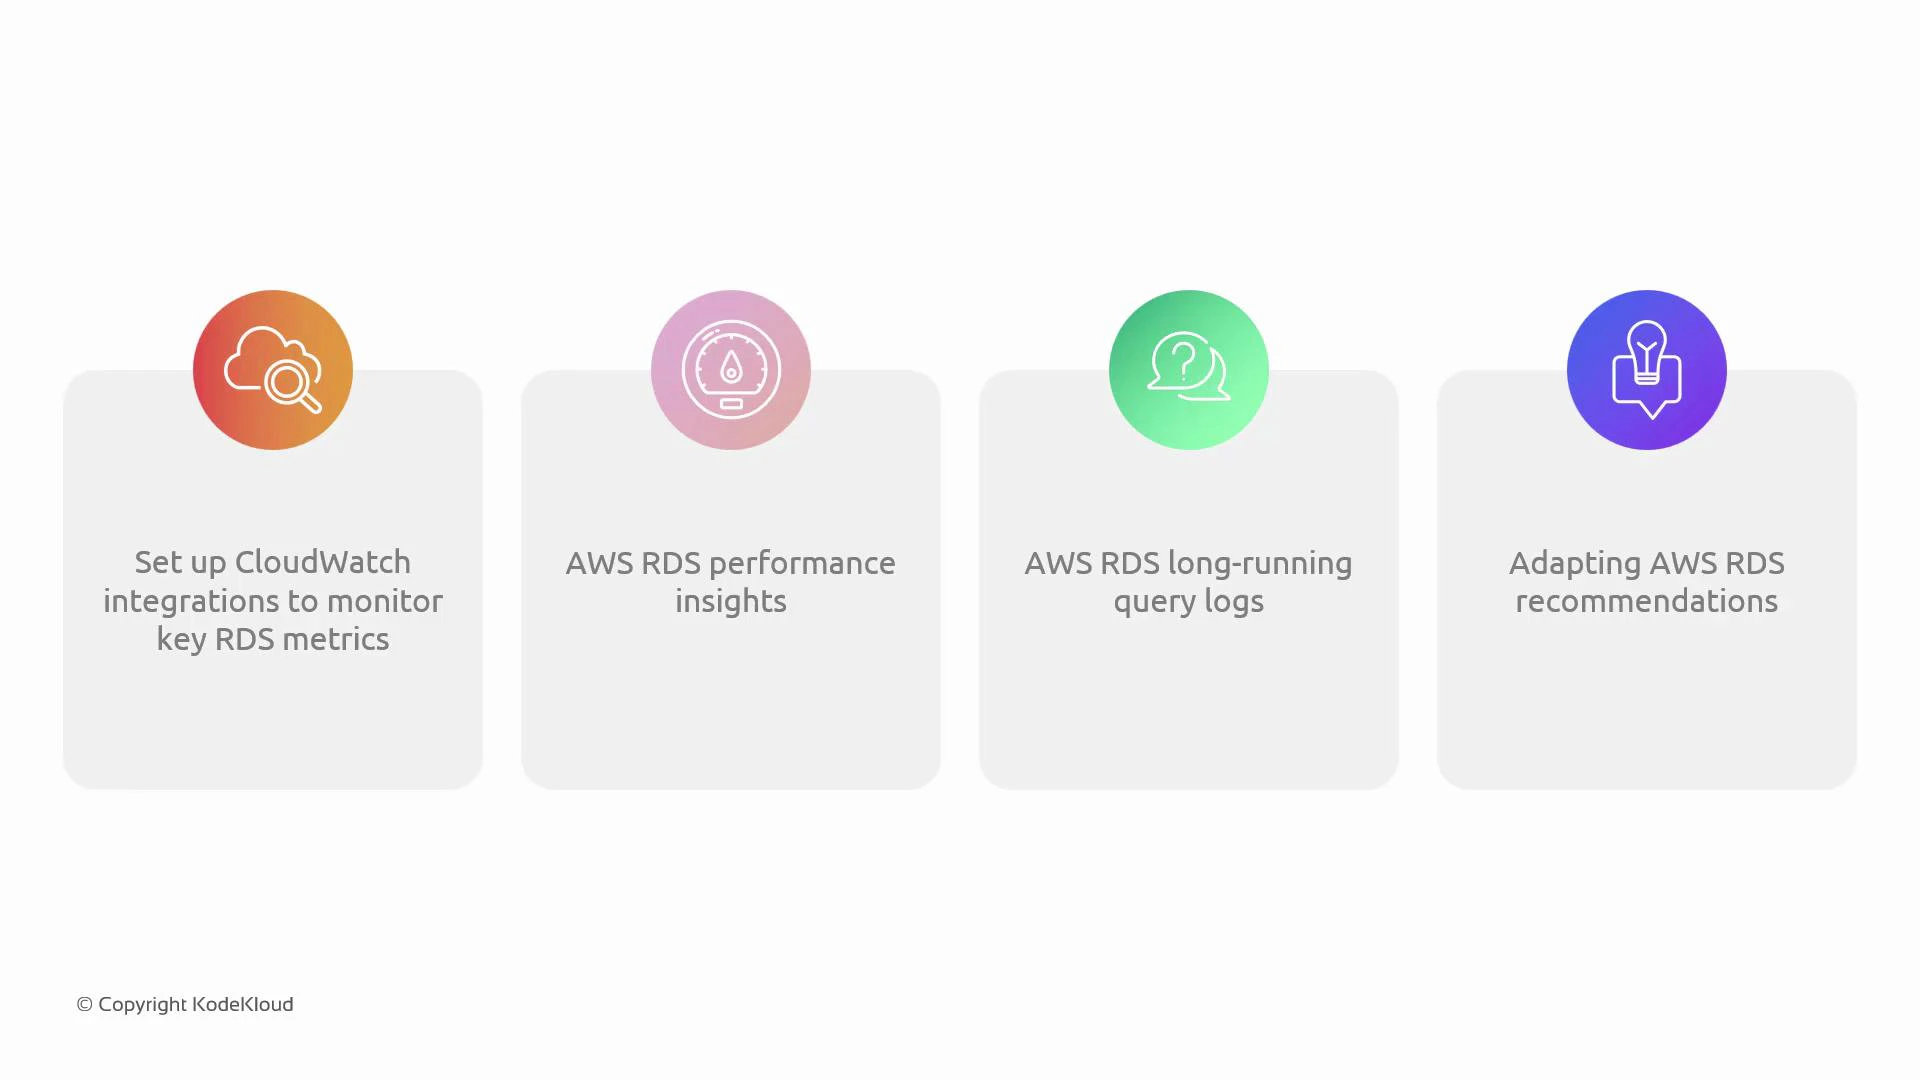
To practice these concepts, run hands-on labs that:
* Enable Enhanced Monitoring and Performance Insights on an RDS instance.
* Configure CloudWatch Alarms and Dashboards.
* Capture slow query logs and analyze top offenders.
* Execute an incident runbook for a simulated replication lag or CPU spike.
 ## Links and references
* Amazon RDS Monitoring with Amazon CloudWatch: [https://docs.aws.amazon.com/AmazonRDS/latest/UserGuide/monitoring-cloudwatch.html](https://docs.aws.amazon.com/AmazonRDS/latest/UserGuide/monitoring-cloudwatch.html)
* RDS Enhanced Monitoring: [https://docs.aws.amazon.com/AmazonRDS/latest/UserGuide/USER\_Monitoring.OS.html](https://docs.aws.amazon.com/AmazonRDS/latest/UserGuide/USER_Monitoring.OS.html)
* RDS Performance Insights: [https://docs.aws.amazon.com/AmazonRDS/latest/UserGuide/USER\_PerfInsights.html](https://docs.aws.amazon.com/AmazonRDS/latest/UserGuide/USER_PerfInsights.html)
* CloudWatch Logs: [https://docs.aws.amazon.com/AmazonCloudWatch/latest/logs/WhatIsCloudWatchLogs.html](https://docs.aws.amazon.com/AmazonCloudWatch/latest/logs/WhatIsCloudWatchLogs.html)
Next steps: enable monitoring on a test instance, create a dashboard and alerts, and review slow query reports to build a prioritized remediation list.
## Links and references
* Amazon RDS Monitoring with Amazon CloudWatch: [https://docs.aws.amazon.com/AmazonRDS/latest/UserGuide/monitoring-cloudwatch.html](https://docs.aws.amazon.com/AmazonRDS/latest/UserGuide/monitoring-cloudwatch.html)
* RDS Enhanced Monitoring: [https://docs.aws.amazon.com/AmazonRDS/latest/UserGuide/USER\_Monitoring.OS.html](https://docs.aws.amazon.com/AmazonRDS/latest/UserGuide/USER_Monitoring.OS.html)
* RDS Performance Insights: [https://docs.aws.amazon.com/AmazonRDS/latest/UserGuide/USER\_PerfInsights.html](https://docs.aws.amazon.com/AmazonRDS/latest/UserGuide/USER_PerfInsights.html)
* CloudWatch Logs: [https://docs.aws.amazon.com/AmazonCloudWatch/latest/logs/WhatIsCloudWatchLogs.html](https://docs.aws.amazon.com/AmazonCloudWatch/latest/logs/WhatIsCloudWatchLogs.html)
Next steps: enable monitoring on a test instance, create a dashboard and alerts, and review slow query reports to build a prioritized remediation list.