> ## Documentation Index
> Fetch the complete documentation index at: https://notes.kodekloud.com/llms.txt
> Use this file to discover all available pages before exploring further.
# Performance Insights
> Guide to using AWS RDS Performance Insights with Aurora PostgreSQL to populate a demo database, generate load, inspect top SQL and diagnose query performance
Welcome back.
In this lesson we'll explore how to use AWS RDS Performance Insights to diagnose database activity and improve query performance for Aurora PostgreSQL. We'll cover how to populate a demo database, where to find the key metrics in the console, and how to generate load so you can observe query-level activity in Performance Insights.
## Prepare the demo database
I created an Aurora PostgreSQL cluster with one writer instance and made it accessible from my network. I copied the username, password, and endpoint to a secure note so I can connect using the Query Editor or a client.
Open a new SQL script in the Query Editor (or use psql) and run the following statements in sequence: first run the CREATE TABLE statements, then run the INSERT statements. This will give you a simple Customers/Orders dataset to exercise queries.
```sql theme={null}
-- Create Customers table
CREATE TABLE Customers (
CustomerID SERIAL PRIMARY KEY,
CustomerName VARCHAR(255),
ContactName VARCHAR(255),
Country VARCHAR(255),
Email VARCHAR(255)
);
-- Create Orders table
CREATE TABLE Orders (
OrderID SERIAL PRIMARY KEY,
CustomerID INT,
OrderDate DATE,
ProductName VARCHAR(255),
Quantity INT,
FOREIGN KEY (CustomerID) REFERENCES Customers(CustomerID)
);
-- Insert data into Customers
INSERT INTO Customers (CustomerName, ContactName, Country, Email) VALUES
('John Doe', 'John', 'USA', 'john.doe@example.com'),
('Jane Doe', 'Jane', 'UK', 'jane.doe@example.com'),
('Emily Smith', 'Emily', 'Canada', 'emily.smith@example.com');
-- Insert data into Orders
INSERT INTO Orders (CustomerID, OrderDate, ProductName, Quantity) VALUES
(1, '2023-08-01', 'Laptop', 2),
(1, '2023-08-10', 'Smartphone', 1),
(2, '2023-07-22', 'TV', 1),
(3, '2023-08-15', 'Camera', 2);
```
Run the statements in the order shown (CREATE TABLEs first, then INSERTs). After the script completes you'll have basic data to generate test queries and observe Performance Insights.
## Performance Insights overview
Performance Insights gives a dimensional view of database load at the SQL level. It surfaces top SQL by load, execution time, and average active sessions (AAS), and it shows which users, hosts, or applications are issuing those queries. Performance Insights must be enabled for your DB instance (either at creation or enabled later). Note that enabling Performance Insights can affect costs depending on retention and usage.
Before continuing: ensure Performance Insights is enabled for your instance and review pricing/retention options. See the AWS docs for details on enabling Performance Insights and storage costs.
When you open your DB instance in the AWS Management Console and select Monitoring, you'll see standard RDS/CloudWatch metrics like CPUUtilization and DatabaseConnections. When Performance Insights is enabled, additional dimensional metrics (for example DBLoad, top SQL, and breakdowns by user/host) become available and provide deeper visibility into query-level activity.
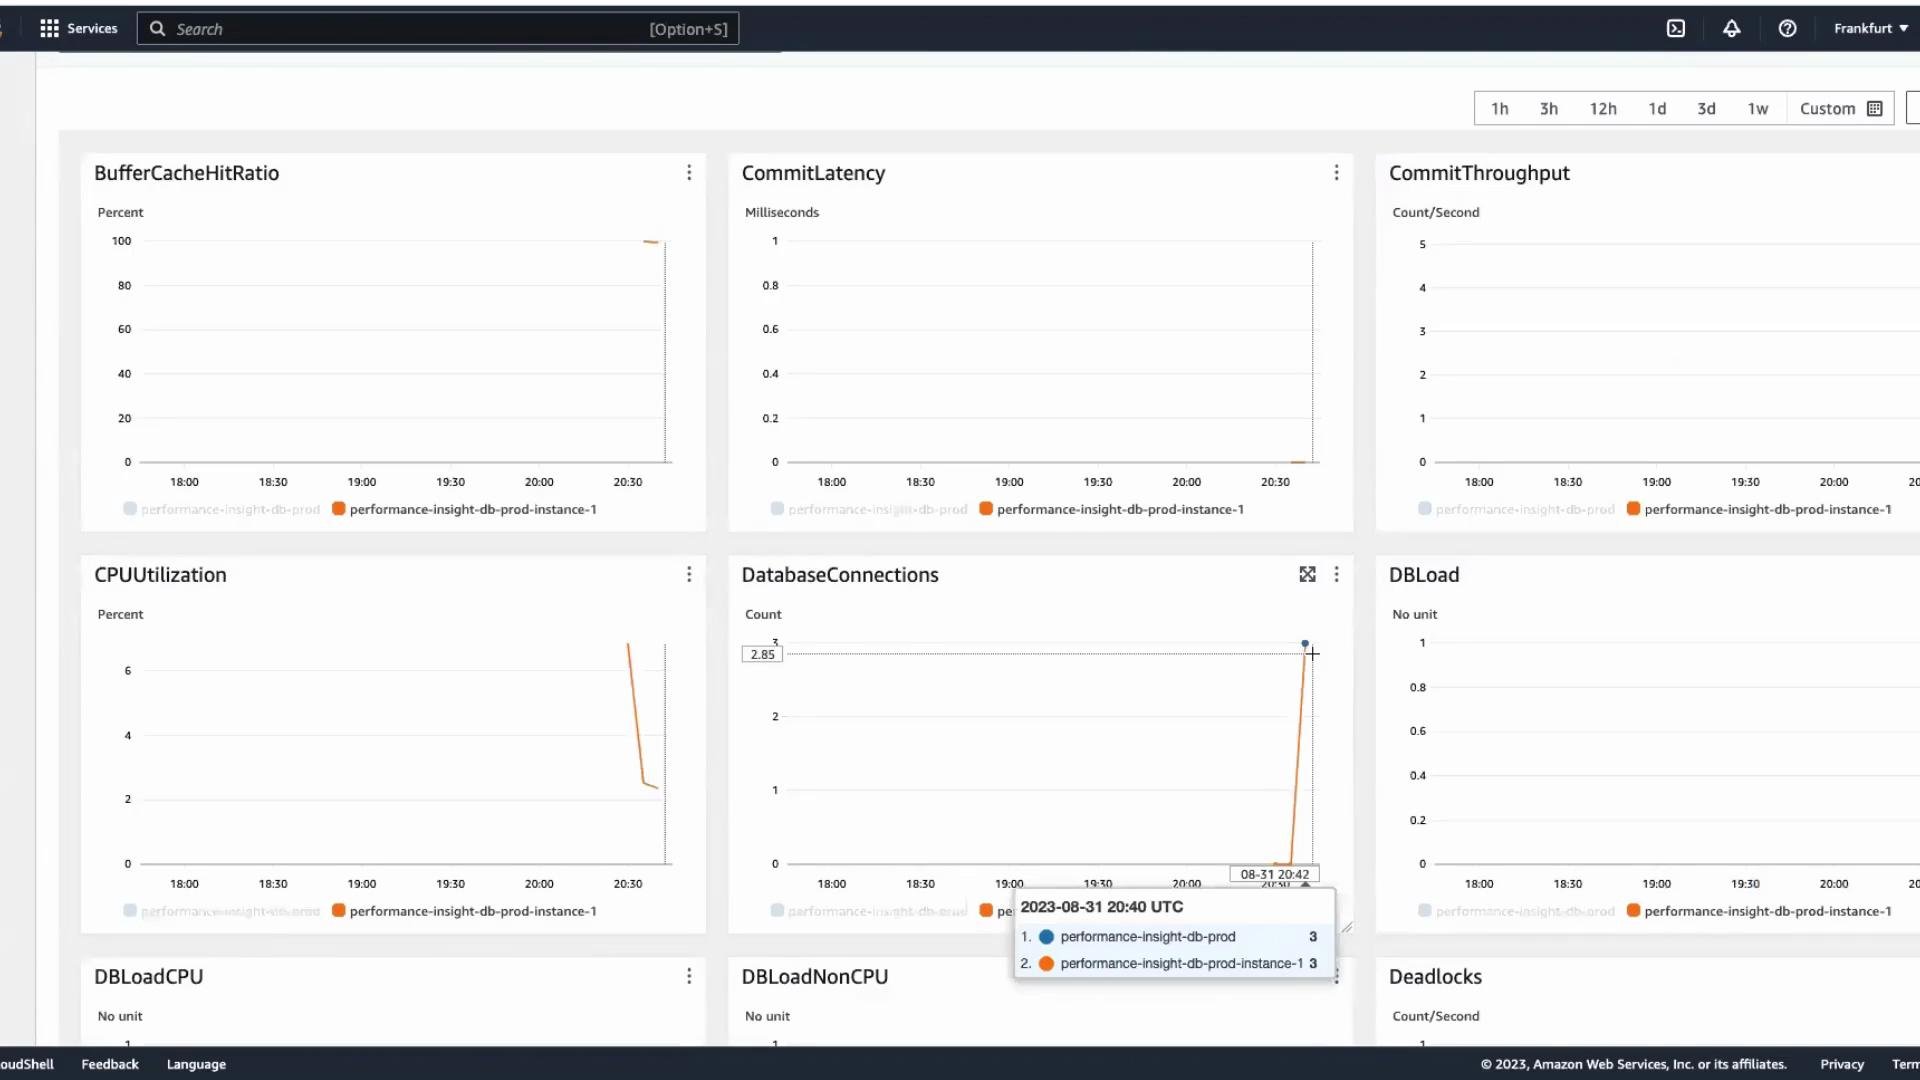 In the console you can inspect connection counts and CPU utilization at the instance level. To get detailed, dimensional information (top SQL, execution time, sessions, top users, application names, etc.) open Performance Insights for the selected database instance.
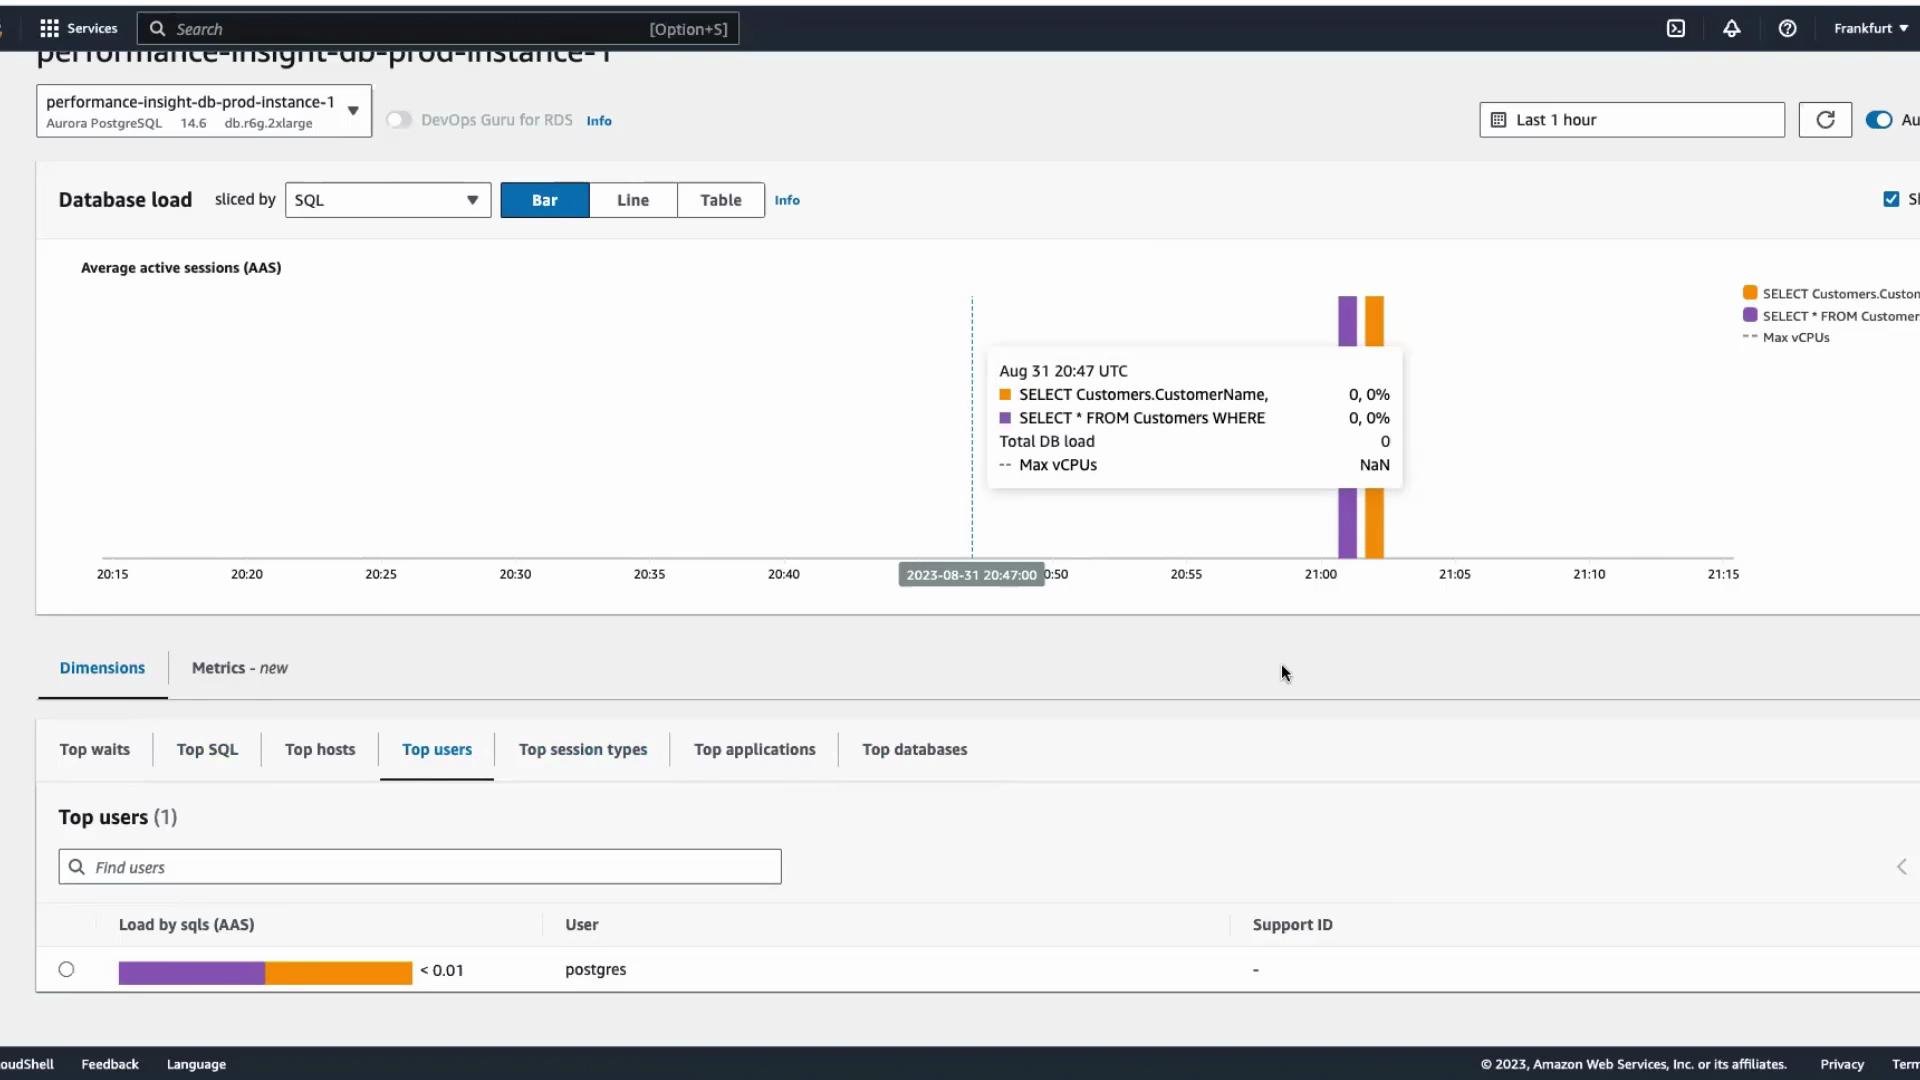
Performance Insights displays:
* Top SQL statements by load (AAS).
* SQL text and execution samples.
* Which database user, host, or application issued the query.
* A timeline of DBLoad so you can correlate spikes with specific queries or clients.
In the console you can inspect connection counts and CPU utilization at the instance level. To get detailed, dimensional information (top SQL, execution time, sessions, top users, application names, etc.) open Performance Insights for the selected database instance.
Performance Insights displays:
* Top SQL statements by load (AAS).
* SQL text and execution samples.
* Which database user, host, or application issued the query.
* A timeline of DBLoad so you can correlate spikes with specific queries or clients.
 ### Quick reference — what to look for in Performance Insights
| Metric / View | Purpose | How it helps |
| ----------------------------------- | ------------------------------------- | ---------------------------------------------- |
| DBLoad (AAS) | Active sessions over time | Identify periods of contention and heavy load |
| Top SQL | Statements contributing most load | Finds expensive queries to optimize |
| Top users / hosts / apps | Source of load | Pinpoint clients or services causing issues |
| SQL text & samples | Full query text and execution details | Use for rewriting queries or adding indexes |
| Standard metrics (CPU, connections) | Instance-level health | Correlate resource utilization with query load |
## Generate load to observe query activity
To demonstrate Performance Insights capturing query activity, generate concurrent load that mixes simple point selects and heavier aggregation queries. The Python script below creates multiple threads; each thread opens a persistent connection and repeatedly runs a simple SELECT and a JOIN+aggregation.
Replace the db\_params values (dbname, user, password, host, port) with the connection details for your own Aurora instance before running the script.
```python theme={null}
import threading
import psycopg2
import time
import random
# Database connection parameters (replace with your values)
db_params = {
'dbname': 'testdb',
'user': 'postgres',
'password': 'Nqb17STYtto4v9IstLez',
'host': 'performance-insight-db-prod.cluster-caywlfxrbtml.eu-central-1.rds.amazonaws.com',
'port': '5432'
}
def run_query(thread_id):
conn = None
cur = None
try:
conn = psycopg2.connect(**db_params)
cur = conn.cursor()
print(f"Thread-{thread_id} connected to the database.")
while True:
# Simple Query
cur.execute("SELECT * FROM Customers WHERE Country = 'USA';")
simple_records = cur.fetchall()
print(f"Thread-{thread_id} fetched {len(simple_records)} records from Simple Query.")
# Complex Query: join + aggregation
cur.execute("""
SELECT C.CustomerName, COUNT(O.OrderID) AS NumberOfOrders
FROM Customers C
LEFT JOIN Orders O ON C.CustomerID = O.CustomerID
WHERE C.Country = 'USA'
GROUP BY C.CustomerName;
""")
complex_records = cur.fetchall()
print(f"Thread-{thread_id} fetched {len(complex_records)} records from Complex Query.")
# Sleep randomly between 1 and 3 seconds to spread queries
time.sleep(random.uniform(1, 3))
except Exception as e:
print(f"Thread-{thread_id} encountered an error: {e}")
finally:
if cur:
cur.close()
if conn:
conn.close()
print(f"Thread-{thread_id} connection closed.")
def main(thread_count=10):
threads = []
for i in range(1, thread_count + 1):
t = threading.Thread(target=run_query, args=(i,), daemon=True)
threads.append(t)
t.start()
try:
# Keep the main thread alive while worker threads run
while True:
time.sleep(1)
except KeyboardInterrupt:
print("Stopping load generation...")
if __name__ == "__main__":
main(thread_count=10)
```
Key points about the script:
* Default is 10 concurrent threads (adjust with main(thread\_count=N)).
* Each thread opens one persistent connection and alternates between a simple point-select and a JOIN+GROUP BY aggregation.
* Random short sleeps create staggered query timing so load is spread out.
* Threads are daemonized in this example; for graceful shutdown in production use non-daemon threads with a stop flag and join.
Sample terminal output (threads interleave):
```text theme={null}
Thread-1 connected to the database.
Thread-2 connected to the database.
Thread-1 fetched 1 records from Simple Query.
Thread-2 fetched 1 records from Simple Query.
Thread-1 fetched 1 records from Complex Query.
Thread-2 fetched 1 records from Complex Query.
Thread-3 connected to the database.
Thread-3 fetched 1 records from Simple Query.
...
```
After the script is running, open Performance Insights in the AWS Console. Within a few minutes you should see the SQL statements show up in Top SQL and DBLoad will reflect the generated activity. Use the dashboard to:
* Identify the queries contributing most AAS.
* See which user/host is causing load spikes.
* Inspect SQL text and execution samples to plan optimizations (rewrite, indexing, or parameterization).
* Correlate DBLoad spikes with instance-level metrics like CPUUtilization or DatabaseConnections.
## Further reading and references
* [AWS Performance Insights documentation](https://docs.aws.amazon.com/AmazonRDS/latest/UserGuide/USER_PerfInsights.html)
* [Amazon Aurora (PostgreSQL) documentation](https://docs.aws.amazon.com/AmazonRDS/latest/AuroraUserGuide/CHAP_AuroraOverview.html)
* [RDS Monitoring and metrics](https://docs.aws.amazon.com/AmazonRDS/latest/UserGuide/MonitoringOverview.html)
I hope this lesson clarified how to use AWS RDS Performance Insights to monitor query-level performance on Aurora PostgreSQL. See you in the next lesson.
### Quick reference — what to look for in Performance Insights
| Metric / View | Purpose | How it helps |
| ----------------------------------- | ------------------------------------- | ---------------------------------------------- |
| DBLoad (AAS) | Active sessions over time | Identify periods of contention and heavy load |
| Top SQL | Statements contributing most load | Finds expensive queries to optimize |
| Top users / hosts / apps | Source of load | Pinpoint clients or services causing issues |
| SQL text & samples | Full query text and execution details | Use for rewriting queries or adding indexes |
| Standard metrics (CPU, connections) | Instance-level health | Correlate resource utilization with query load |
## Generate load to observe query activity
To demonstrate Performance Insights capturing query activity, generate concurrent load that mixes simple point selects and heavier aggregation queries. The Python script below creates multiple threads; each thread opens a persistent connection and repeatedly runs a simple SELECT and a JOIN+aggregation.
Replace the db\_params values (dbname, user, password, host, port) with the connection details for your own Aurora instance before running the script.
```python theme={null}
import threading
import psycopg2
import time
import random
# Database connection parameters (replace with your values)
db_params = {
'dbname': 'testdb',
'user': 'postgres',
'password': 'Nqb17STYtto4v9IstLez',
'host': 'performance-insight-db-prod.cluster-caywlfxrbtml.eu-central-1.rds.amazonaws.com',
'port': '5432'
}
def run_query(thread_id):
conn = None
cur = None
try:
conn = psycopg2.connect(**db_params)
cur = conn.cursor()
print(f"Thread-{thread_id} connected to the database.")
while True:
# Simple Query
cur.execute("SELECT * FROM Customers WHERE Country = 'USA';")
simple_records = cur.fetchall()
print(f"Thread-{thread_id} fetched {len(simple_records)} records from Simple Query.")
# Complex Query: join + aggregation
cur.execute("""
SELECT C.CustomerName, COUNT(O.OrderID) AS NumberOfOrders
FROM Customers C
LEFT JOIN Orders O ON C.CustomerID = O.CustomerID
WHERE C.Country = 'USA'
GROUP BY C.CustomerName;
""")
complex_records = cur.fetchall()
print(f"Thread-{thread_id} fetched {len(complex_records)} records from Complex Query.")
# Sleep randomly between 1 and 3 seconds to spread queries
time.sleep(random.uniform(1, 3))
except Exception as e:
print(f"Thread-{thread_id} encountered an error: {e}")
finally:
if cur:
cur.close()
if conn:
conn.close()
print(f"Thread-{thread_id} connection closed.")
def main(thread_count=10):
threads = []
for i in range(1, thread_count + 1):
t = threading.Thread(target=run_query, args=(i,), daemon=True)
threads.append(t)
t.start()
try:
# Keep the main thread alive while worker threads run
while True:
time.sleep(1)
except KeyboardInterrupt:
print("Stopping load generation...")
if __name__ == "__main__":
main(thread_count=10)
```
Key points about the script:
* Default is 10 concurrent threads (adjust with main(thread\_count=N)).
* Each thread opens one persistent connection and alternates between a simple point-select and a JOIN+GROUP BY aggregation.
* Random short sleeps create staggered query timing so load is spread out.
* Threads are daemonized in this example; for graceful shutdown in production use non-daemon threads with a stop flag and join.
Sample terminal output (threads interleave):
```text theme={null}
Thread-1 connected to the database.
Thread-2 connected to the database.
Thread-1 fetched 1 records from Simple Query.
Thread-2 fetched 1 records from Simple Query.
Thread-1 fetched 1 records from Complex Query.
Thread-2 fetched 1 records from Complex Query.
Thread-3 connected to the database.
Thread-3 fetched 1 records from Simple Query.
...
```
After the script is running, open Performance Insights in the AWS Console. Within a few minutes you should see the SQL statements show up in Top SQL and DBLoad will reflect the generated activity. Use the dashboard to:
* Identify the queries contributing most AAS.
* See which user/host is causing load spikes.
* Inspect SQL text and execution samples to plan optimizations (rewrite, indexing, or parameterization).
* Correlate DBLoad spikes with instance-level metrics like CPUUtilization or DatabaseConnections.
## Further reading and references
* [AWS Performance Insights documentation](https://docs.aws.amazon.com/AmazonRDS/latest/UserGuide/USER_PerfInsights.html)
* [Amazon Aurora (PostgreSQL) documentation](https://docs.aws.amazon.com/AmazonRDS/latest/AuroraUserGuide/CHAP_AuroraOverview.html)
* [RDS Monitoring and metrics](https://docs.aws.amazon.com/AmazonRDS/latest/UserGuide/MonitoringOverview.html)
I hope this lesson clarified how to use AWS RDS Performance Insights to monitor query-level performance on Aurora PostgreSQL. See you in the next lesson.