> ## Documentation Index
> Fetch the complete documentation index at: https://notes.kodekloud.com/llms.txt
> Use this file to discover all available pages before exploring further.
# Grafana
> Grafana is a tool for visualizing metrics and creating interactive dashboards, enhancing data visualization through integration with services like CloudWatch and Prometheus.
Grafana is a robust tool for visualizing metrics and creating interactive dashboards. In this guide, we explore how Grafana enhances data visualization by integrating with services like [CloudWatch](https://learn.kodekloud.com/user/courses/aws-cloudwatch) and Prometheus, providing more customization and analytics than the default UIs available in these services.
Previously, we discussed monitoring solutions such as [CloudWatch](https://learn.kodekloud.com/user/courses/aws-cloudwatch) and Prometheus that collect metrics from various AWS services and applications. While [CloudWatch](https://learn.kodekloud.com/user/courses/aws-cloudwatch) offers basic log and metric viewing, it falls short for advanced dashboard creation. Grafana fills this gap by querying metrics from [CloudWatch](https://learn.kodekloud.com/user/courses/aws-cloudwatch) (or Prometheus) and rendering them into human-friendly visualizations.
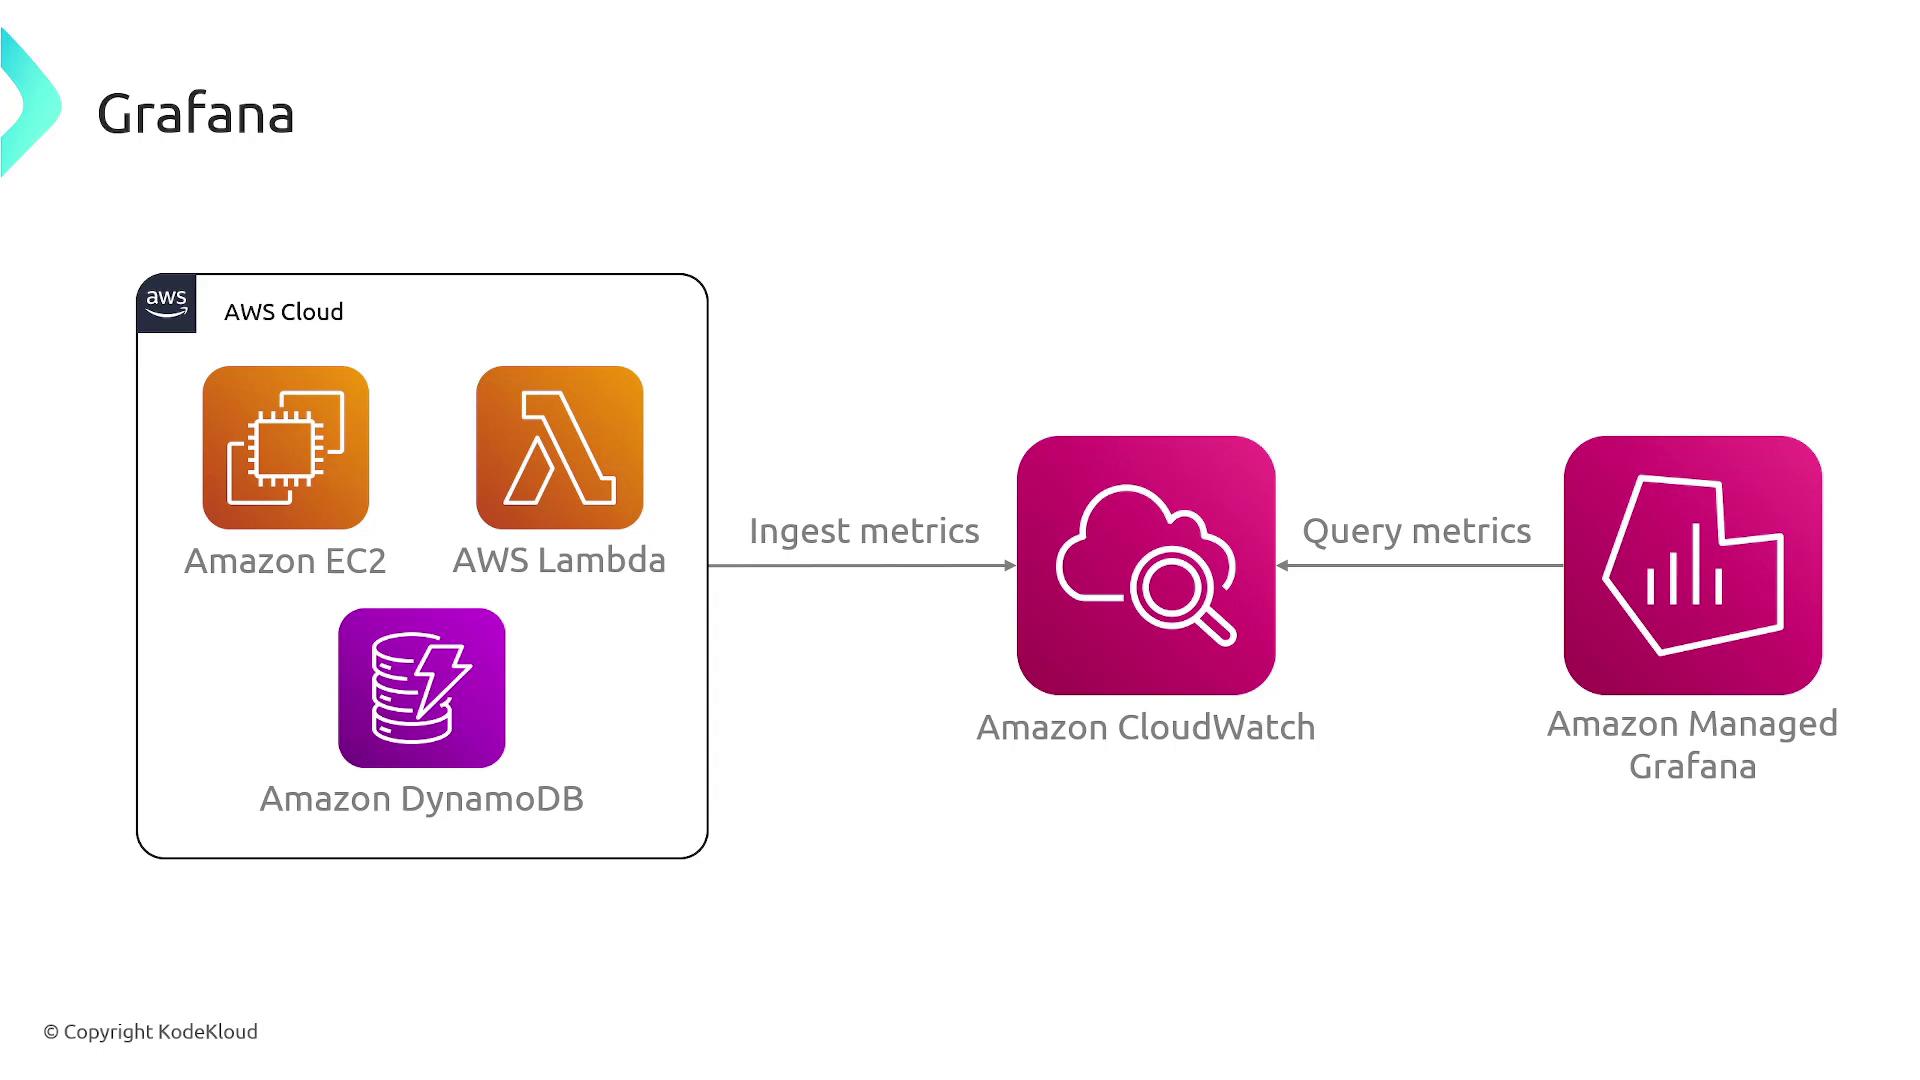
Grafana empowers you to build custom dashboards that consolidate critical metrics on a single page. Unlike the basic UI provided by [CloudWatch](https://learn.kodekloud.com/user/courses/aws-cloudwatch), Grafana is engineered for advanced analytics and visualization. This benefit applies equally when using Prometheus as your metrics backend—Grafana’s intuitive interface turns complex data into accessible insights.
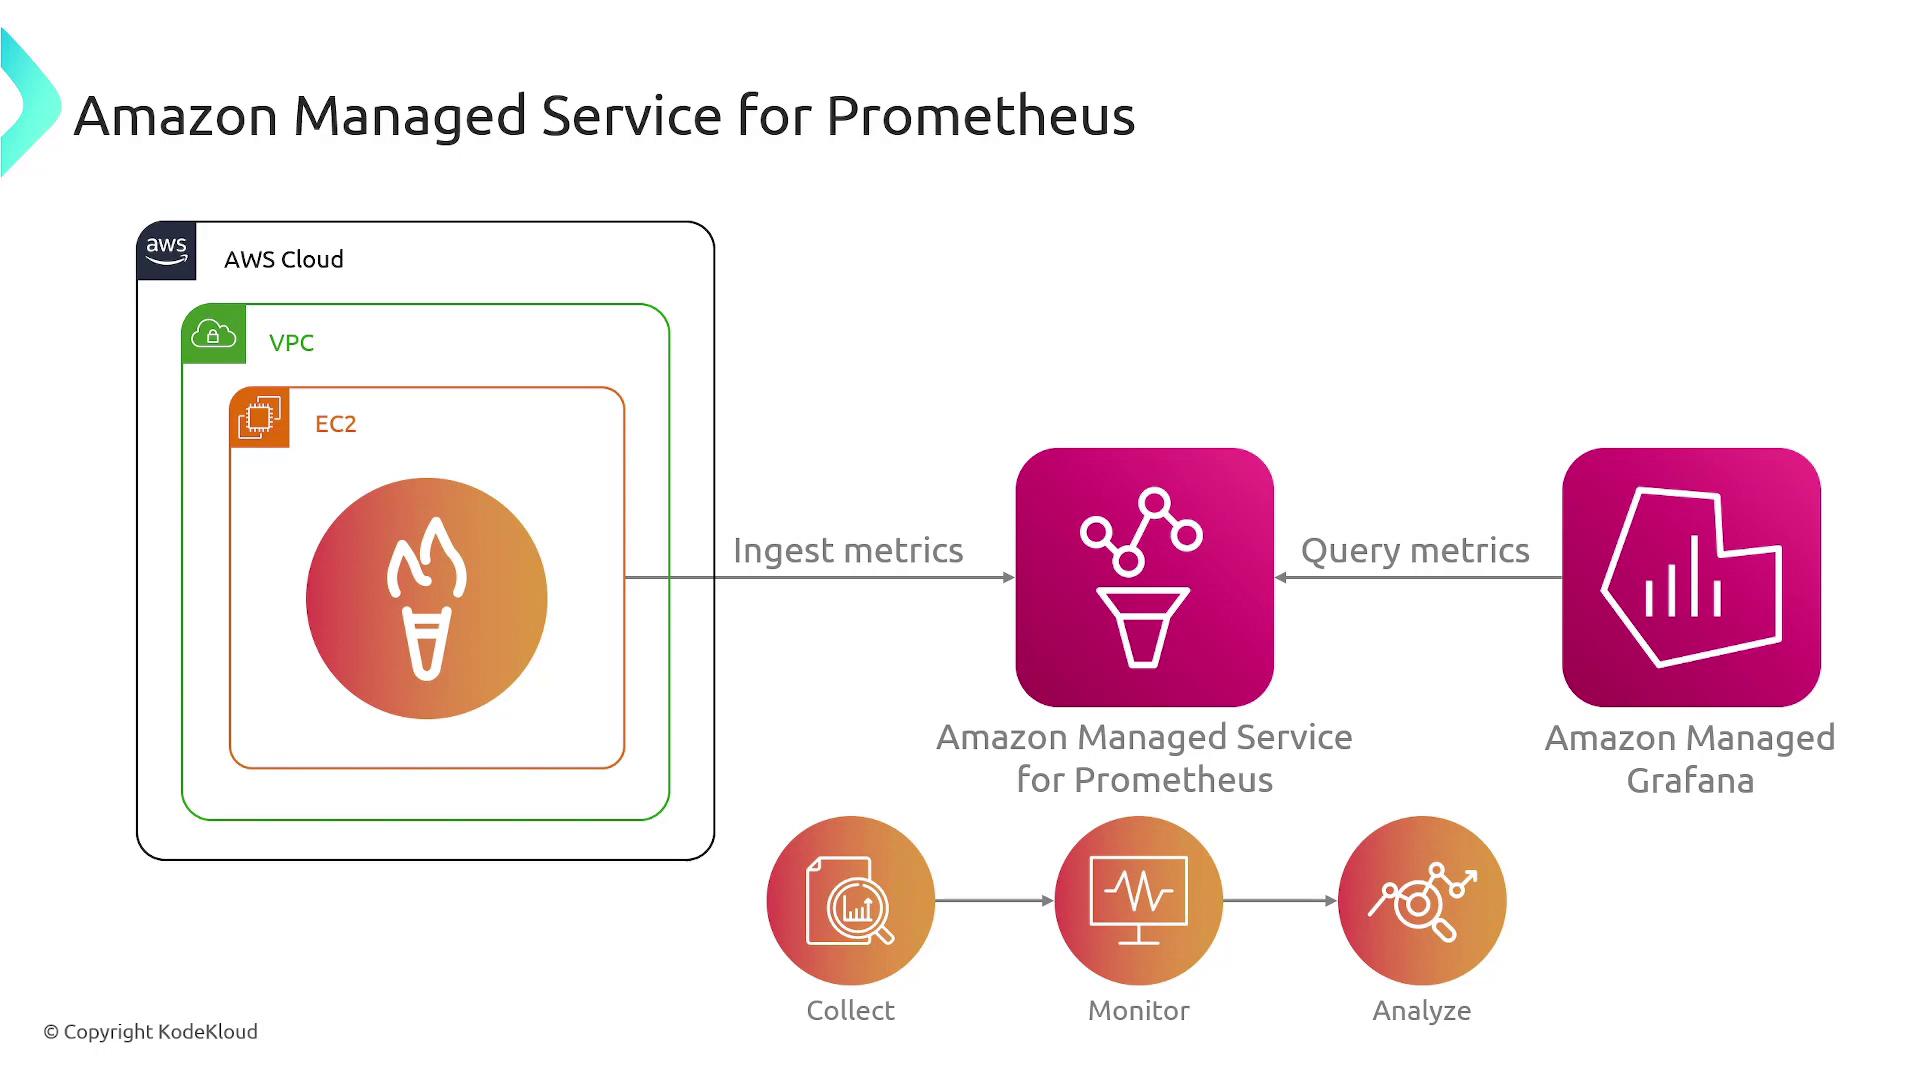
Grafana transforms raw metrics into interactive and visually appealing dashboards, enabling you to monitor system performance effectively.
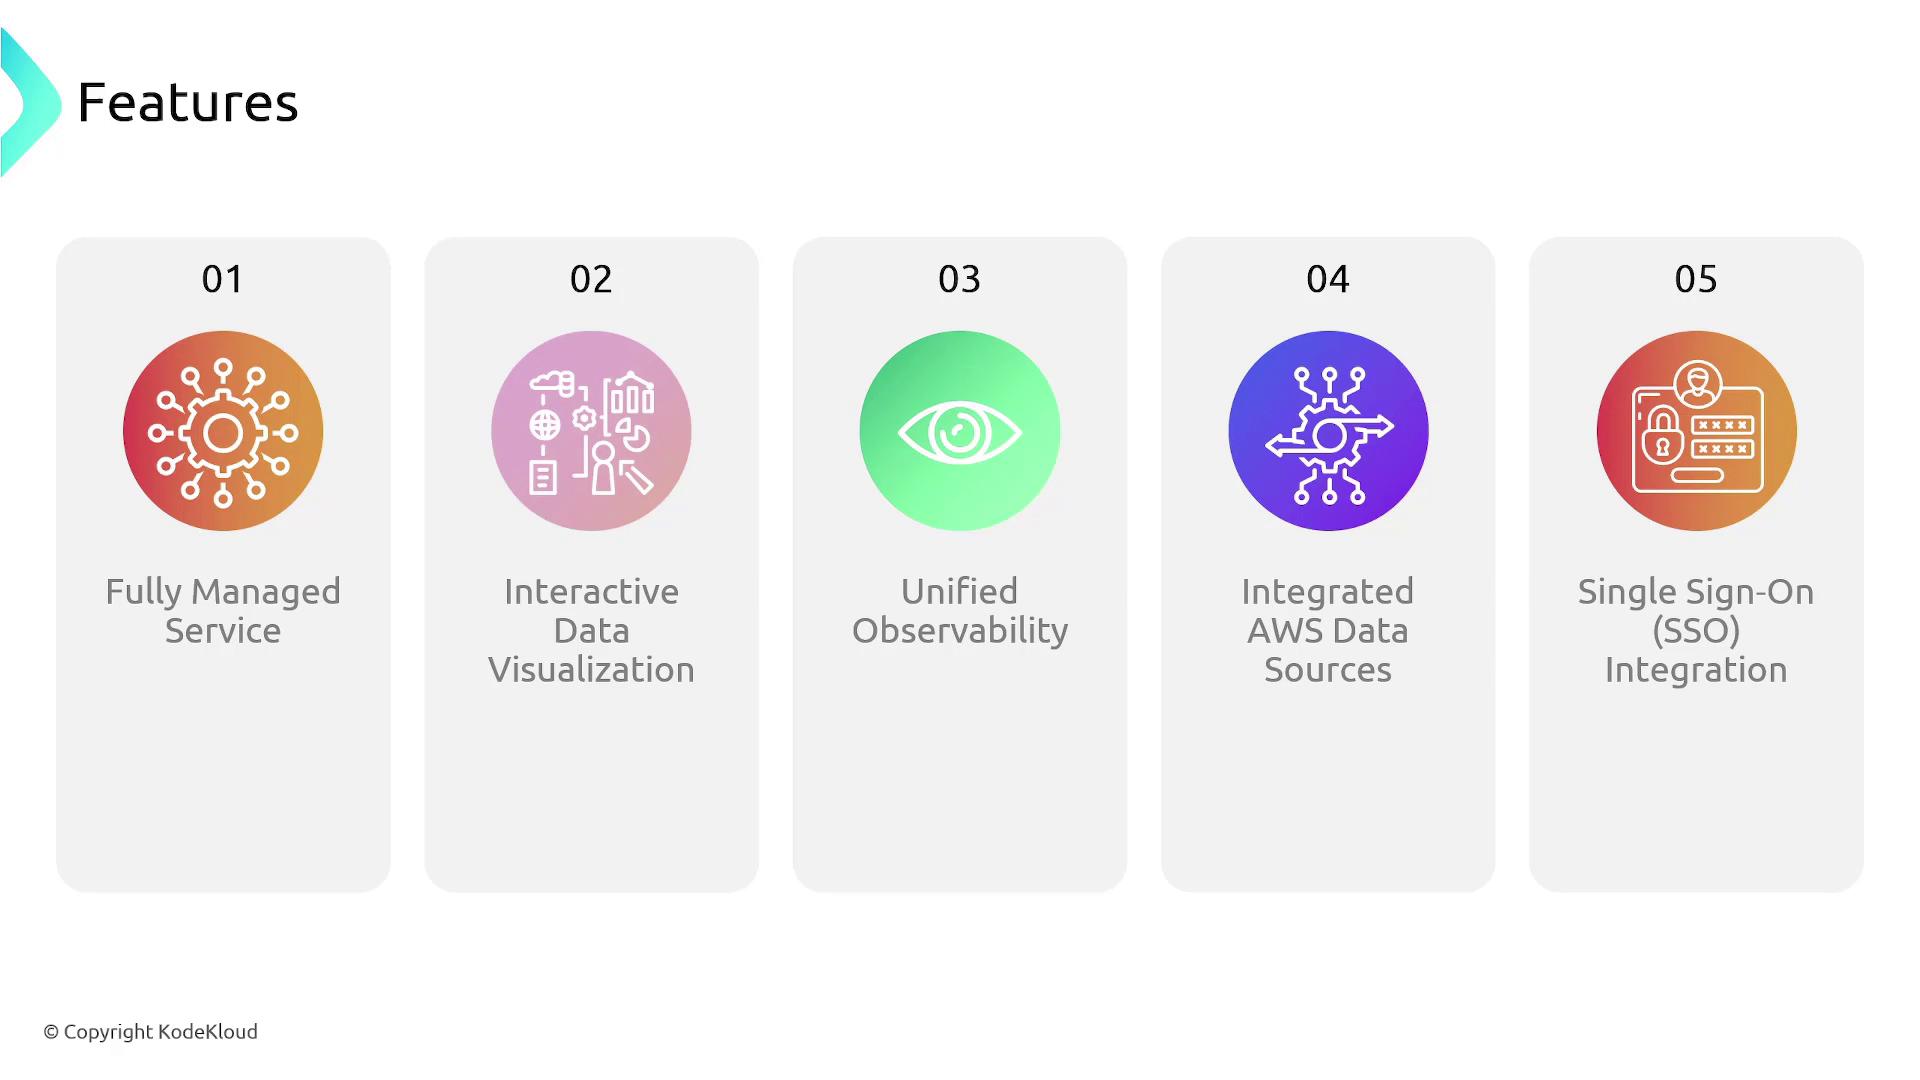
Below is an overview of the top benefits of using AWS Managed Grafana:
| Feature | Benefit | Example Use Case |
| -------------------------------- | ------------------------------------------------------------------------------------------------------------------------ | ------------------------------------------------- |
| Fully Managed Service | AWS handles the underlying infrastructure and scaling. | Focus on metrics analysis without server hassles. |
| Interactive Data Visualization | Create dynamic dashboards tailored to your operational needs. | Monitor multiple systems on a single page. |
| Unified Observability | Integrates metrics, logs, and traces from various sources. | Correlate data for effective troubleshooting. |
| Integrated AWS Data Sources | Supports AWS services like TimeStream, X-Ray, and [CloudWatch](https://learn.kodekloud.com/user/courses/aws-cloudwatch). | Centralized data source management. |
| Single Sign-On (SSO) Integration | Seamless authentication using corporate credentials. | Enhance security and user experience. |
Grafana seamlessly integrates with a wide range of AWS services including TimeStream, X-Ray, and most notably, [CloudWatch](https://learn.kodekloud.com/user/courses/aws-cloudwatch). This flexibility makes Grafana an ideal choice for visualizing operational data and monitoring system performance.
For the Solutions Architect exam, remember that Grafana is not just about data visualization—its power lies in integrating data from diverse metrics sources like [CloudWatch](https://learn.kodekloud.com/user/courses/aws-cloudwatch) and Prometheus, providing a comprehensive view of system health.