Types of Diagnostic Logs
Diagnostic logs in Azure App Service are categorized based on the type of information they capture. Below is an overview of each logging type and its use case:Application Logging
Application logging is supported on both Windows and Linux platforms. It records log messages generated by your application code, including informational messages, warnings, and errors encountered during execution. Depending on your web framework (such as .NET, Node.js, Python, or PHP), the structure of these logs can vary. Application logs are essential for understanding application behavior and troubleshooting issues at the code level.Web Server Logging
Web server logging is available exclusively on Windows and captures raw HTTP request data in the W3C extended log file format. The logs detail every incoming request to the server, including client IP addresses, requested URLs, and HTTP response statuses. This information is vital for analyzing traffic patterns, detecting anomalies, and verifying how the web server manages client requests.Detailed Error Logging
Also available only on Windows, detailed error logging records copies of HTML error pages that would normally be sent directly to the client upon an error. These logs provide a replica of the user experience during error conditions, allowing developers to reproduce and resolve the underlying issues more effectively.Failed Request Tracing
Failed request tracing, another Windows-only feature, provides an in-depth breakdown of step-by-step details for requests that failed to process correctly. This diagnostic tool is particularly beneficial for identifying routing errors, timeouts, or other processing issues that affect request completion.
Deployment Logging
Deployment logging is available on both Windows and Linux. It automatically logs the details related to the deployment of your application. For instance, during automated deployments, every repository commit that triggers a deployment to Azure App Service is logged. Although deployment logging settings are not configurable, this feature is essential for quickly identifying issues in the deployment workflow.Enabling Diagnostic Settings in Azure App Service
Enabling diagnostic logging in Azure App Service is a straightforward process via the Azure Portal. Follow these steps to configure the diagnostic settings and specify the log storage destination:- Open your App Service in the Azure Portal.
- Navigate to the Monitoring section and select Diagnostic Settings.
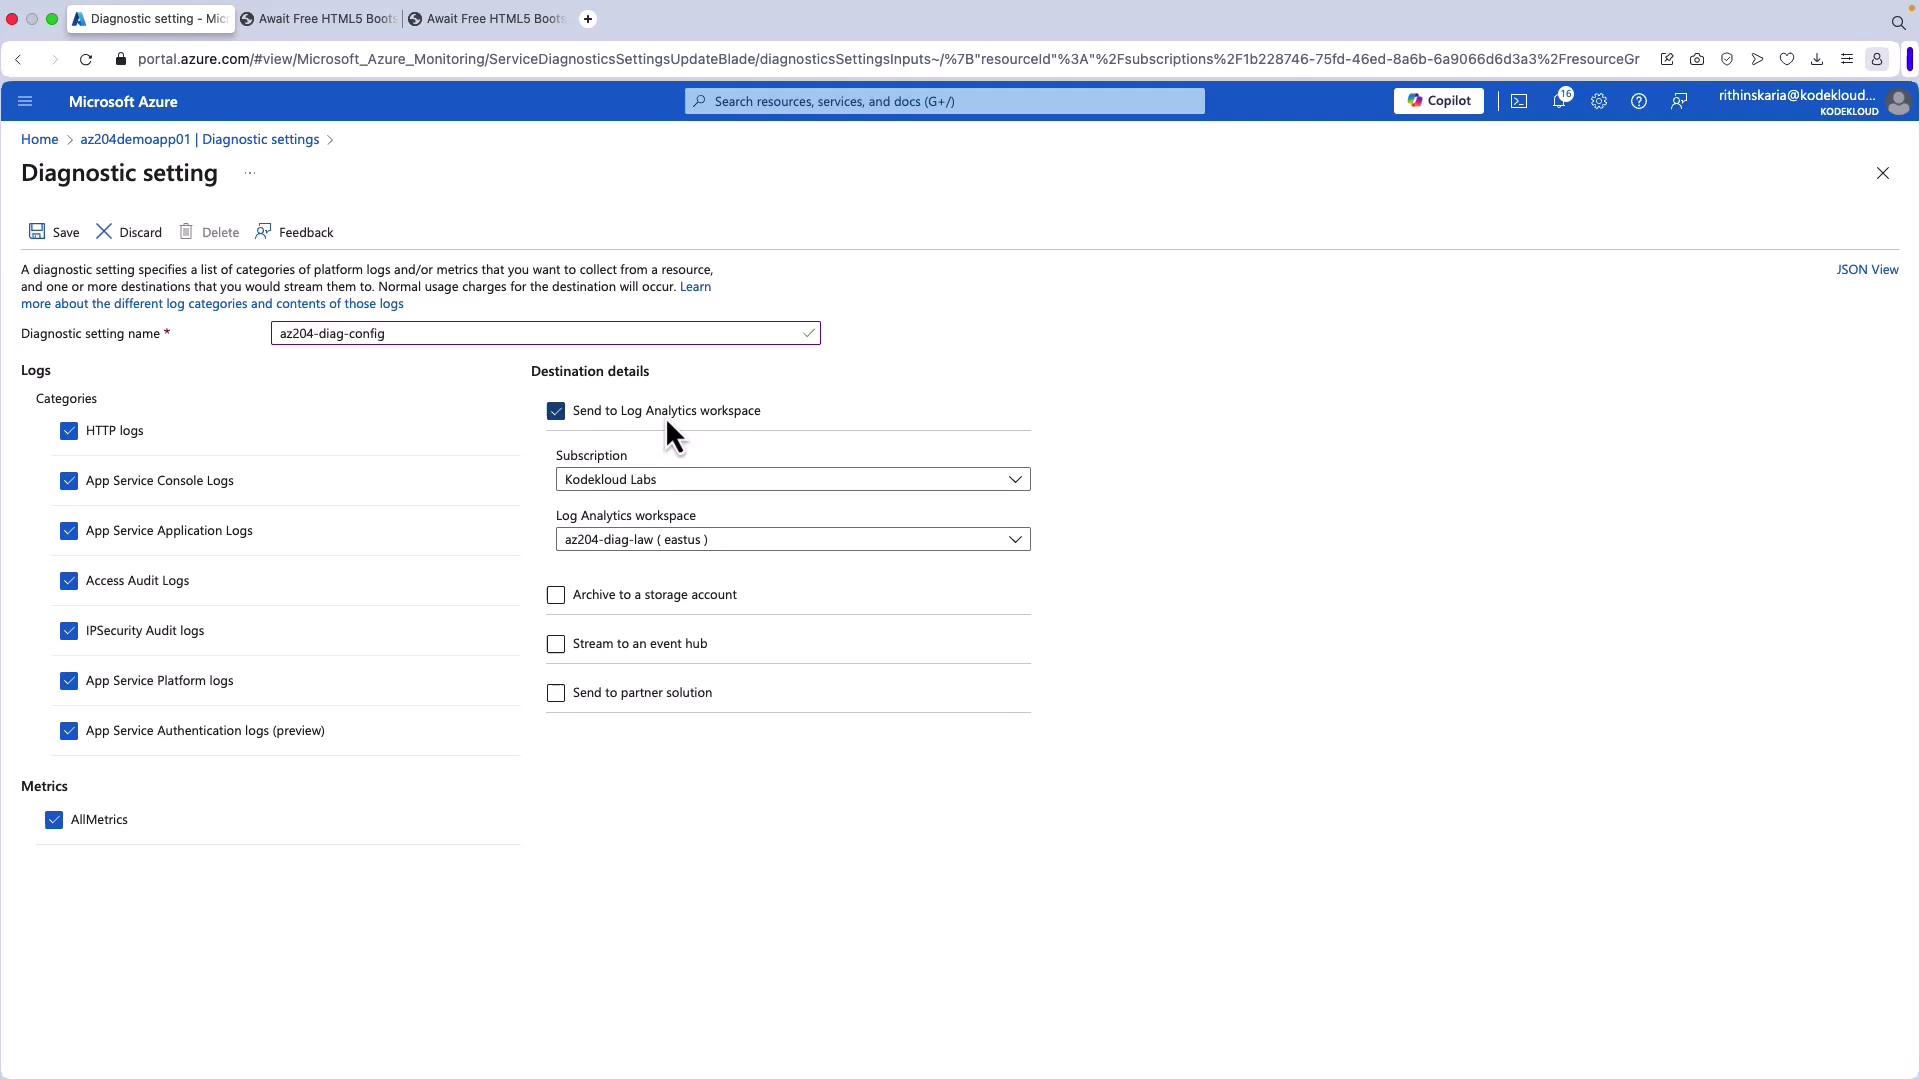
- Click on Add Diagnostic Setting.
- Provide a descriptive name (e.g., “AZ204DiagConfig”).
- Select the log types you wish to capture. Options include:
- HTTP logs
- App Service console logs
- Application logs
- Audit logs
- IP security logs
- Platform logs
- (Currently in preview) Authentication logs
Additionally, you can capture metrics like CPU utilization, memory utilization, failed requests, and total requests.
- Log Analytics Workspace – a native service for robust log storage and analysis.
- A Storage Account – ideal for long-term archiving.
- An Event Hub – for streaming the logs.
- A Partner Solution – if you are using an integrated third-party monitoring tool.
Regularly review and update your diagnostic settings to ensure you capture all necessary data for comprehensive monitoring.
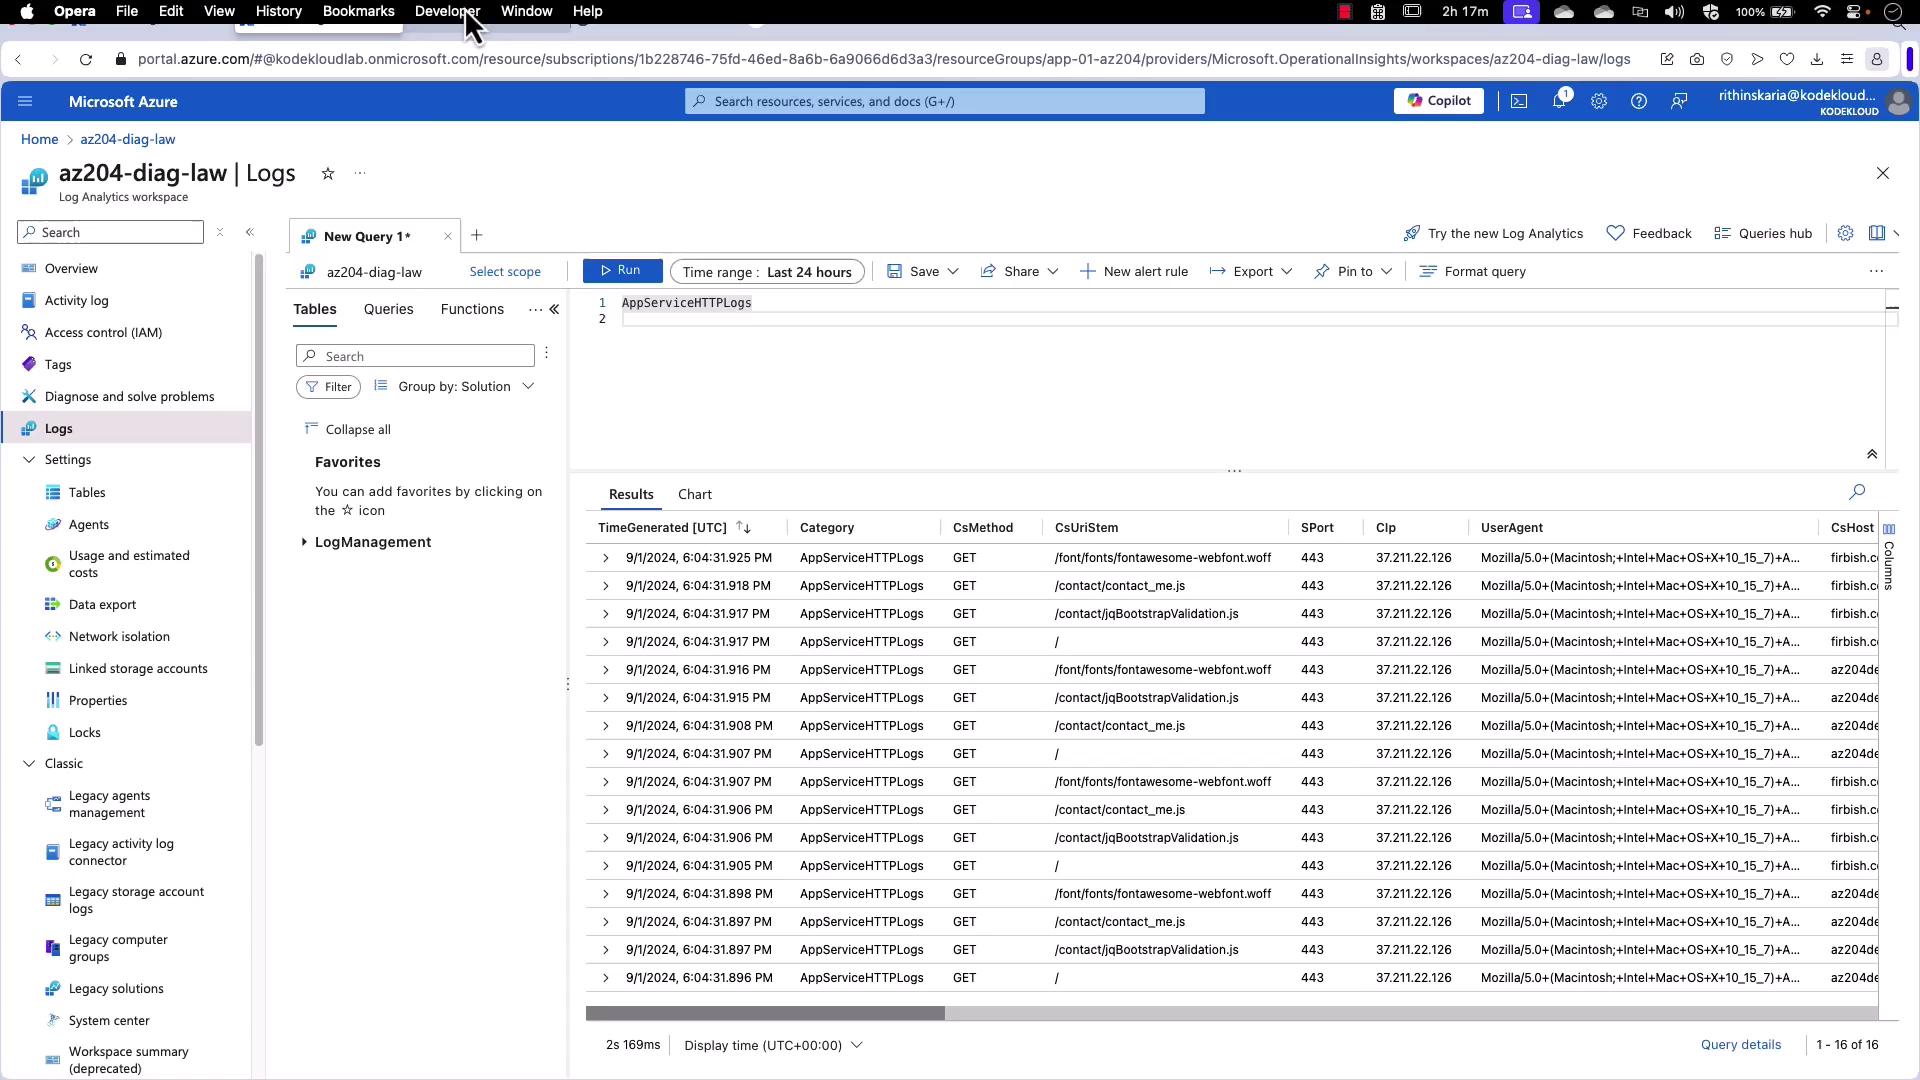
Analyzing Logs with Log Analytics
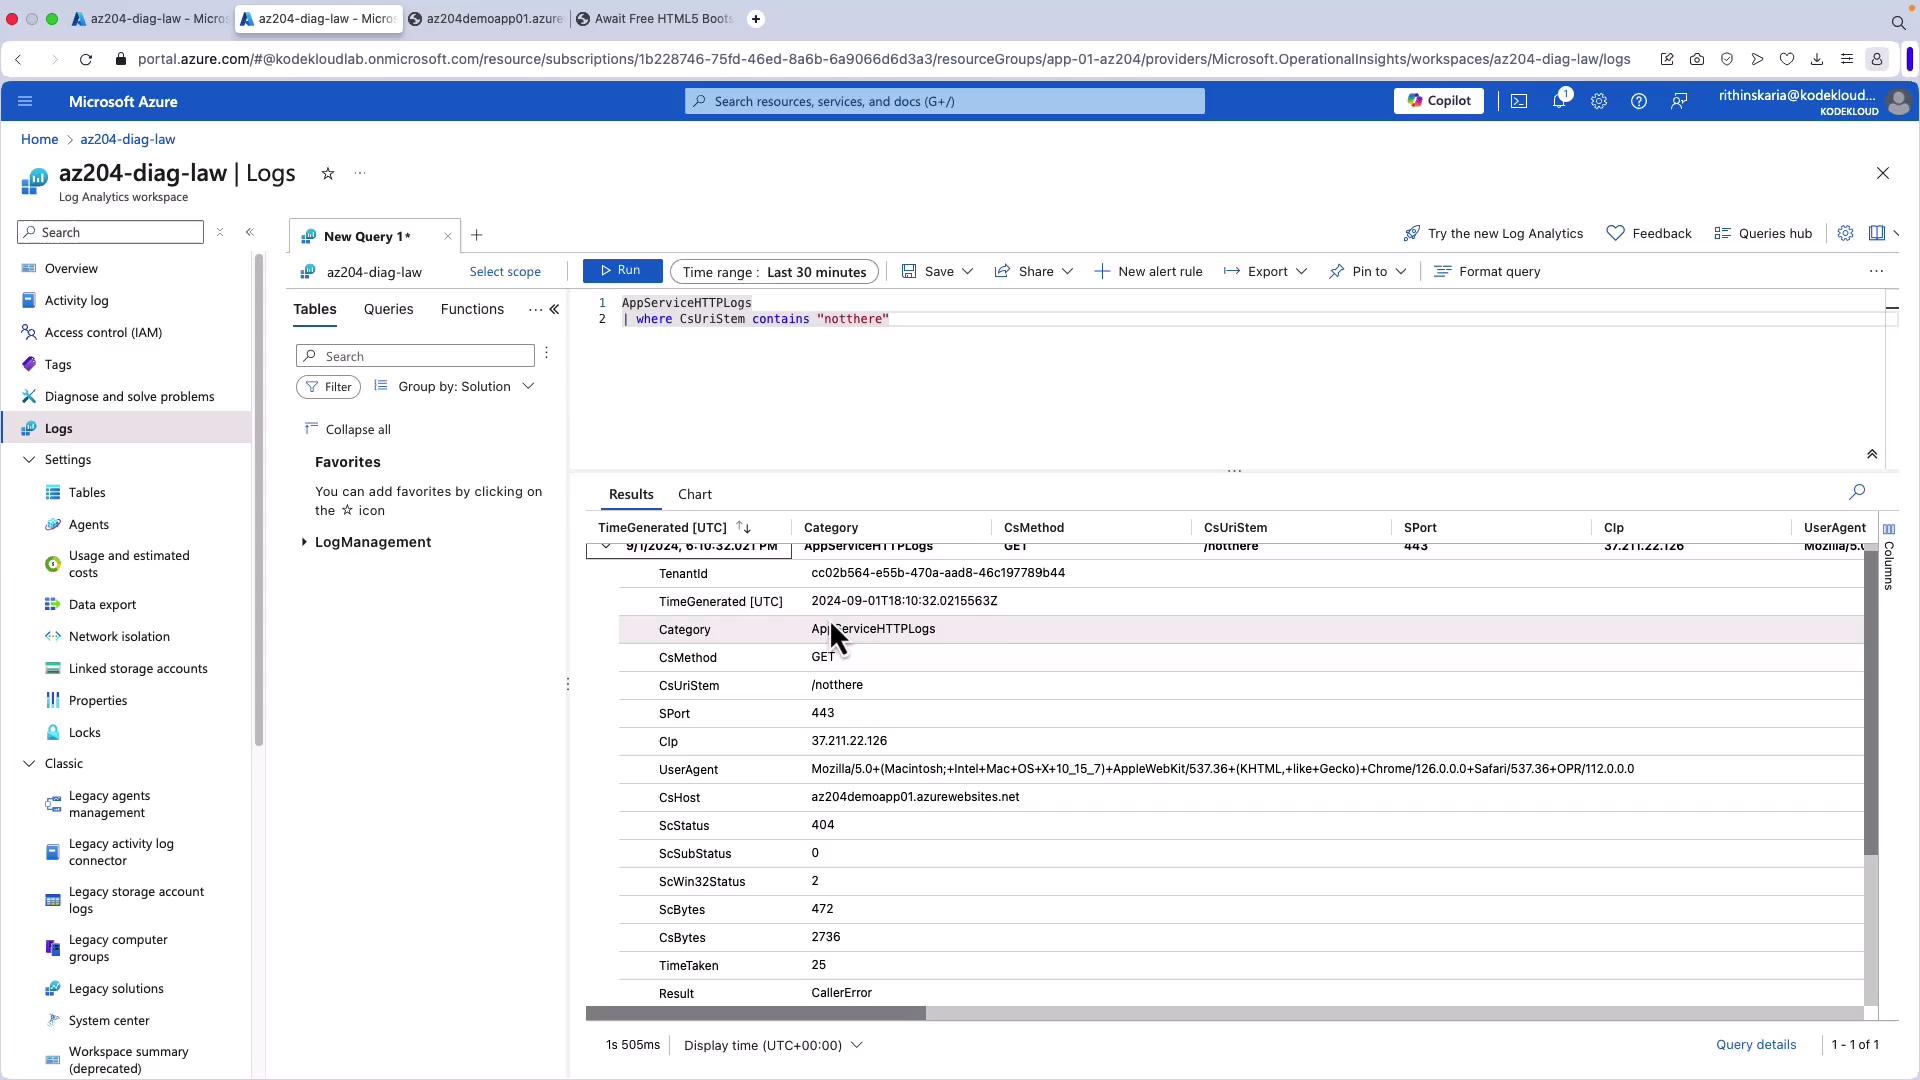
Once your logs are ingested into Log Analytics, you can query them using the powerful Kusto Query Language (KQL). This capability allows you to dive deep into your data to identify performance issues or anomalous activities. For example, if you refresh your website and navigate across various pages, HTTP logs will record these activities. Use the sample query below to filter logs for a specific URI stem containing the text “notthere” (simulating a non-existent page to trigger a 404 error):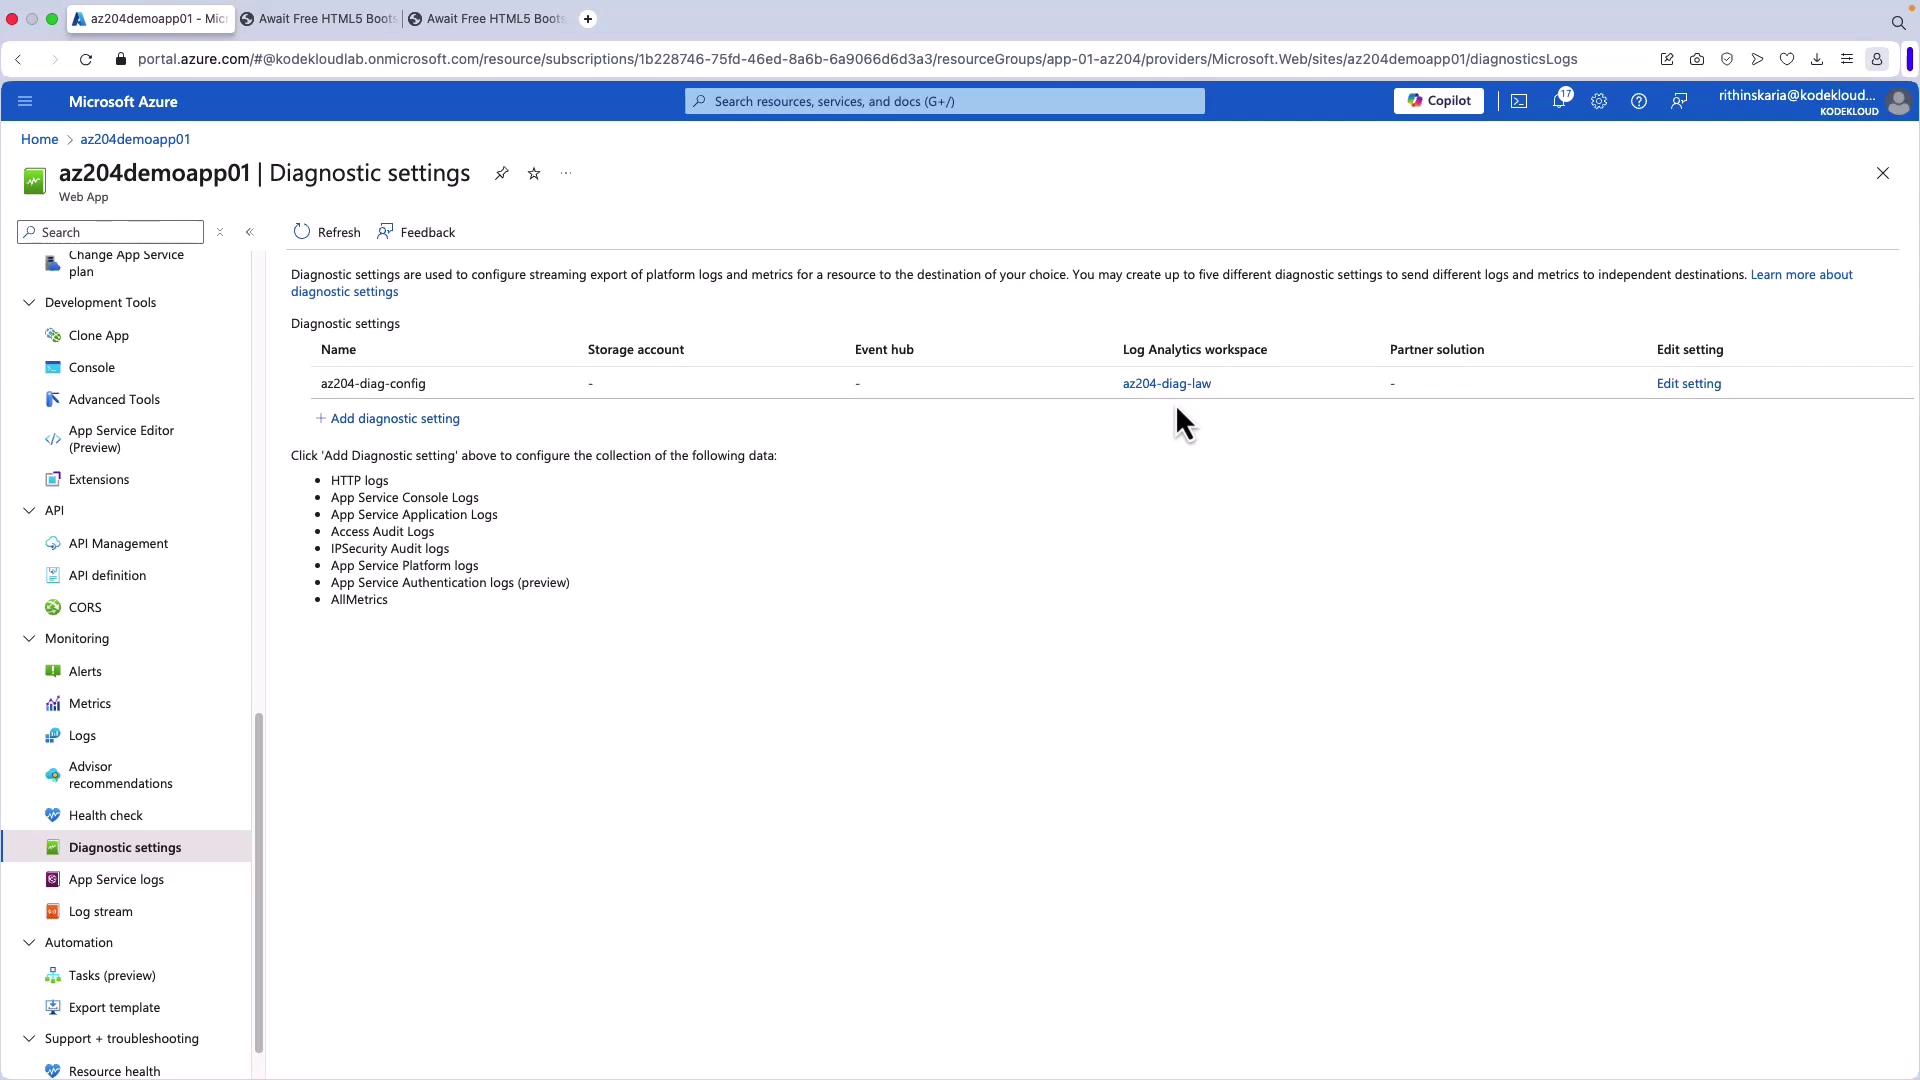
Using descriptive and specific query examples in your documentation improves its visibility to search engines. Leverage keywords like “Azure diagnostic logging”, “Log Analytics queries”, and “Azure App Service monitoring” to enhance SEO performance.