> ## Documentation Index
> Fetch the complete documentation index at: https://notes.kodekloud.com/llms.txt
> Use this file to discover all available pages before exploring further.
# Using Dashboards
> Azure dashboards provide an interactive interface for monitoring performance and health metrics across Azure infrastructure, helping teams gain insights and optimize resources.
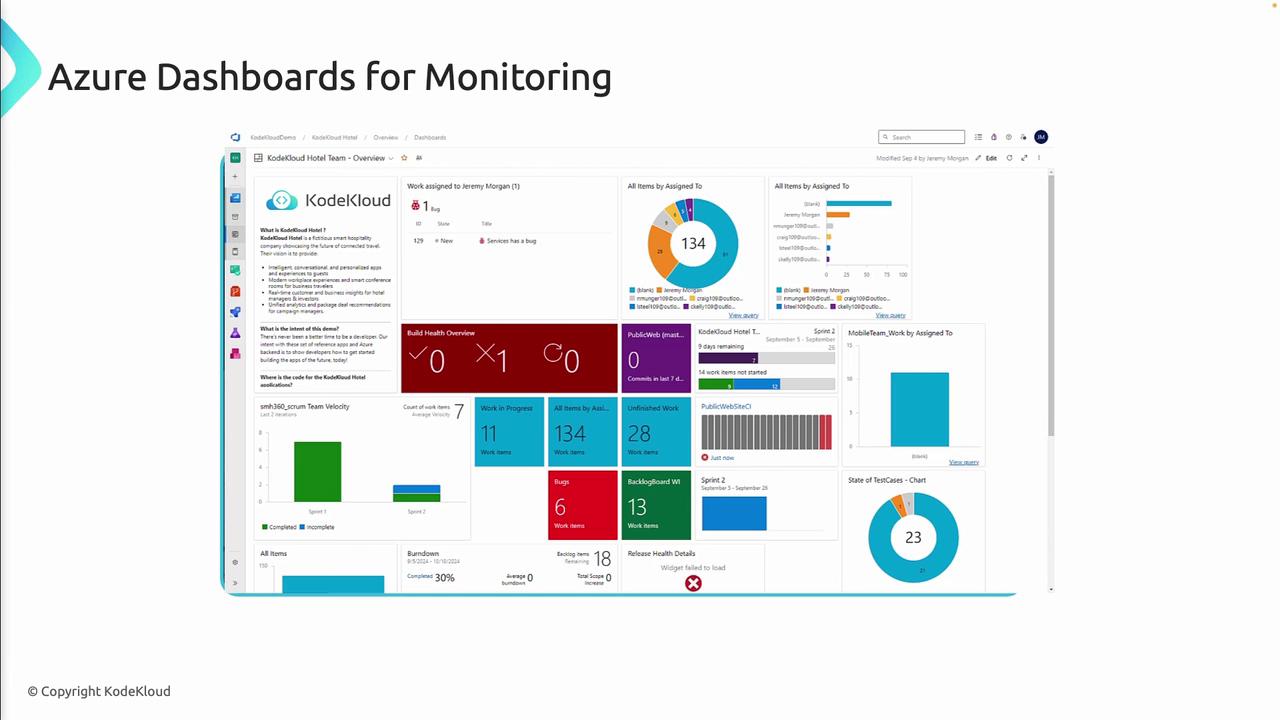
Azure dashboards provide a unified, interactive interface to monitor performance, utilization, and health metrics across your Azure infrastructure. By aggregating data from Azure services and external sources, these customizable dashboards help DevOps teams gain actionable insights, optimize costs, and accelerate troubleshooting.
## Key Features
Azure dashboards can be tailored to any team’s workflow. Use drag-and-drop tiles, custom queries, and built-in or third-party charts to surface the data that matters most.
| Feature | Description |
| ------------------------- | ------------------------------------------------------------------------------------- |
| Centralized Monitoring | Aggregate metrics and logs from all subscriptions and resource groups in one view. |
| Customizable Layouts | Design dashboards with drag-and-drop tiles, grids, and theme settings. |
| Integrated Data Sources | Connect to Azure Monitor, Log Analytics, Application Insights, and external APIs. |
| Sharing and Collaboration | Grant roles or share read-only links to co-author and review dashboards. |
| Automation and Scripting | Deploy templates (ARM, Bicep) or call REST APIs to create/update dashboards at scale. |

## Common Use Cases
| Use Case | Description |
| ------------------------------ | ------------------------------------------------------------------------------------------------ |
| CI/CD Pipeline Monitoring | Track build statuses, deployment stages, and failure rates across DevOps pipelines. |
| Application Performance | Visualize response times, throughput, error rates, and dependency calls in real time. |
| Infrastructure Health Tracking | Monitor VM availability, App Service metrics, database DTU usage, and storage IOPS. |
| Service-Level Reporting | Display KPIs such as deployment frequency, mean time to recovery (MTTR), and uptime percentages. |
| Stakeholder Dashboards | Share executive summaries with interactive charts and KPI tiles for business stakeholders. |
## Integration with Azure Monitor and Log Analytics
Azure dashboards seamlessly integrate with Azure Monitor and Log Analytics to form a complete observability solution:
* Collect metrics, activity logs, and custom telemetry across your cloud estate.
* Run Kusto Query Language (KQL) queries to filter, aggregate, and correlate log data.
* Pin chart and grid visualizations directly from Log Analytics or Application Insights.
## Best Practices
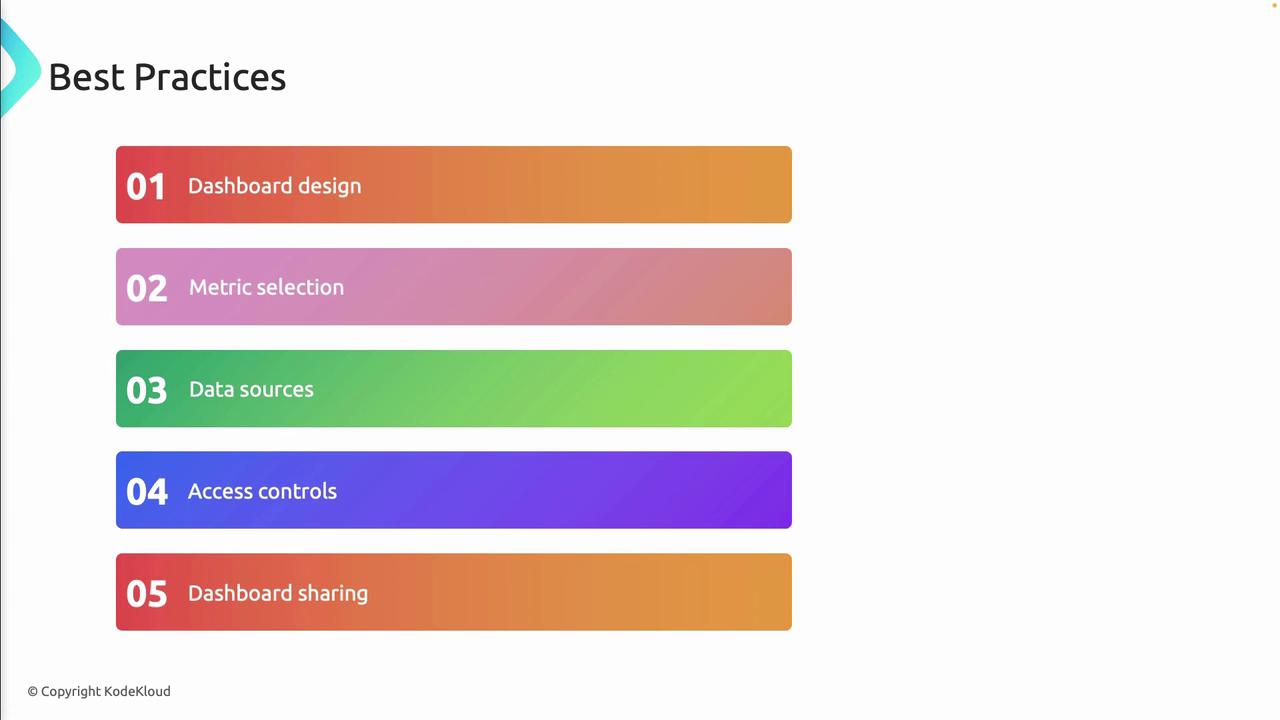
1. Design for Clarity\
Organize tiles by priority and group related metrics together.
2. Select Actionable Metrics\
Surface only the data points that drive decisions or indicate anomalies.
3. Integrate Diverse Data Sources\
Combine infrastructure, application, and security logs for a holistic view.
4. Enforce Role-Based Access Controls\
Apply least-privilege permissions to protect sensitive dashboards.
Grant “Contributor” access only to trusted team members. Public dashboard links expose read-only data but should still be shared judiciously.
5. Encourage Collaboration\
Leverage comments, annotations, and versioned templates so that teams can iterate on dashboard designs.
Azure dashboards empower teams to monitor, analyze, and optimize cloud resources within a single pane of glass. By leveraging customization, automation, and deep integration with Azure Monitor and Log Analytics, you can accelerate troubleshooting, improve governance, and drive continuous improvement across your Azure environment.
## Links and References
* [Azure Dashboards overview](https://docs.microsoft.com/azure/azure-monitor/visualize/dashboards)
* [Azure Monitor documentation](https://docs.microsoft.com/azure/azure-monitor/)
* [Log Analytics workspace overview](https://docs.microsoft.com/azure/azure-monitor/logs/log-analytics-overview)