> ## Documentation Index
> Fetch the complete documentation index at: https://notes.kodekloud.com/llms.txt
> Use this file to discover all available pages before exploring further.

# Configure collection of telemetry by using Azure various services

> This guide covers setting up telemetry collection using various Azure services for monitoring and diagnostics.

Enable end-to-end monitoring and diagnostics across your Azure resources. This guide covers how to set up telemetry collection using:

* **Application Insights**
* **VM Insights**
* **Container Insights**
* **Storage Insights**
* **Network Insights**

These services, powered by [Azure Monitor](https://learn.microsoft.com/azure/azure-monitor/overview), help you maximize performance, reliability, and cost efficiency.

## Overview of Azure Insights Services

| Service              | Monitored Resource    | Key Outcome                             |
| -------------------- | --------------------- | --------------------------------------- |
| Application Insights | Live applications     | App performance, user analytics, alerts |
| VM Insights          | Virtual Machines      | OS metrics, dependency maps             |
| Container Insights   | Kubernetes clusters   | Pod/node health, resource usage         |
| Storage Insights     | Storage accounts      | Throughput, capacity planning           |
| Network Insights     | Networking components | Topology, traffic analysis, alerts      |

<Callout icon="triangle-alert" color="#FF6B6B">
  Enabling advanced telemetry features may increase data ingestion costs. Review [Azure Monitor pricing](https://azure.microsoft.com/pricing/details/monitor/) and set up budget alerts to control expenses.
</Callout>

***

## Application Insights

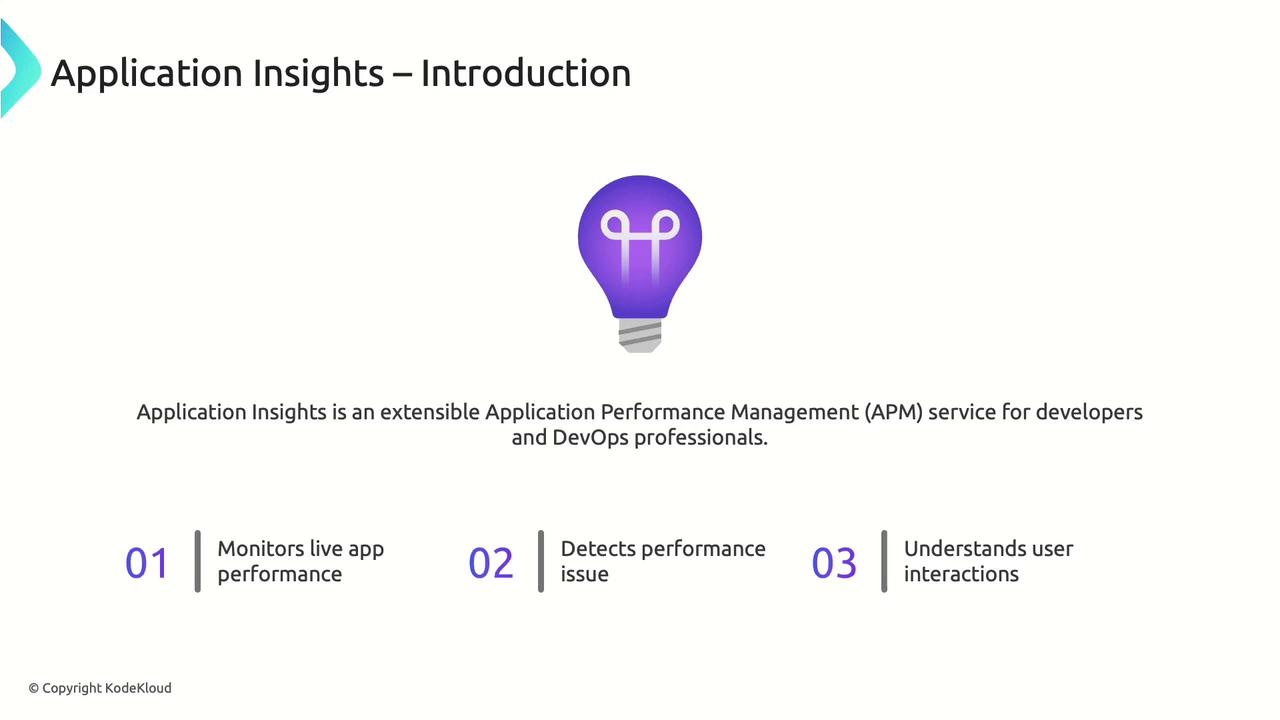
Monitor application performance, detect anomalies, and analyze user behavior with Application Insights.
<Frame>
  ![The image is an introduction to Application Insights, highlighting its role as an Application Performance Management (APM) service for developers and DevOps professionals, with features like monitoring app performance, detecting performance issues, and understanding user interactions.](https://kodekloud.com/kk-media/image/upload/v1752867472/notes-assets/images/AZ-400-Designing-and-Implementing-Microsoft-DevOps-Solutions-Configure-collection-of-telemetry-by-using-Azure-various-services/application-insights-apm-introduction.jpg)
</Frame>

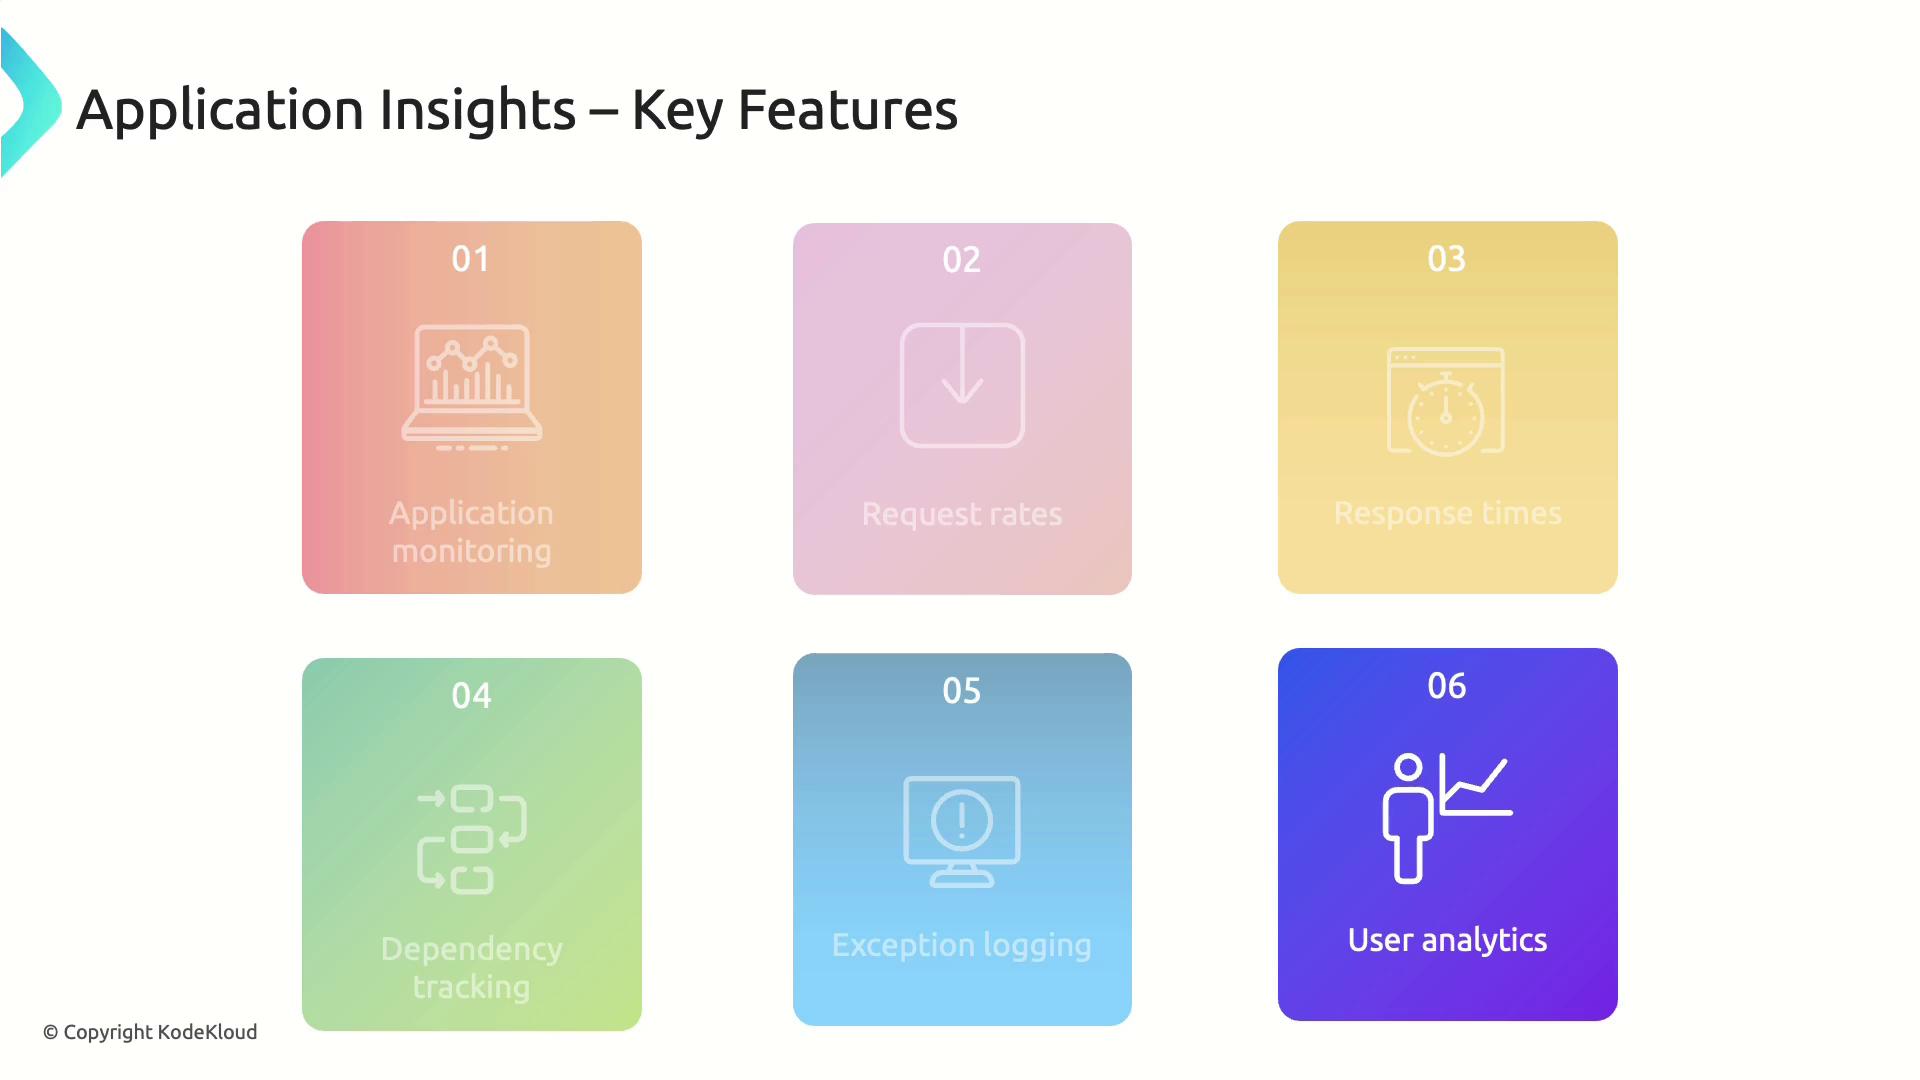
### Key Features

* Request rates & response time monitoring
* Dependency tracking for service maps
* Exception logging & crash analysis
* User behavior analytics
<Frame>
  ![The image lists key features of Application Insights, including application monitoring, request rates, response times, dependency tracking, exception logging, and user analytics.](https://kodekloud.com/kk-media/image/upload/v1752867473/notes-assets/images/AZ-400-Designing-and-Implementing-Microsoft-DevOps-Solutions-Configure-collection-of-telemetry-by-using-Azure-various-services/application-insights-key-features-list.jpg)
</Frame>

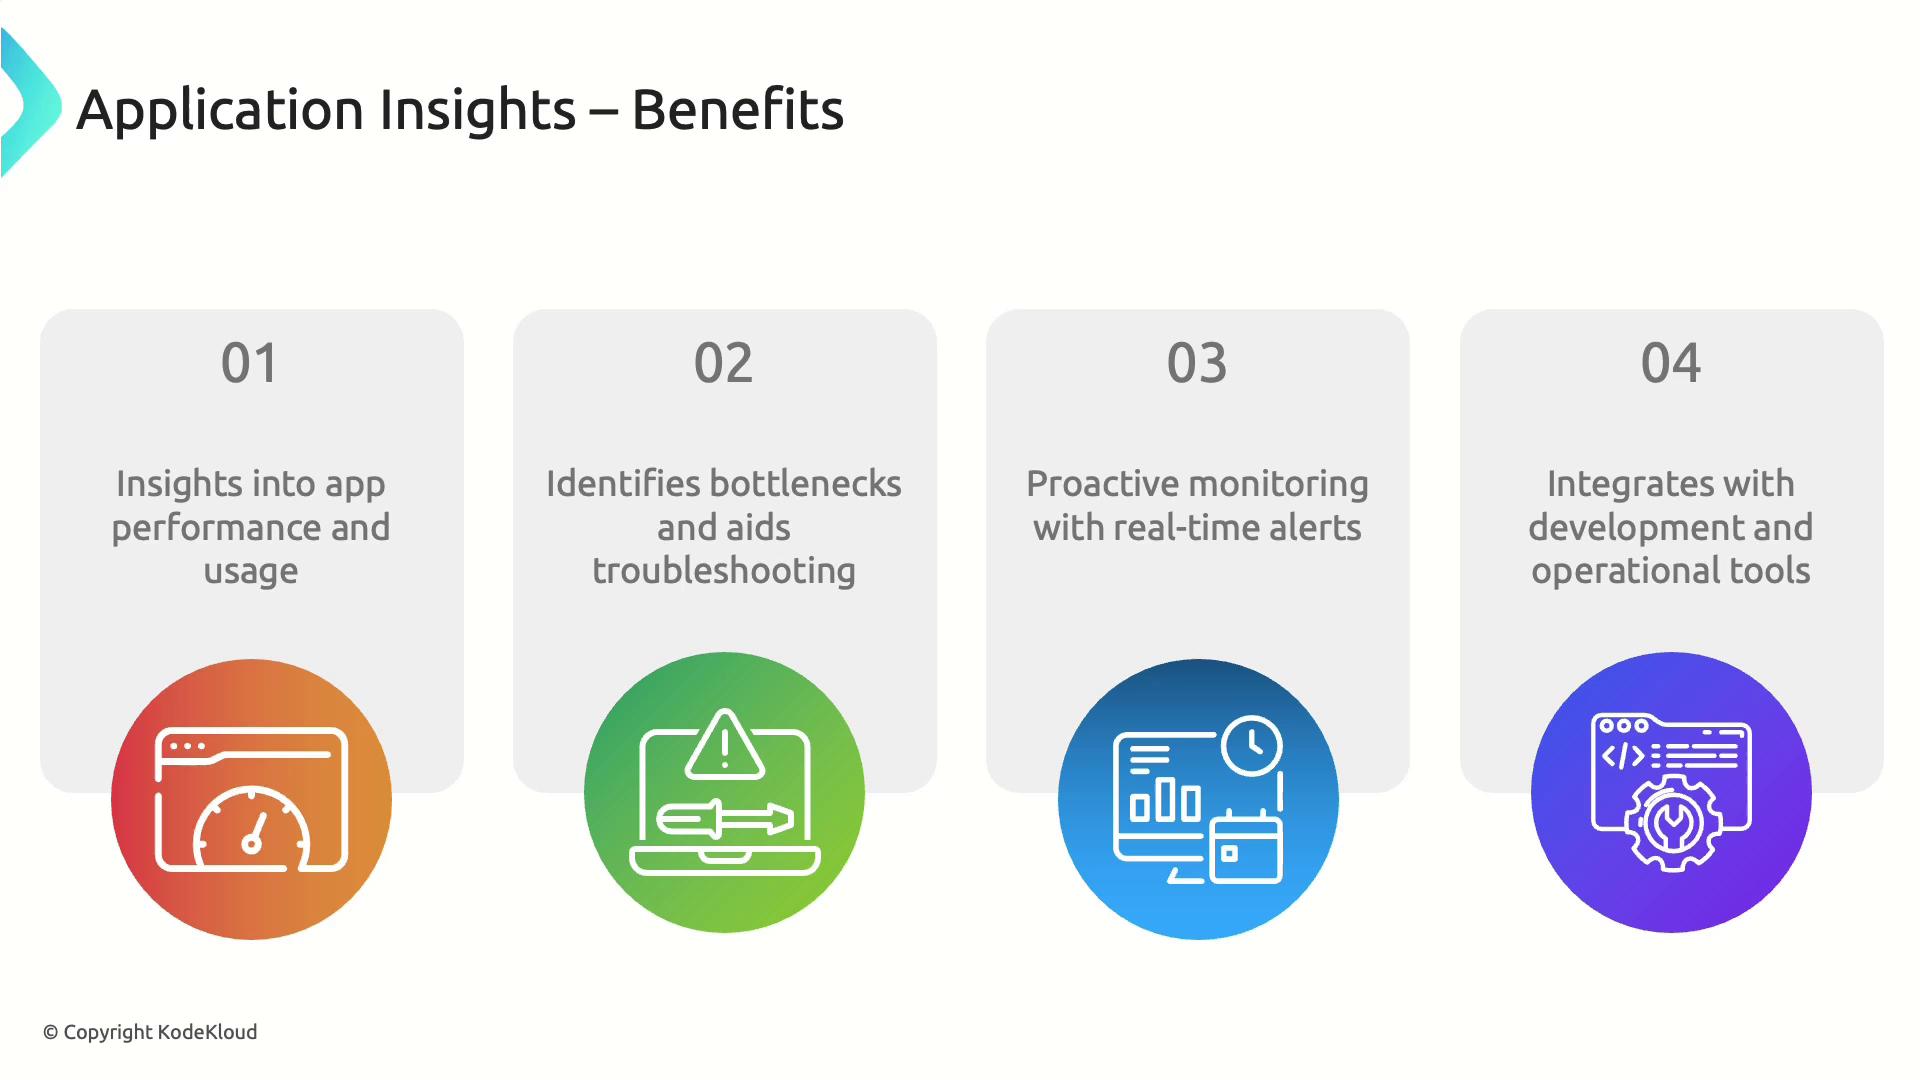
### Benefits

* In-depth visibility into performance bottlenecks
* Proactive alerts to minimize downtime
* Direct integration with CI/CD pipelines
<Frame>
  ![The image outlines the benefits of Application Insights, highlighting insights into app performance, identifying bottlenecks, proactive monitoring, and integration with development tools.](https://kodekloud.com/kk-media/image/upload/v1752867474/notes-assets/images/AZ-400-Designing-and-Implementing-Microsoft-DevOps-Solutions-Configure-collection-of-telemetry-by-using-Azure-various-services/application-insights-benefits-performance-monitoring.jpg)
</Frame>

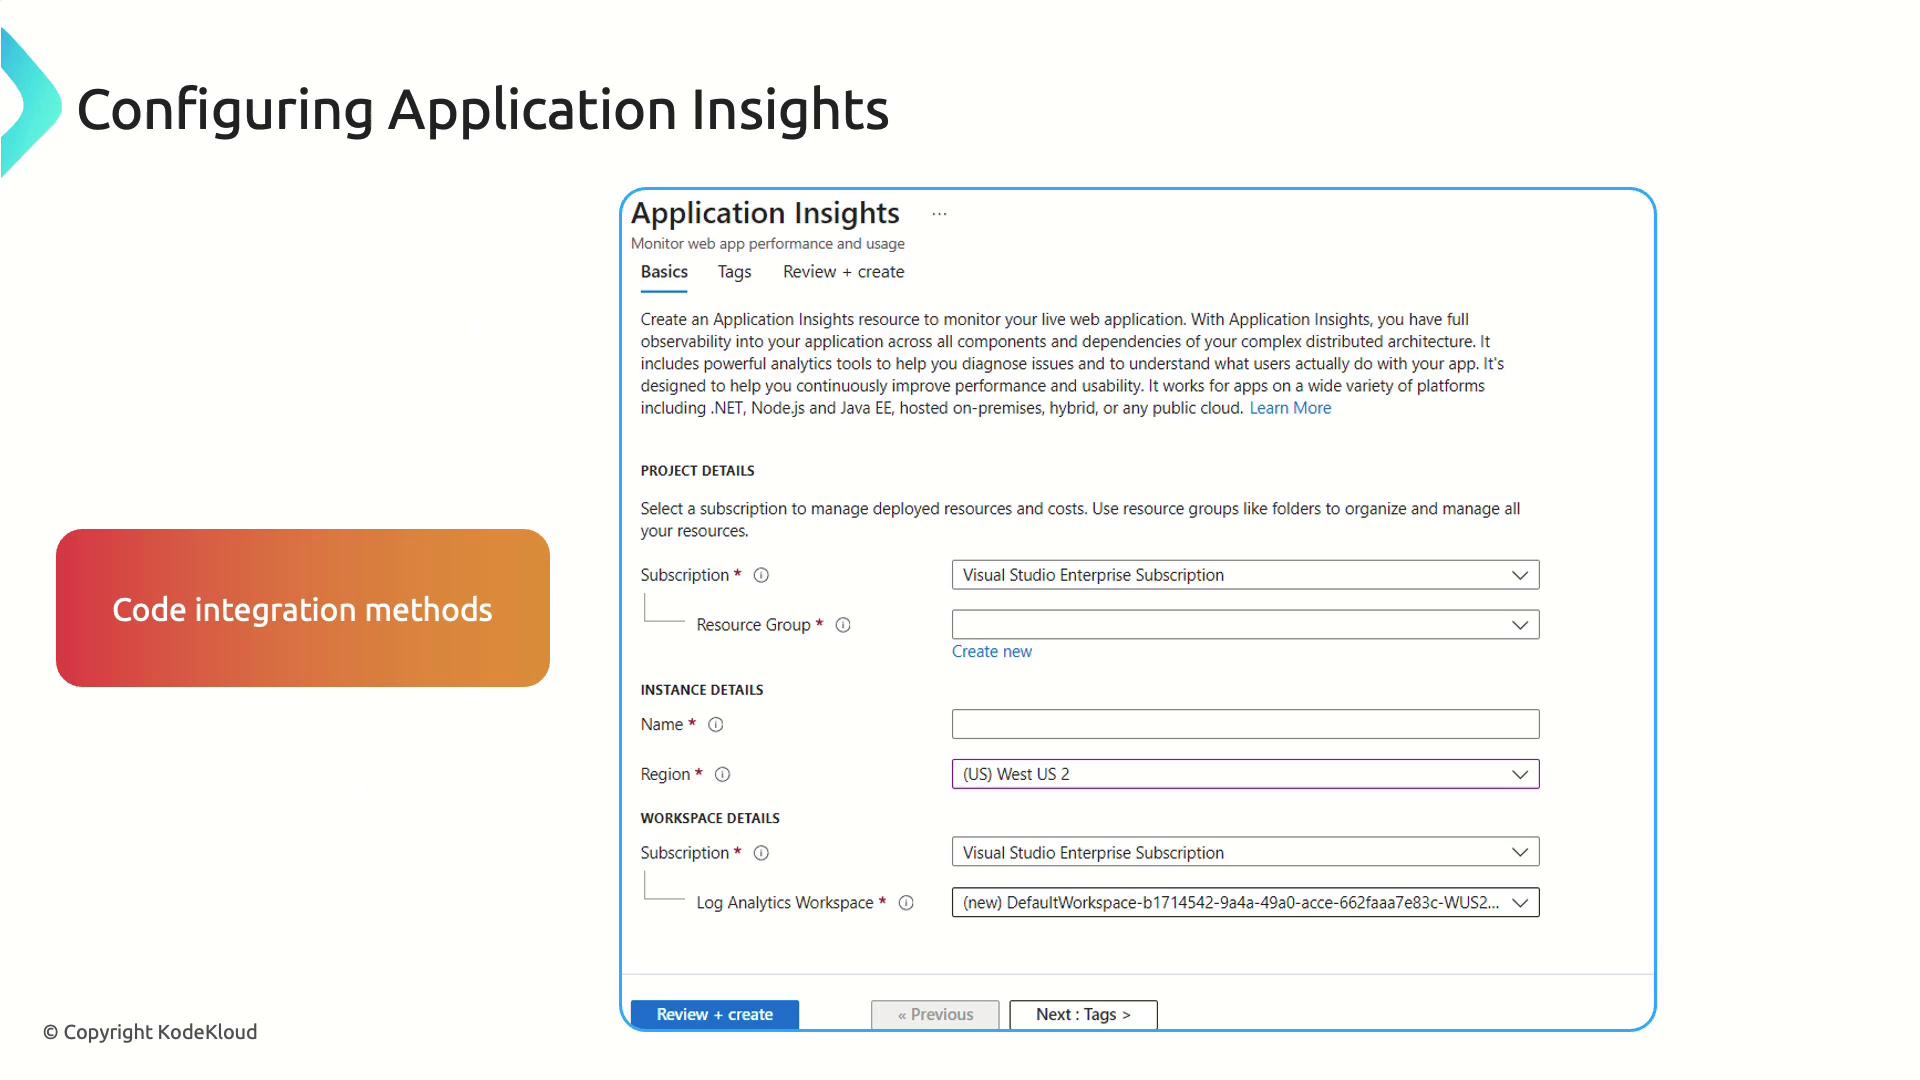
### Setup Steps

1. In the Azure portal, create a new **Application Insights** resource.
2. Choose your application stack (ASP.NET, Java, Node.js, etc.).
3. Install the SDK (NuGet, Maven, npm) and initialize in code.
4. (Optional) Enable agent-based data collection for VMs or App Services.
5. View telemetry on charts, maps, and logs in the portal.
<Frame>
  ![The image shows a configuration screen for setting up Application Insights, detailing project, instance, and workspace details. It also includes a section labeled "Code integration methods."](https://kodekloud.com/kk-media/image/upload/v1752867475/notes-assets/images/AZ-400-Designing-and-Implementing-Microsoft-DevOps-Solutions-Configure-collection-of-telemetry-by-using-Azure-various-services/application-insights-configuration-screen.jpg)
</Frame>

***

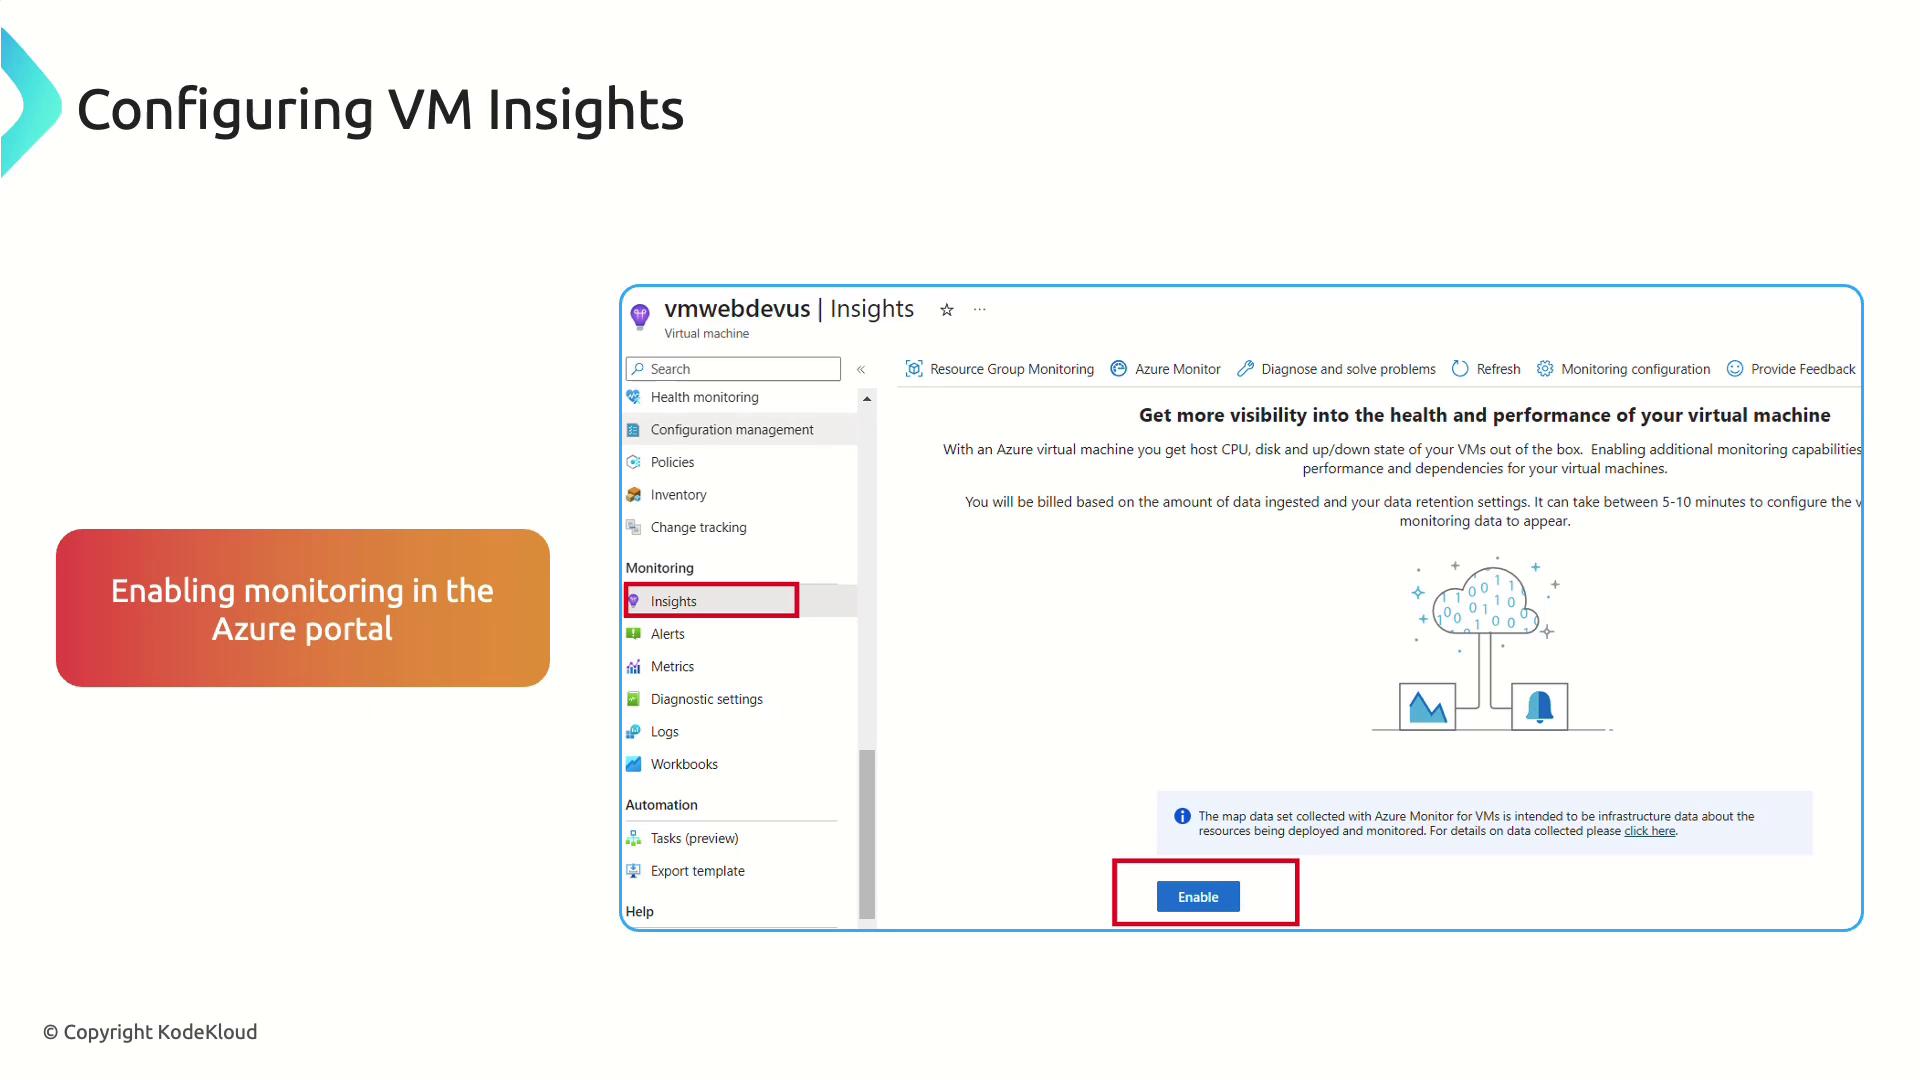
## VM Insights

Gain deep operational insights into your Azure Virtual Machines by tracking performance and dependencies.
<Frame>
  ![The image shows a screenshot of the Azure portal with instructions for configuring VM Insights, highlighting the "Enable" button for monitoring.](https://kodekloud.com/kk-media/image/upload/v1752867476/notes-assets/images/AZ-400-Designing-and-Implementing-Microsoft-DevOps-Solutions-Configure-collection-of-telemetry-by-using-Azure-various-services/azure-portal-vm-insights-screenshot.jpg)
</Frame>

### Key Features

* CPU, memory, disk, and network metrics
* Dependency mapping between VMs and services
* Guest OS-level monitoring
* Full integration with Log Analytics

### Benefits

* Early detection of resource bottlenecks
* Correlate VM metrics with application events
* Centralized log and metric storage

### Setup Steps

1. Open your VM in the Azure portal.
2. Select **Insights** > **Enable**.
3. Install required monitoring extensions.
4. Link to a Log Analytics workspace.
5. Analyze metrics and dependency maps in the portal.

***

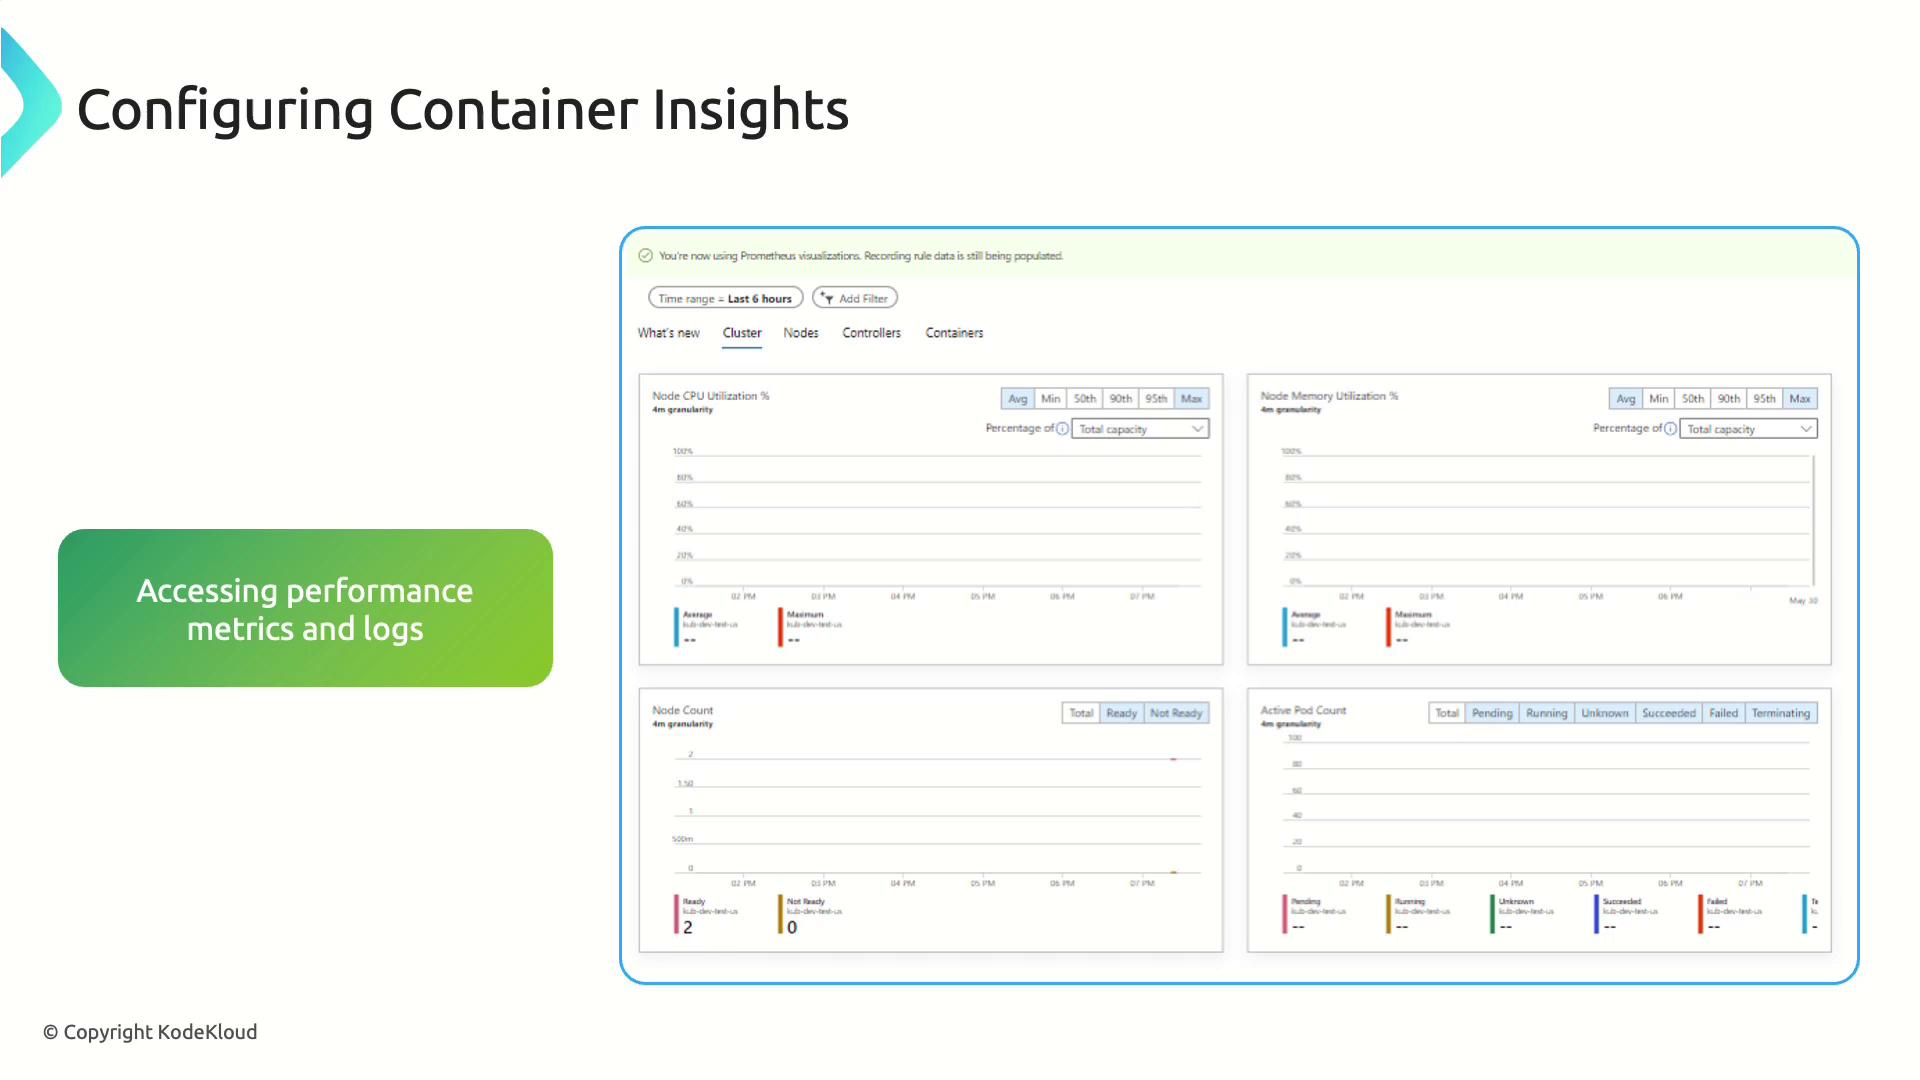
## Container Insights

Monitor container workloads on AKS or other Kubernetes clusters, from pods to nodes.
<Frame>
  ![The image shows a dashboard for configuring container insights, displaying performance metrics and logs such as CPU and memory utilization, node count, and active pod count. It includes a section labeled "Accessing performance metrics and logs."](https://kodekloud.com/kk-media/image/upload/v1752867477/notes-assets/images/AZ-400-Designing-and-Implementing-Microsoft-DevOps-Solutions-Configure-collection-of-telemetry-by-using-Azure-various-services/container-insights-dashboard-performance-metrics.jpg)
</Frame>

### Key Features

* Container & cluster resource metrics
* Log collection & container event analysis
* Pod and node health monitoring
* Integration with Azure Monitor

### Benefits

* Real-time visibility into container performance
* Identify failing pods and resource constraints
* Unified monitoring across VMs, containers, and applications

### Setup Steps

1. In the Azure portal, go to your Kubernetes cluster.
2. Click **Insights** > **Enable**.
3. Install the Log Analytics agent as prompted.
4. Explore CPU, memory, node health, and logs in the portal.

***

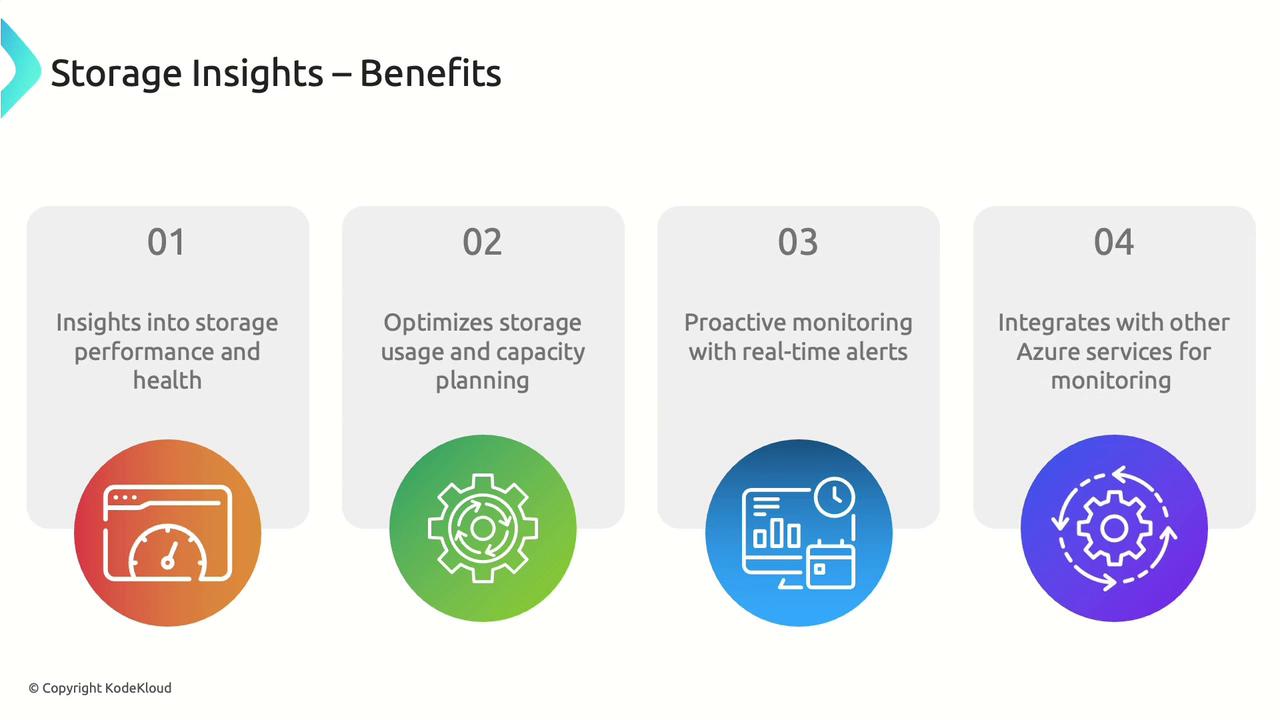
## Storage Insights

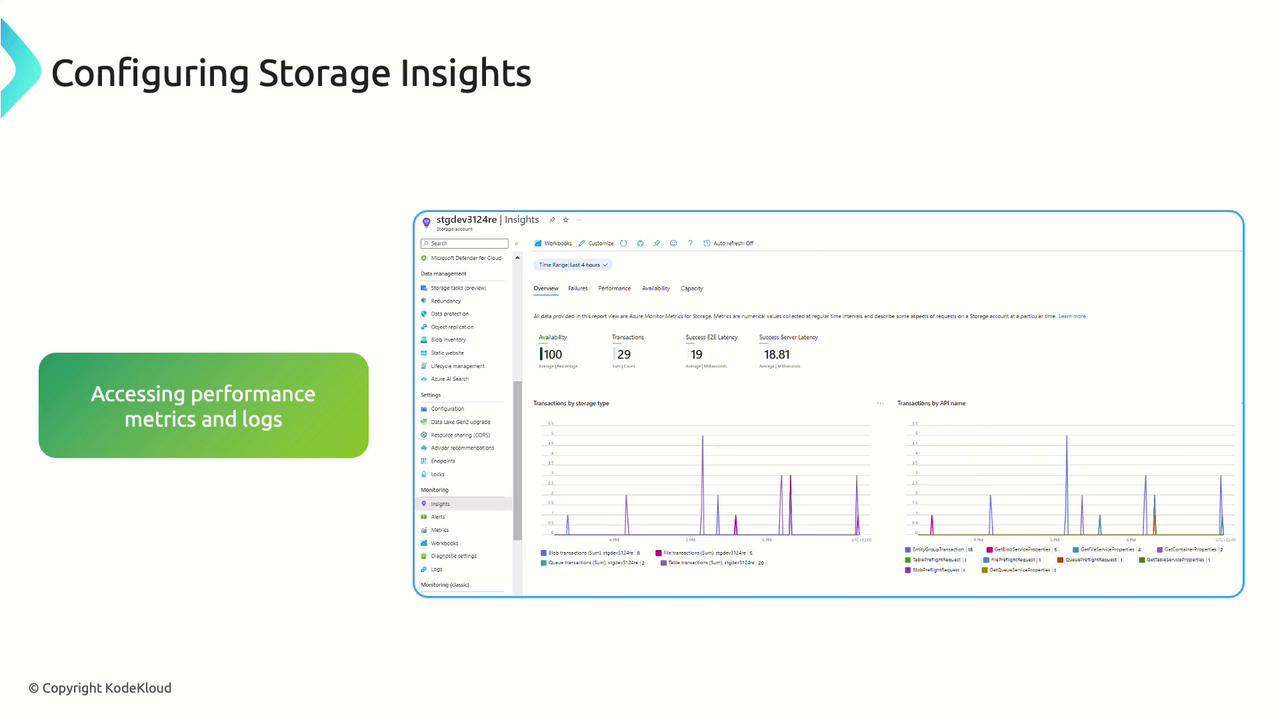
Diagnose and optimize Azure Storage account performance with detailed metrics and logs.
<Frame>
  ![The image is an infographic titled "Storage Insights – Benefits," highlighting four benefits: insights into storage performance, optimization of storage usage, proactive monitoring, and integration with Azure services.](https://kodekloud.com/kk-media/image/upload/v1752867478/notes-assets/images/AZ-400-Designing-and-Implementing-Microsoft-DevOps-Solutions-Configure-collection-of-telemetry-by-using-Azure-various-services/storage-insights-benefits-infographic.jpg)
</Frame>

### Key Features

* Throughput, latency, and capacity metrics
* Access pattern and trend analysis
* Capacity planning recommendations
* Diagnostic logging (read/write/error logs)

### Benefits

* Optimize storage performance and costs
* Predict growth and scale proactively
* Integrate with alerts and dashboards

### Setup Steps

1. Select your Storage Account in the Azure portal.
2. Navigate to **Insights** > **Enable**.
3. Configure diagnostic settings to a Log Analytics workspace.
4. View throughput, latency, capacity, and transaction logs.
<Frame>
  ![The image shows a screenshot of a storage insights dashboard with performance metrics and logs, including graphs and statistics on transactions and latency. It is titled "Configuring Storage Insights" and includes a sidebar menu for navigation.](https://kodekloud.com/kk-media/image/upload/v1752867479/notes-assets/images/AZ-400-Designing-and-Implementing-Microsoft-DevOps-Solutions-Configure-collection-of-telemetry-by-using-Azure-various-services/configuring-storage-insights-dashboard-screenshot.jpg)
</Frame>

***

## Network Insights

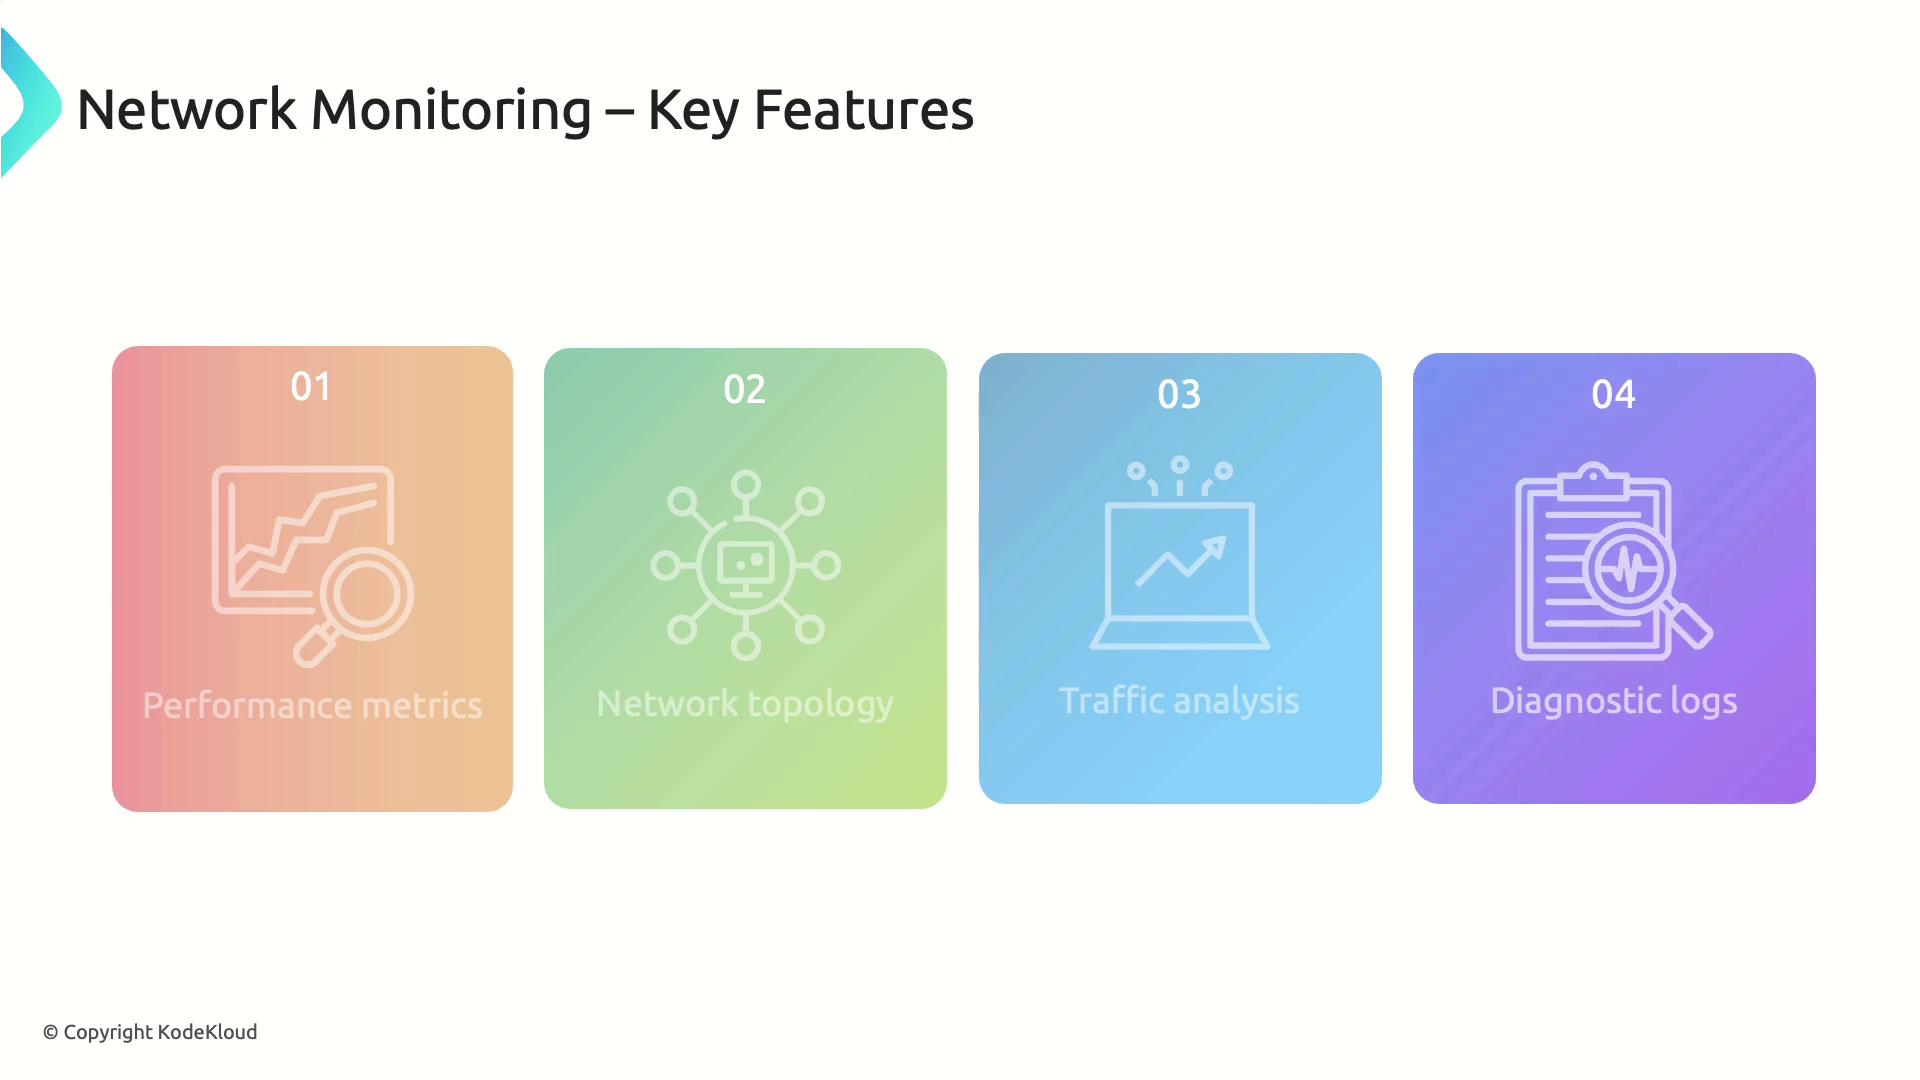
Visualize and troubleshoot your network topology, traffic patterns, and health in real time.
<Frame>
  ![The image outlines key features of network monitoring, including performance metrics, network topology, traffic analysis, and diagnostic logs. Each feature is represented with an icon and a colored background.](https://kodekloud.com/kk-media/image/upload/v1752867480/notes-assets/images/AZ-400-Designing-and-Implementing-Microsoft-DevOps-Solutions-Configure-collection-of-telemetry-by-using-Azure-various-services/network-monitoring-features-diagram.jpg)
</Frame>

### Key Features

* Throughput, latency & packet loss metrics
* Dynamic network topology maps
* Traffic flow and security analysis
* Diagnostic logs for troubleshooting
<Frame>
  ![The image outlines the benefits of network monitoring, including insights into network performance, optimization and connectivity fixes, proactive monitoring with real-time alerts, and integration with Azure services.](https://kodekloud.com/kk-media/image/upload/v1752867481/notes-assets/images/AZ-400-Designing-and-Implementing-Microsoft-DevOps-Solutions-Configure-collection-of-telemetry-by-using-Azure-various-services/network-monitoring-benefits-insights-azure.jpg)
</Frame>

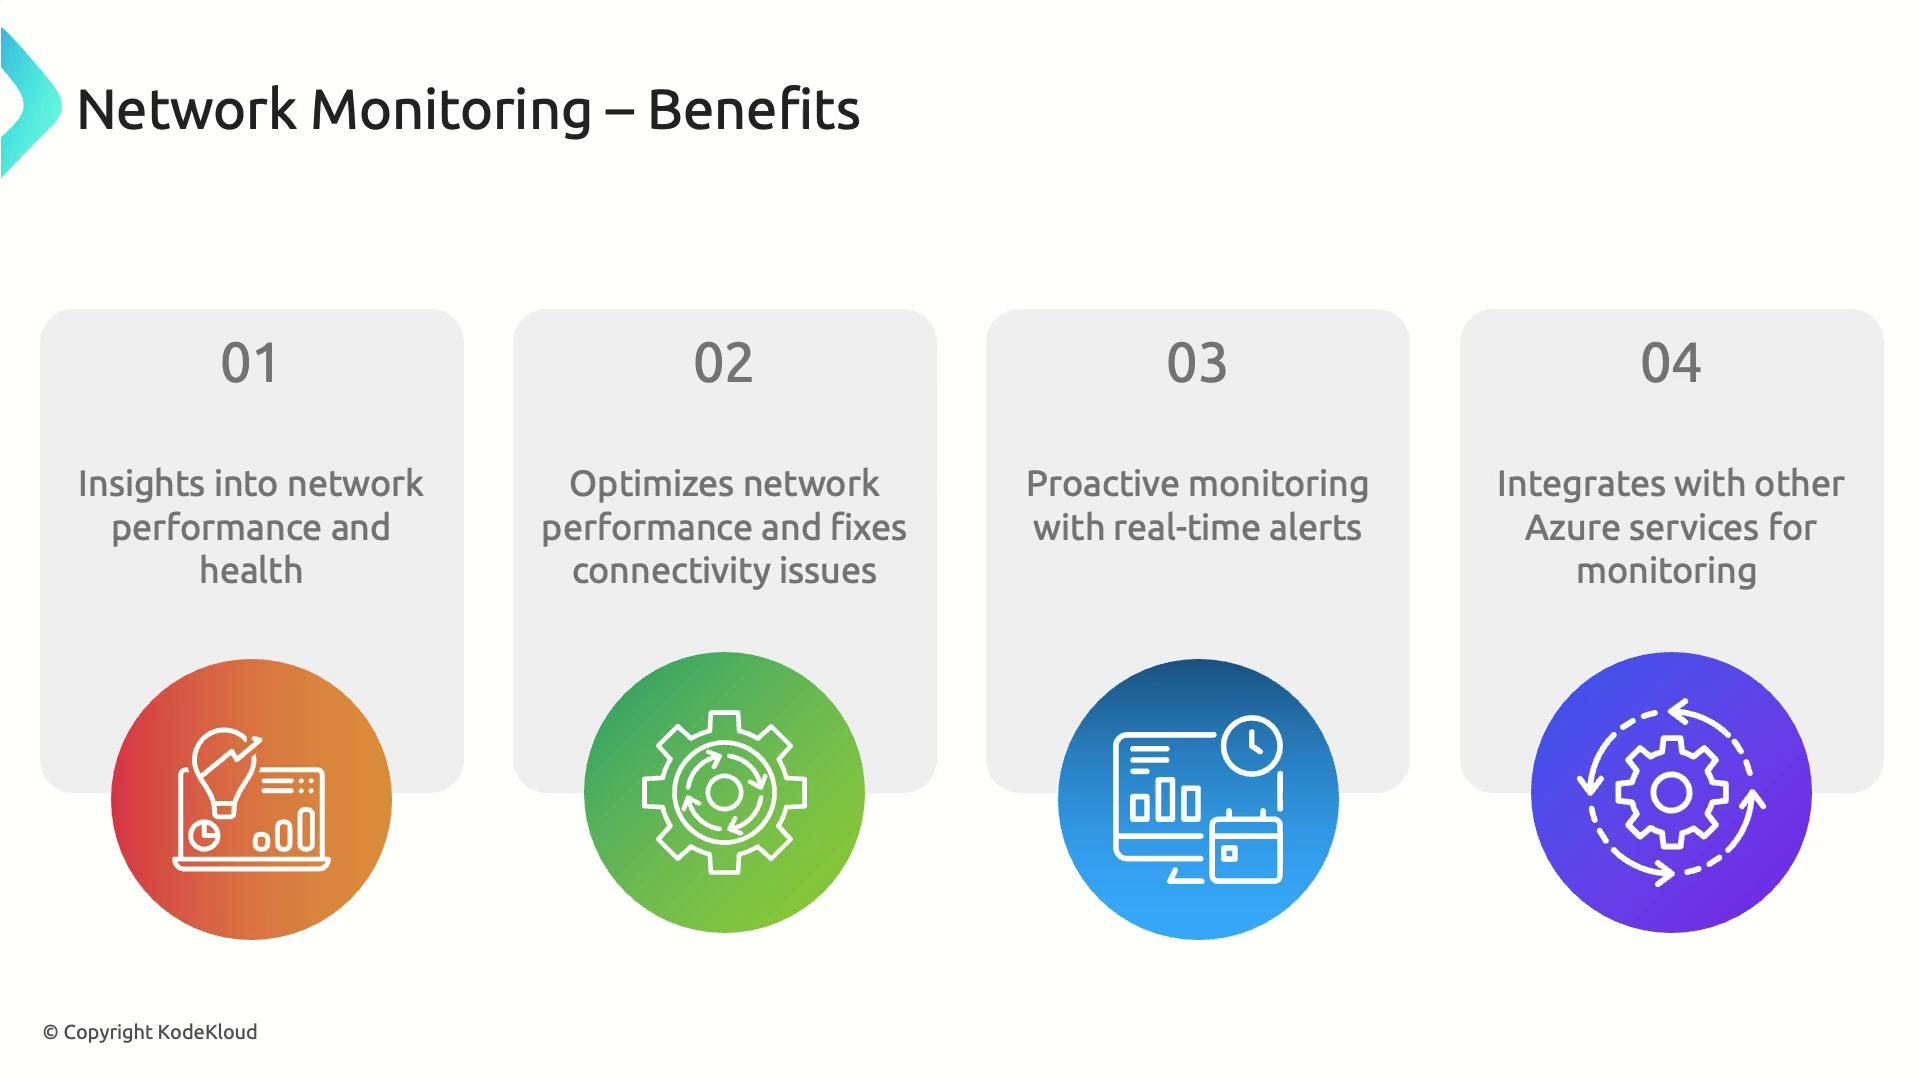
### Benefits

* End-to-end visibility into network health
* Rapid isolation of connectivity issues
* Real-time alerts and proactive monitoring
* Seamless integration with Azure Monitor

### Setup Steps

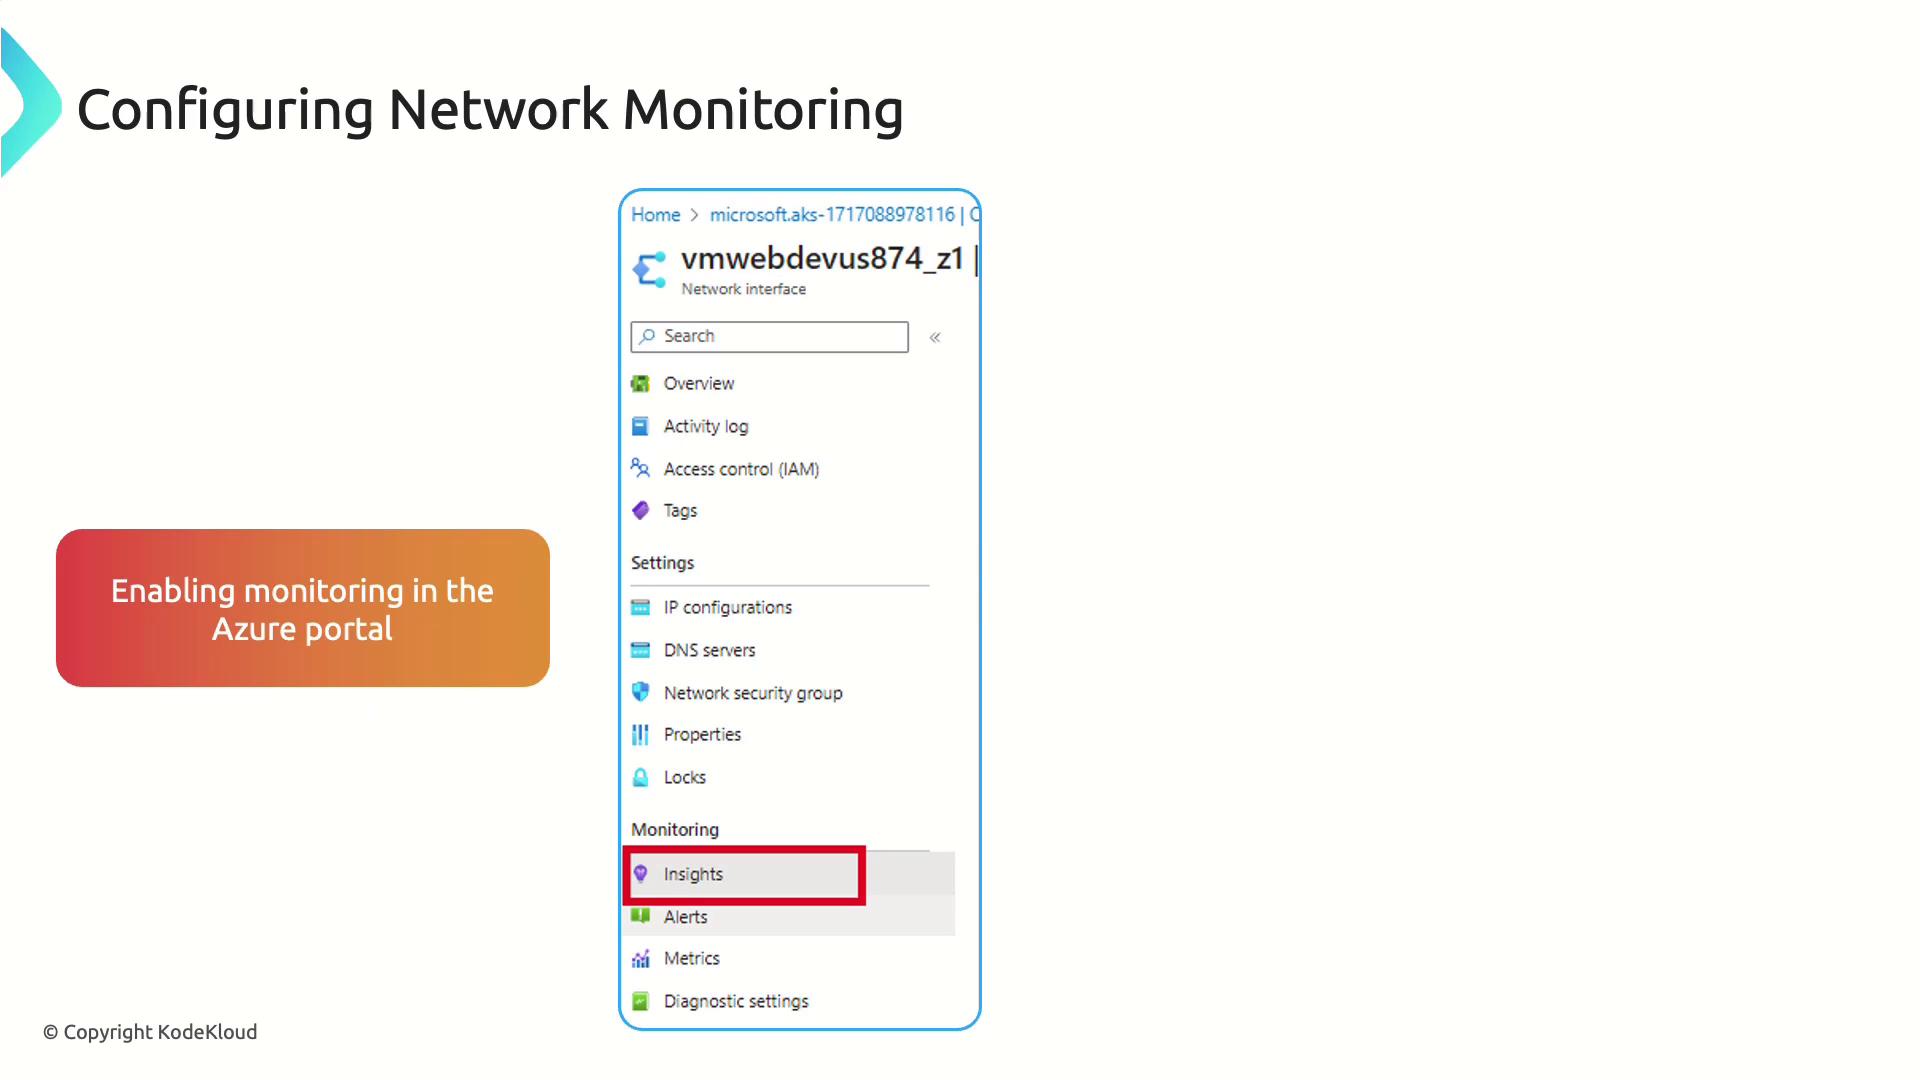
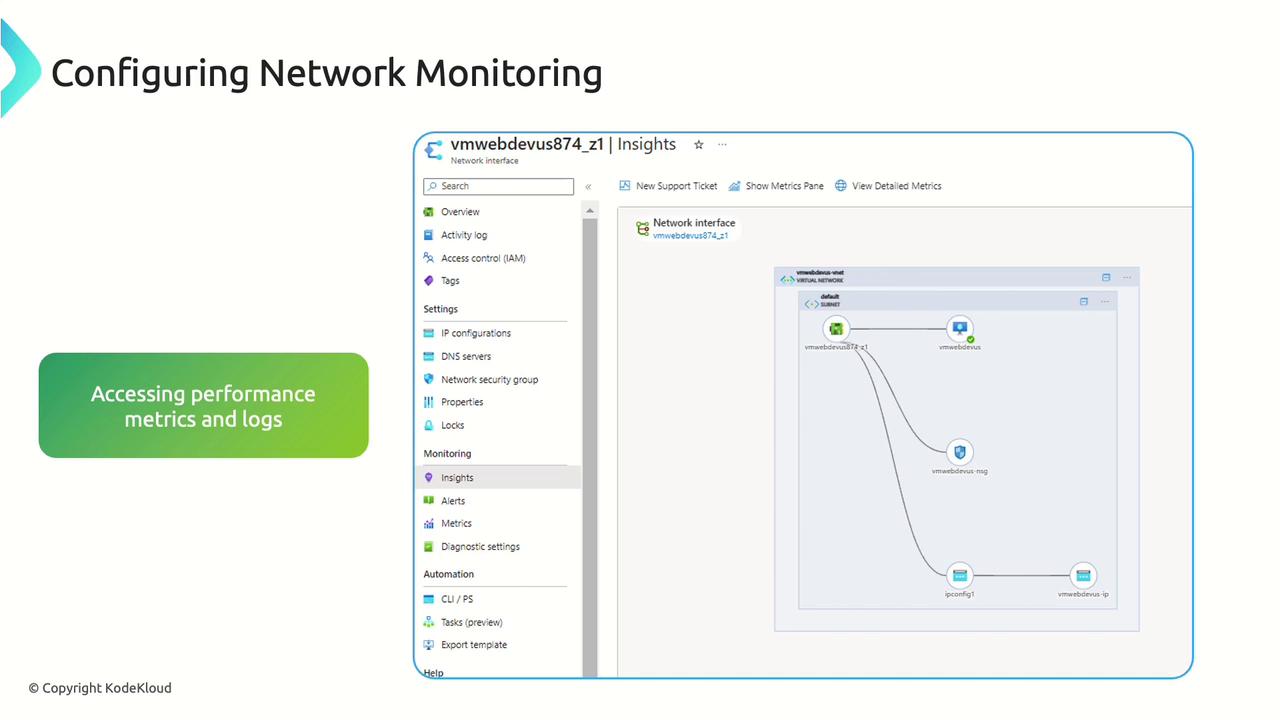
1. In the Azure portal, select a network resource (e.g., NIC, NSG).
2. Click **Insights** > **Enable** under **Monitoring**.
3. Configure diagnostic settings to forward logs and metrics.
4. Link to a Log Analytics workspace.
5. Analyze throughput, latency, and packet-loss charts.
<Frame>
  ![The image shows a screenshot of the Azure portal interface for configuring network monitoring, highlighting the "Insights" option under the Monitoring section. There's also a text box indicating "Enabling monitoring in the Azure portal."](https://kodekloud.com/kk-media/image/upload/v1752867483/notes-assets/images/AZ-400-Designing-and-Implementing-Microsoft-DevOps-Solutions-Configure-collection-of-telemetry-by-using-Azure-various-services/azure-portal-network-monitoring-insights.jpg)
</Frame>

<Frame>
  ![The image shows a network monitoring configuration interface with a diagram of network connections and a sidebar menu for accessing various settings and metrics. It includes a label indicating access to performance metrics and logs.](https://kodekloud.com/kk-media/image/upload/v1752867483/notes-assets/images/AZ-400-Designing-and-Implementing-Microsoft-DevOps-Solutions-Configure-collection-of-telemetry-by-using-Azure-various-services/network-monitoring-configuration-interface-diagram.jpg)
</Frame>

<Frame>
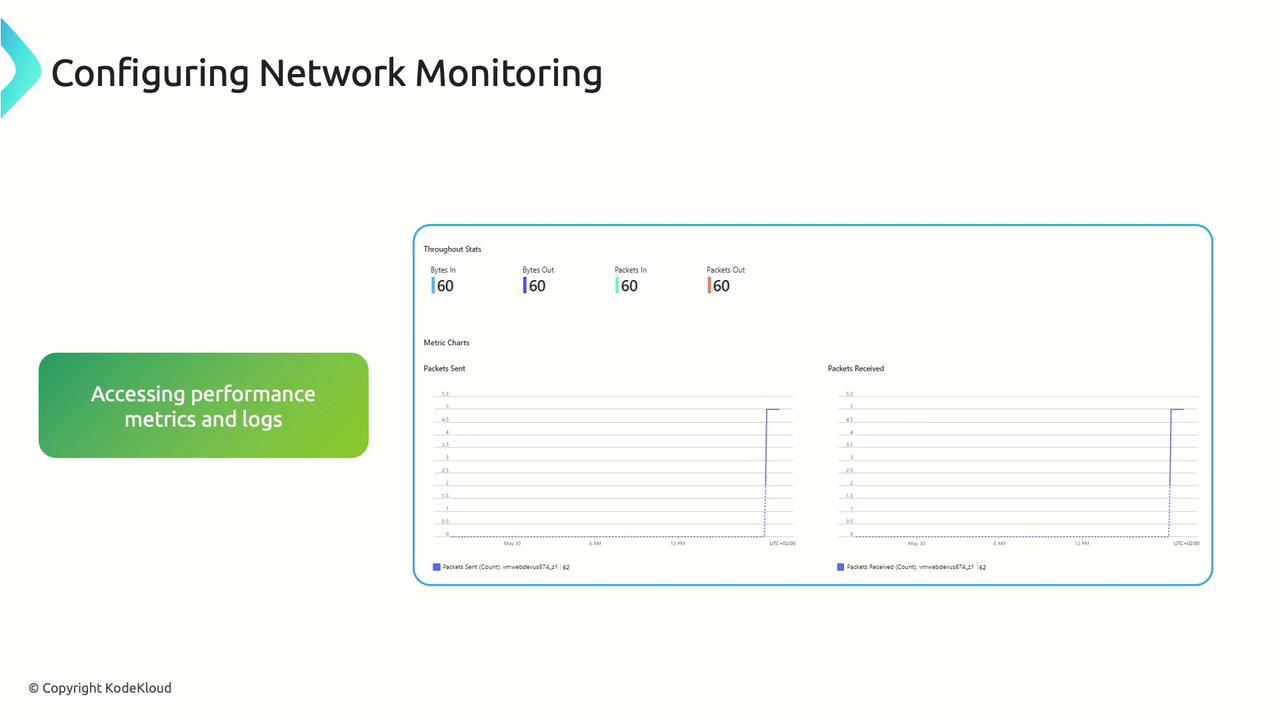
  ![The image shows a network monitoring dashboard with throughput stats and metric charts for packets sent and received. It includes a section labeled "Accessing performance metrics and logs."](https://kodekloud.com/kk-media/image/upload/v1752867484/notes-assets/images/AZ-400-Designing-and-Implementing-Microsoft-DevOps-Solutions-Configure-collection-of-telemetry-by-using-Azure-various-services/network-monitoring-dashboard-throughput-metrics.jpg)
</Frame>

***

By leveraging **Application**, **VM**, **Container**, **Storage**, and **Network Insights**, you’ll gain unified visibility across your Azure estate—detect issues faster, optimize performance, and manage costs effectively.

## Links and References

* [Azure Monitor Documentation](https://learn.microsoft.com/azure/azure-monitor/)
* [Application Insights Overview](https://learn.microsoft.com/azure/azure-monitor/app/app-insights-overview)
* [VM Insights Guide](https://learn.microsoft.com/azure/azure-monitor/vm/vm-insights-overview)
* [Container Insights for Kubernetes](https://learn.microsoft.com/azure/azure-monitor/containers/container-insights-overview)
* [Storage Analytics Logging](https://learn.microsoft.com/azure/storage/common/storage-analytics)
* [Network Monitoring in Azure](https://learn.microsoft.com/azure/network-watcher/network-watcher-monitoring-overview)

<CardGroup>
  <Card title="Watch Video" icon="video" cta="Learn more" href="https://learn.kodekloud.com/user/courses/az-400/module/7e7ab3a7-8b66-40ef-9f77-1988e32b786d/lesson/c810bac1-fa46-4df8-8ab5-4c124f143fc1" />
</CardGroup>