> ## Documentation Index
> Fetch the complete documentation index at: https://notes.kodekloud.com/llms.txt
> Use this file to discover all available pages before exploring further.
# Introduction
> Learn to implement continuous monitoring in Azure using Azure Monitor and Log Analytics for proactive issue detection and remediation.
Monitoring is a foundational component of any modern DevOps workflow. In this module, you’ll learn how to implement continuous monitoring in Azure by leveraging **Azure Monitor** and **Log Analytics** to proactively detect and remediate issues.
Azure Monitor provides a unified platform to collect, analyze, and act on telemetry from both cloud and on-premises environments. With Log Analytics, you can craft powerful Kusto Query Language (KQL) queries that turn raw data into actionable insights. Together, these tools help you maintain high availability and performance across your applications and infrastructure.
## Agenda
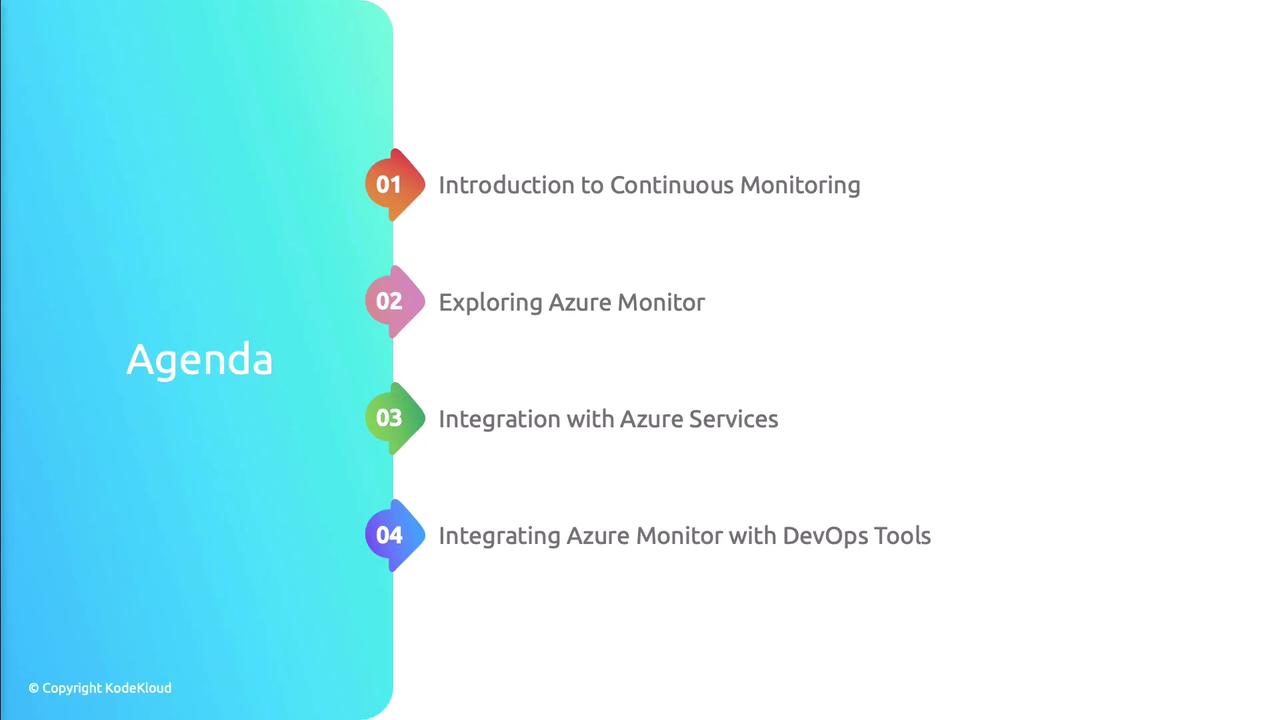
| Topic | Description |
| ---------------------- | --------------------------------------------------- |
| Continuous Monitoring | Importance of proactive issue detection in DevOps |
| Azure Monitor Features | Overview of metrics, logs, and alerts |
| Service Integrations | Connecting Azure Monitor with native Azure services |
| Log Analytics | Querying and visualizing telemetry |
***
## Practical Integration with DevOps Tools
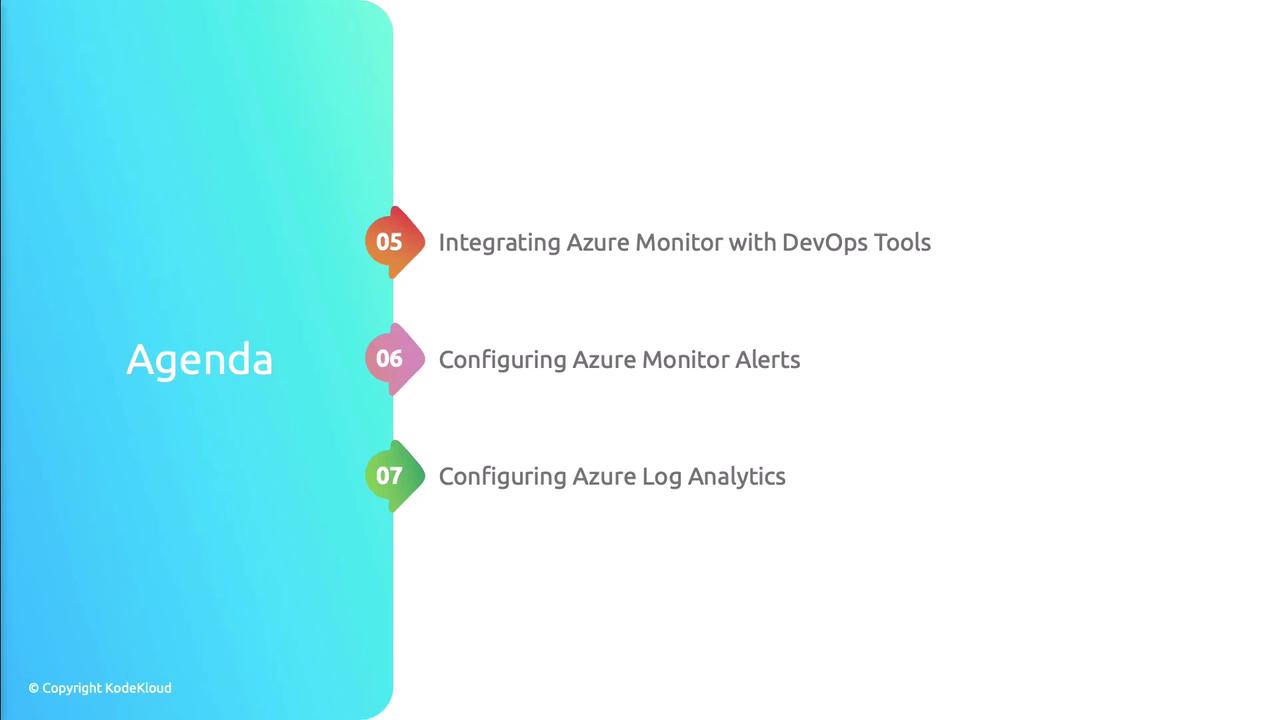
In this section, we’ll walk through hands-on examples to integrate Azure Monitor into your CI/CD pipelines and operational workflows:
1. Connecting Azure Monitor with popular DevOps platforms
2. Configuring custom alerts to triage and respond faster
3. Provisioning and managing Log Analytics workspaces via Infrastructure as Code
Automate workspace provisioning using ARM templates or [Terraform](https://registry.terraform.io/).\
Here's a quick Azure CLI example to create a Log Analytics workspace:
```bash theme={null}
# Provision Log Analytics workspace via Azure CLI
az monitor log-analytics workspace create \
--resource-group MyResourceGroup \
--workspace-name MyWorkspace \
--location eastus
```
***
## Configuring Telemetry Collection
To achieve full-stack observability, you must collect telemetry across applications, VMs, containers, storage, and networks. Azure offers specialized solutions for each domain.
### Azure Telemetry Services Overview
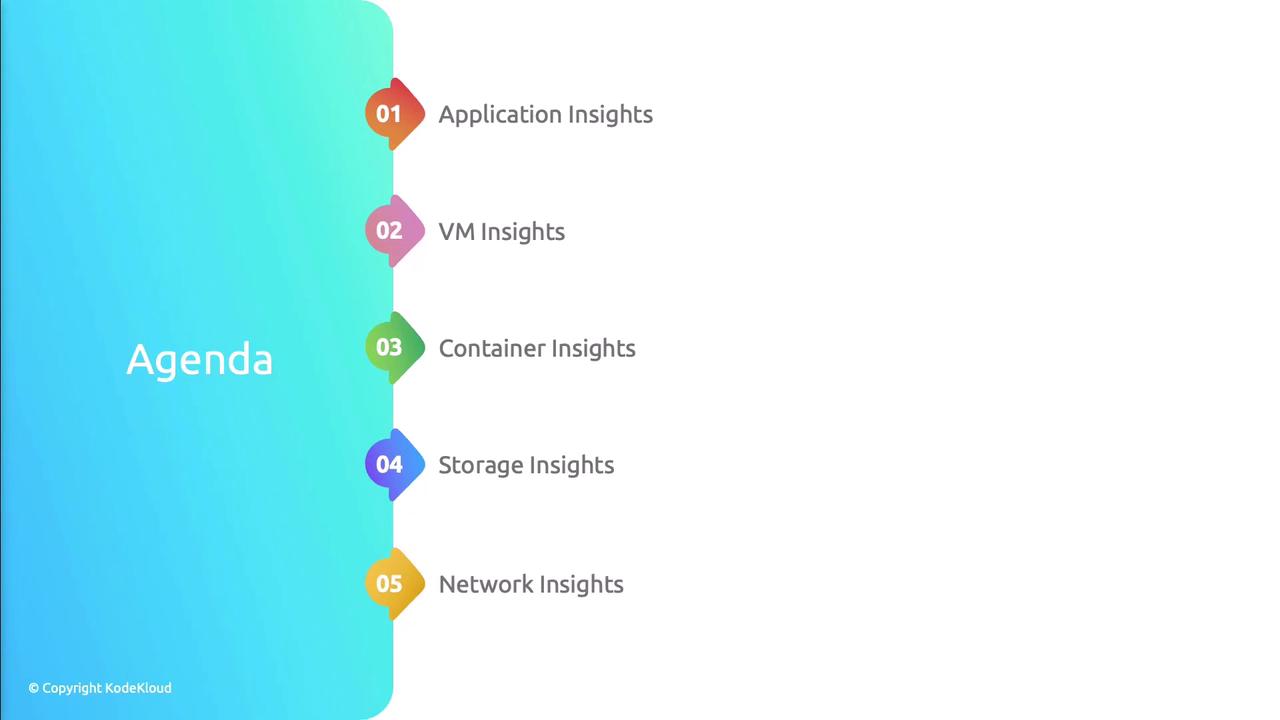
| Service | Use Case |
| -------------------- | ------------------------------------------------------- |
| Application Insights | Monitor application performance and end-user experience |
| VM Insights | Collect host-level metrics and process information |
| Container Insights | Analyze container health in AKS and other Kubernetes |
| Storage Insights | Track I/O metrics and health of storage accounts |
| Network Insights | Visualize network topology and performance issues |
***
By the end of this lesson, you'll be able to:
* Set up data collection across multiple Azure services
* Author KQL queries to analyze and correlate logs and metrics
* Build interactive dashboards in Azure Monitor and Log Analytics
## Links and References
* [Azure Monitor Documentation](https://docs.microsoft.com/azure/azure-monitor/)
* [Log Analytics workspace overview](https://docs.microsoft.com/azure/azure-monitor/logs/log-analytics-overview)
* [Kusto Query Language (KQL) Basics](https://docs.microsoft.com/azure/data-explorer/kusto/query/)