> ## Documentation Index
> Fetch the complete documentation index at: https://notes.kodekloud.com/llms.txt
> Use this file to discover all available pages before exploring further.
# Understanding Code Coverage
> This article explains code coverage in Azure Pipelines, its importance, types, integration, analysis, and best practices for effective testing.
Ensuring that your application behaves as expected requires more than just writing code—it demands thorough testing. Code coverage quantifies how much of your codebase is exercised by automated tests, helping teams detect untested logic, reduce bugs, and maintain long-term software quality.
## What Is Code Coverage?
Code coverage is a metric that shows the proportion of your source code executed during test runs. By highlighting untested regions, it helps you:
* Identify missing tests
* Prevent regressions
* Increase confidence in deployments
Untested code can hide defects and increase maintenance costs. Integrating coverage analysis into your CI/CD pipeline reveals these gaps early, making your testing efforts more effective.
Azure Pipelines automates coverage collection alongside build and test steps, ensuring your quality gates stay green without manual intervention.
## Types of Code Coverage
Understanding different coverage metrics lets you choose the right level of testing rigor:
| Coverage Metric | Description |
| ------------------ | ------------------------------------------------------------------- |
| Statement Coverage | Measures how many individual statements have been run. |
| Branch Coverage | Ensures each decision point (e.g., `if/else`, `switch`) is covered. |
| Path Coverage | Validates all possible execution routes through the code. |
Branch and path coverage provide deeper insight into complex logic but can be more challenging to achieve.

## Integrating Coverage in Azure Pipelines
A robust CI/CD pipeline typically follows these steps:
1. **Run tests** to execute your code paths
2. **Collect coverage metrics** from test reports
3. **Publish results** to your pipeline dashboard
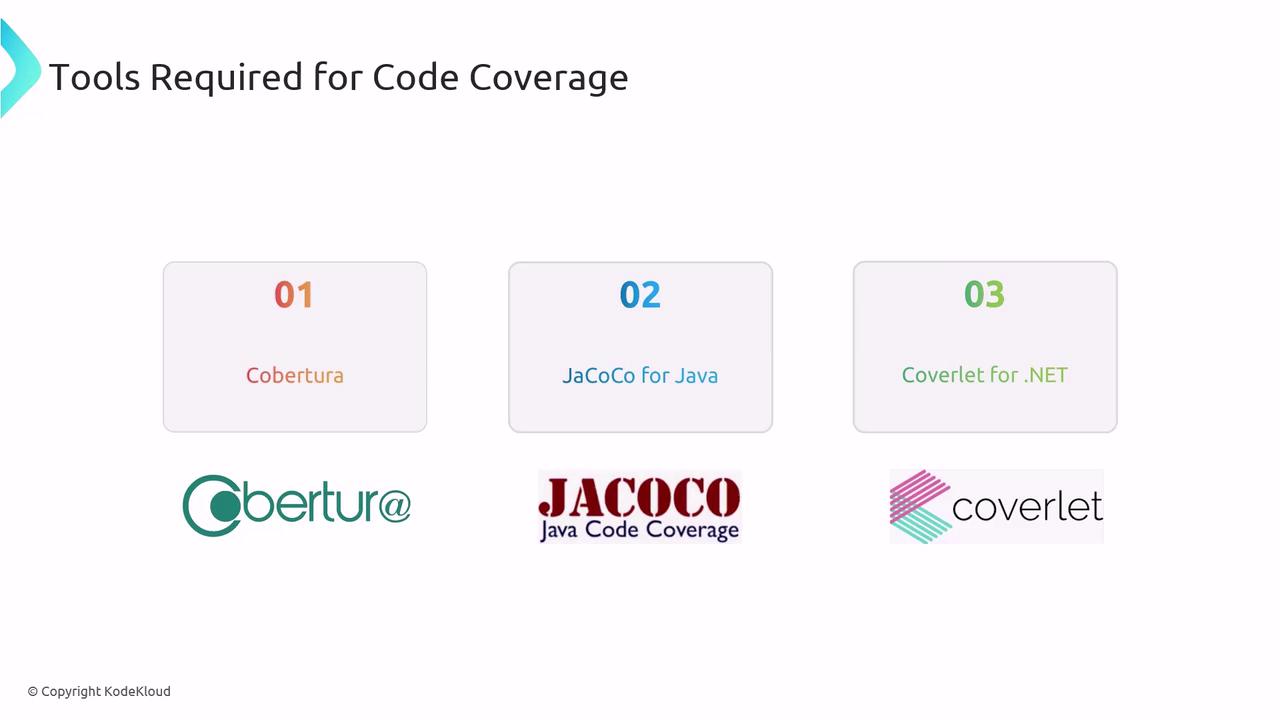
Popular tools include [Cobertura][cobertura] and [JaCoCo][jacoco] for Java, plus [Coverlet][coverlet] for .NET.
Below is a sample YAML configuration for a .NET application in Azure Pipelines:
```yaml theme={null}
trigger:
- main
pool:
vmImage: 'ubuntu-latest'
steps:
- script: echo "Setting up test environment..."
displayName: 'Initialize'
- task: DotNetCoreCLI@2
inputs:
command: 'test'
projects: '**/*Tests/*.csproj'
arguments: '--configuration Release --collect "Code coverage"'
displayName: 'Run Tests with Coverage'
- task: PublishCodeCoverageResults@1
inputs:
codeCoverageTool: 'Cobertura'
summaryFileLocation: '$(Build.SourcesDirectory)/**/coverage.cobertura.xml'
reportDirectory: '$(Build.SourcesDirectory)/**/coverageReport'
displayName: 'Publish Coverage Report'
- script: echo "Pipeline tasks completed successfully."
displayName: 'Finalize'
```
Azure Pipelines’ modular tasks let you extend this setup with additional analysis, security scans, or deployment stages.
## Viewing and Analyzing Coverage Reports
Once the pipeline finishes:
* Check the **Summary** tab for overall coverage percentages
* Open the **Code Coverage** tab for detailed reports, including missed lines and risk areas
* Download raw data for offline review or integration with other tools
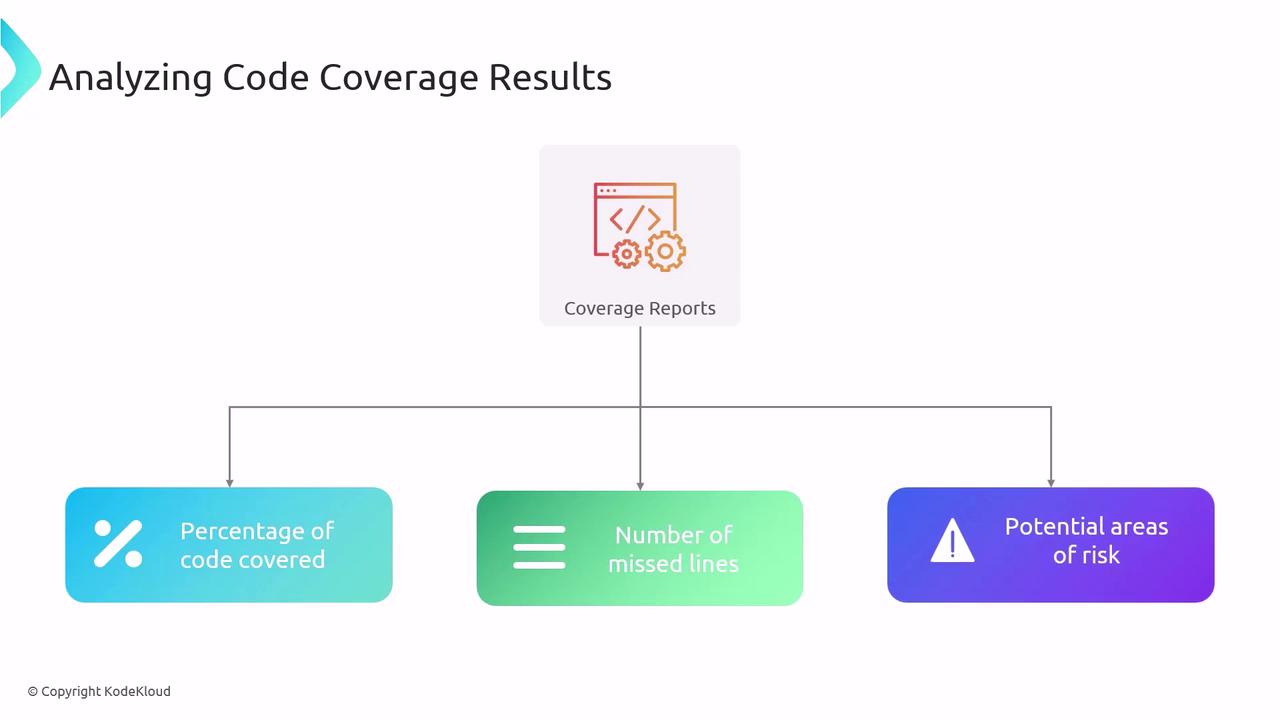
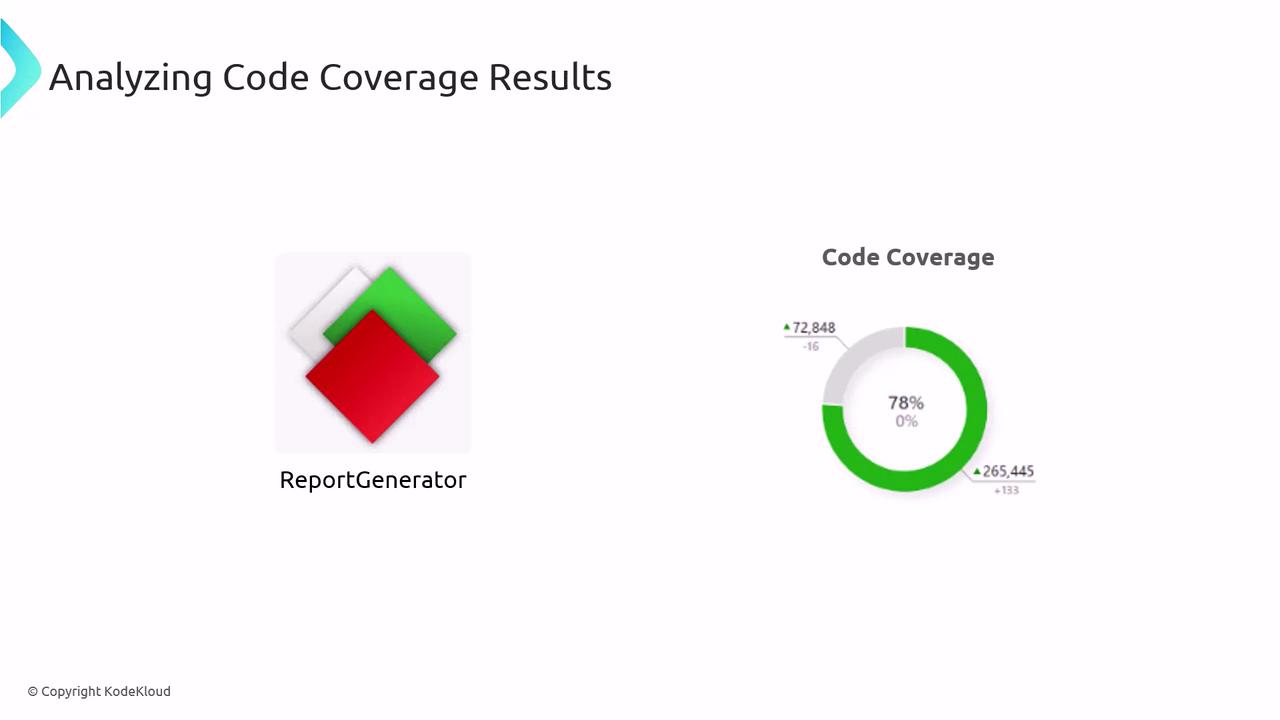
To create richer visualizations, use [ReportGenerator][reportgenerator], which transforms XML and other coverage data into HTML reports with charts and summaries.
## Best Practices
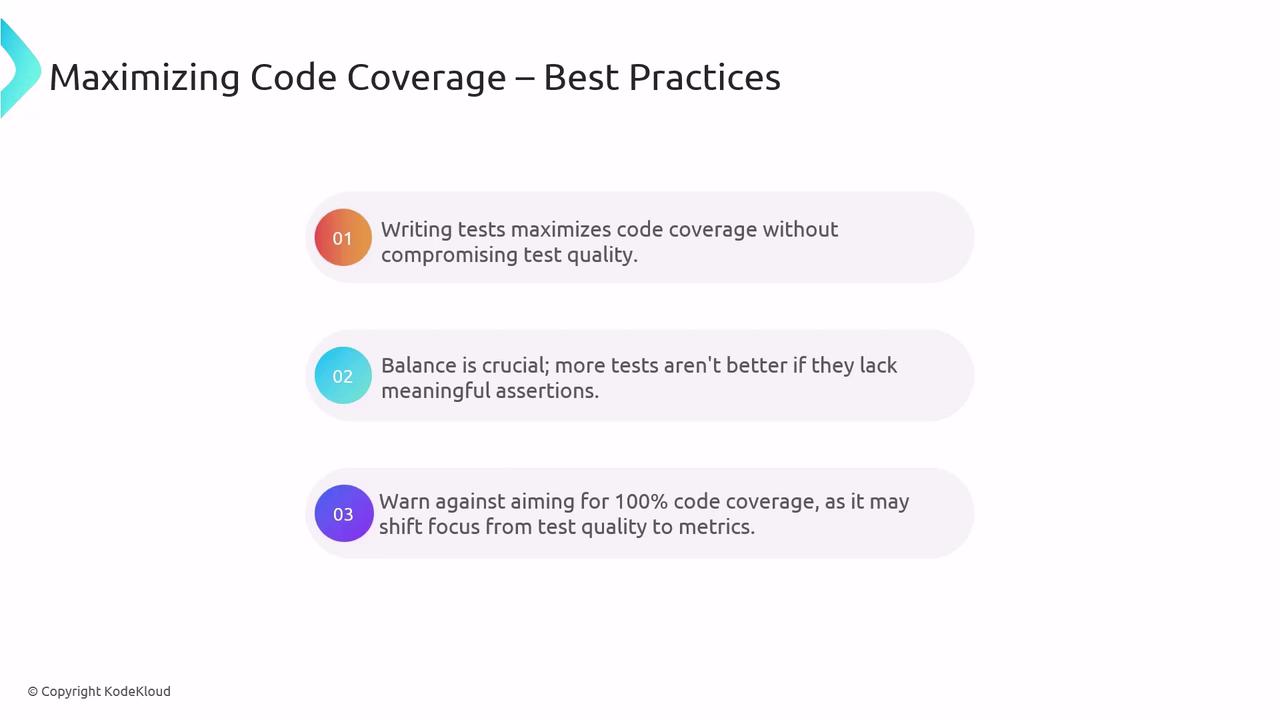
* Prioritize **meaningful tests** over sheer coverage percentages.
* Avoid brittle tests by focusing on stability and maintainability.
* Use coverage thresholds strategically—don’t make 100% a hard requirement.
* Review uncovered code during retrospectives to plan new tests.
Chasing 100% coverage can lead to overly complex or low-value tests. Focus on critical paths and high-risk modules instead.
## References
* [Azure Pipelines Documentation][azure-pipelines]
* [Cobertura][cobertura]
* [JaCoCo][jacoco]
* [Coverlet][coverlet]
* [ReportGenerator][reportgenerator]
[cobertura]: https://cobertura.github.io/cobertura/
[jacoco]: https://www.eclemma.org/jacoco/
[coverlet]: https://github.com/coverlet-coverage/coverlet
[azure-pipelines]: https://docs.microsoft.com/azure/devops/pipelines/
[reportgenerator]: https://github.com/danielpalme/ReportGenerator