> ## Documentation Index
> Fetch the complete documentation index at: https://notes.kodekloud.com/llms.txt
> Use this file to discover all available pages before exploring further.
# Analyze pipeline load to determine agent configuration and capacity
> Learn to analyze Azure Pipelines load and optimize agent configuration and capacity for efficient CI/CD workflows.
In this lesson, you will learn how to analyze Azure Pipelines load and optimize agent configuration and capacity. Whether you’re preparing for the AZ-400 certification or streamlining your CI/CD workflows, understanding agent pools, concurrency, and performance metrics is key to efficient, cost-effective builds and deployments.
## 1. Agent Types and Pools in Azure Pipelines
Azure Pipelines agents execute your jobs. There are two primary types:
* **Microsoft-hosted agents**: Preconfigured and maintained by Microsoft, but limited in customization.
* **Self-hosted agents**: Fully under your control—OS updates, scaling, and security are your responsibility.
Agents are grouped into **agent pools**, which you share across projects and pipelines.
Self-hosted agents offer greater flexibility but require you to handle maintenance, OS patches, and infrastructure scaling.
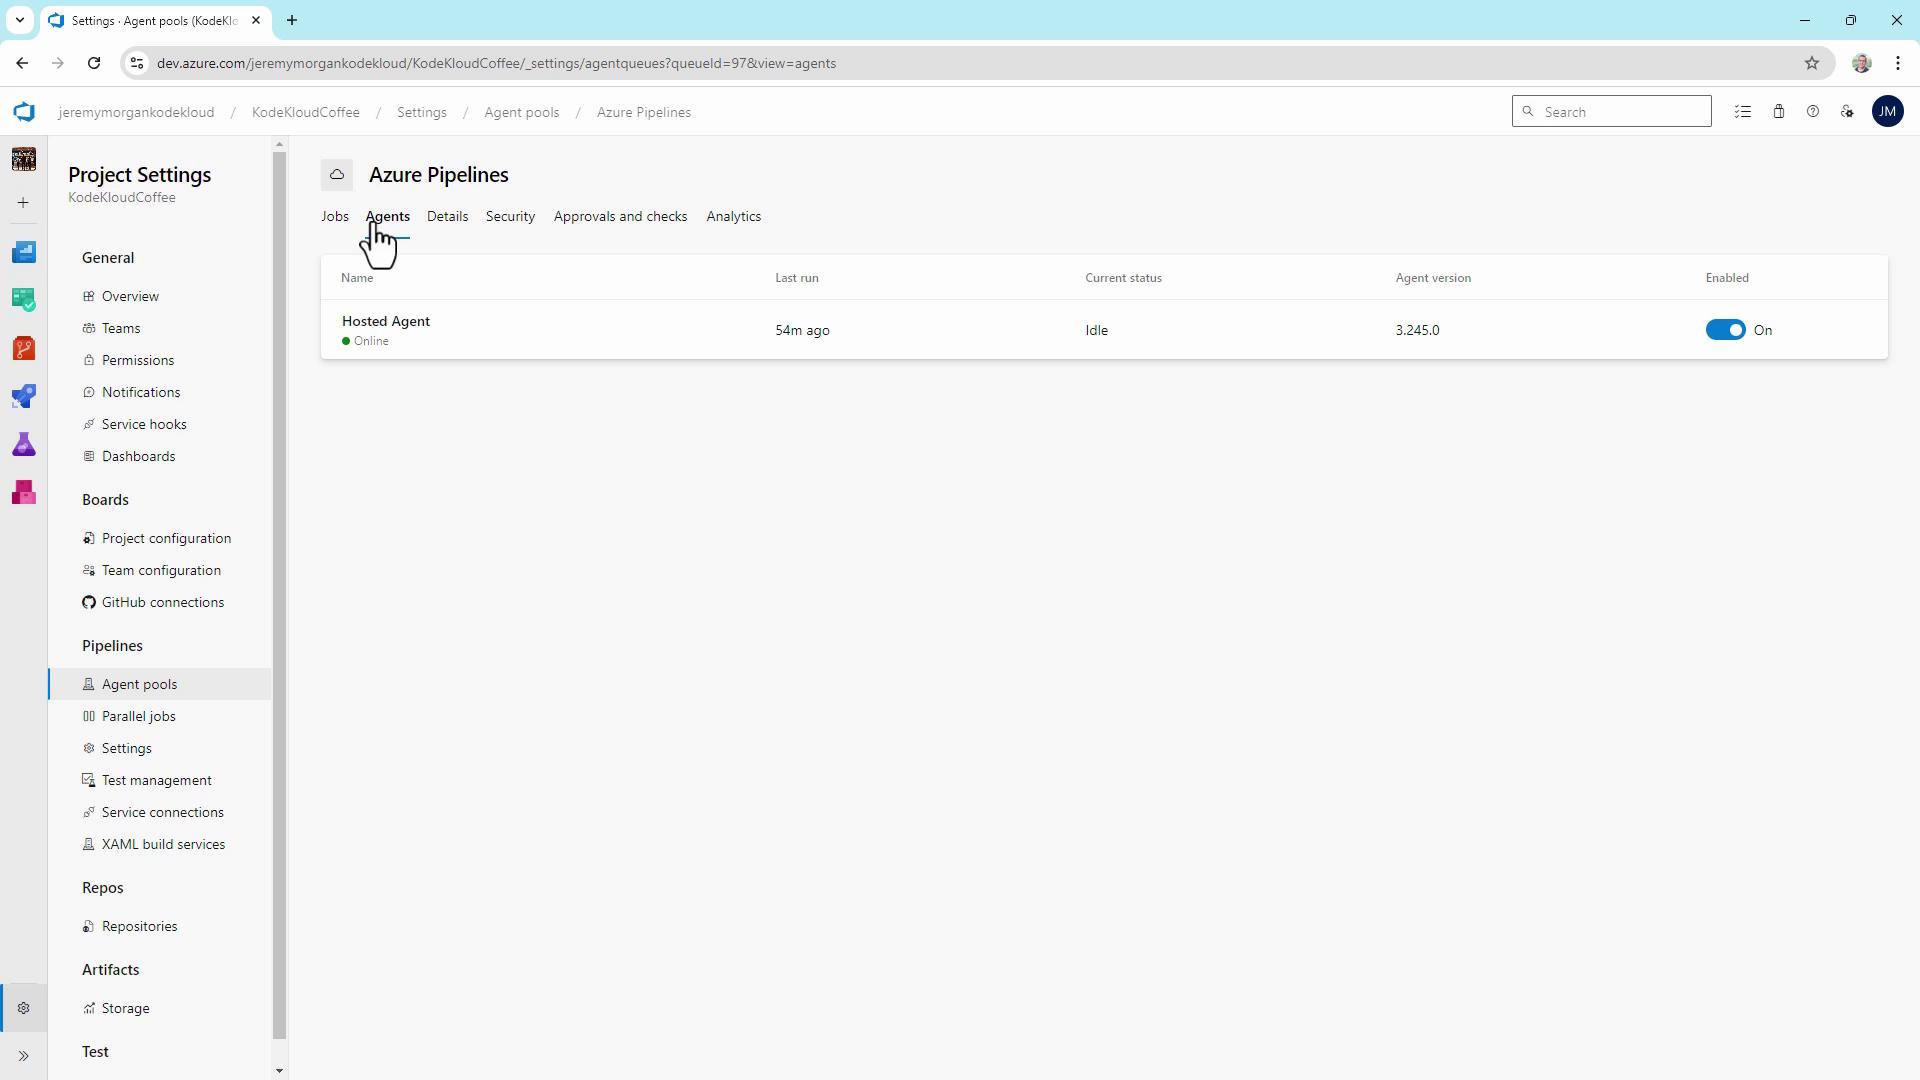
### Viewing Agent Pools
1. In Azure DevOps, navigate to **Project Settings > Agent pools**.
2. Review each pool’s agents and their status (online, idle, offline).
## 2. Analyzing Microsoft-hosted Agent Usage
To inspect Microsoft-hosted agent performance:
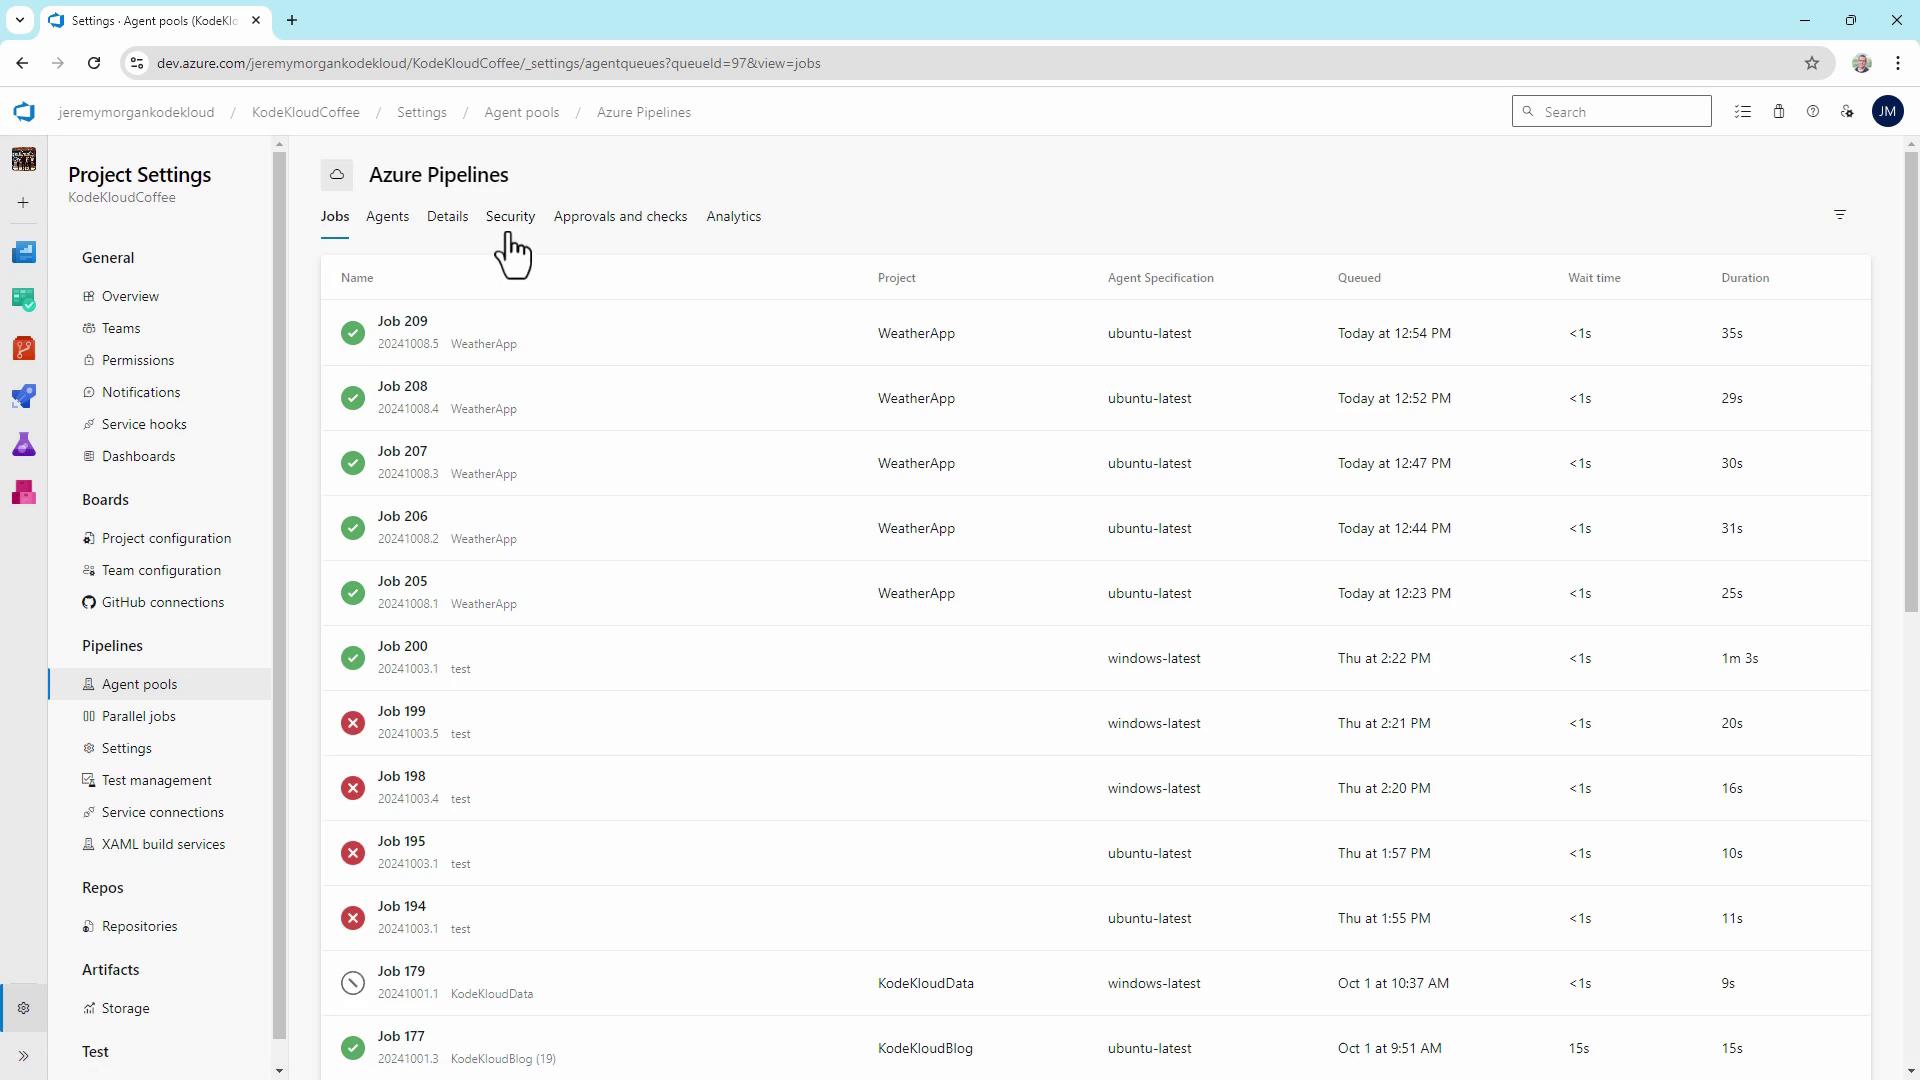
1. Go to **Pipelines > Jobs**.
2. Examine **queue time**, **wait time**, and **duration** for each job.
## 3. Monitoring Pool Consumption and Concurrency
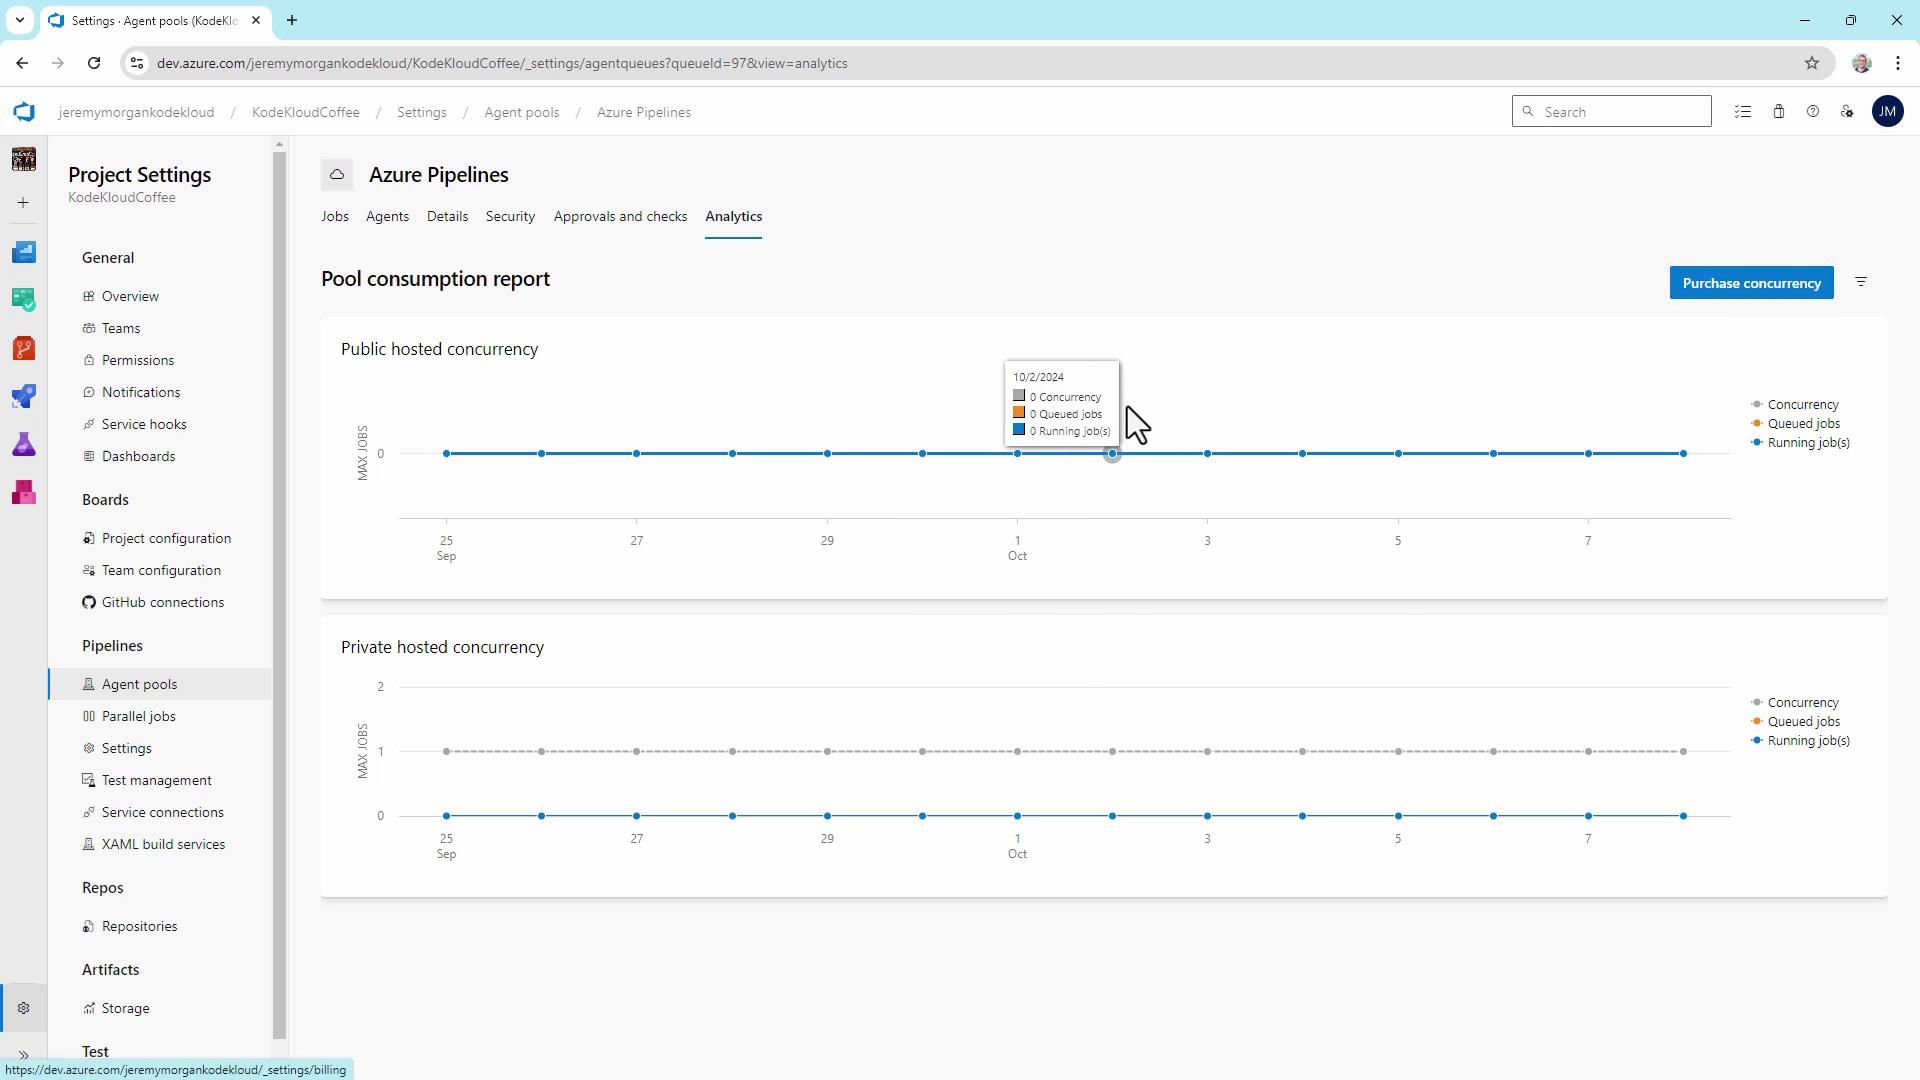
The **Pool consumption** dashboard provides insight into concurrent job usage, queued jobs, and running jobs. More concurrency reduces queue time but increases cost.
## 4. Using Self-hosted Agents
Under **Agent pools > Default**, register your own Windows, Linux, or container-based agents. These can run on-premises or in any cloud subscription, giving you full control over VM size and software dependencies.
## 5. Key Pipeline Performance Metrics
Track these metrics to right-size your agents and pipelines:
| Metric | Definition | Benefit |
| ------------------ | -------------------------------------------- | --------------------------------- |
| Queue time | Time a job waits before an agent picks it up | Spot peak-load bottlenecks |
| Job execution time | Duration from job start to completion | Identify slow build or test steps |
| Parallel builds | Number of jobs running simultaneously | Optimize agent utilization |
## 6. Viewing Pipeline Analytics
Navigate to **Pipelines > \[Your Pipeline] > Analytics** for:
* **Pipeline Pass Rate**
* **Test Pass Rate**
* **Pipeline Duration**
Click **Pipeline Duration** to view overall run times and the top 10 slowest steps.
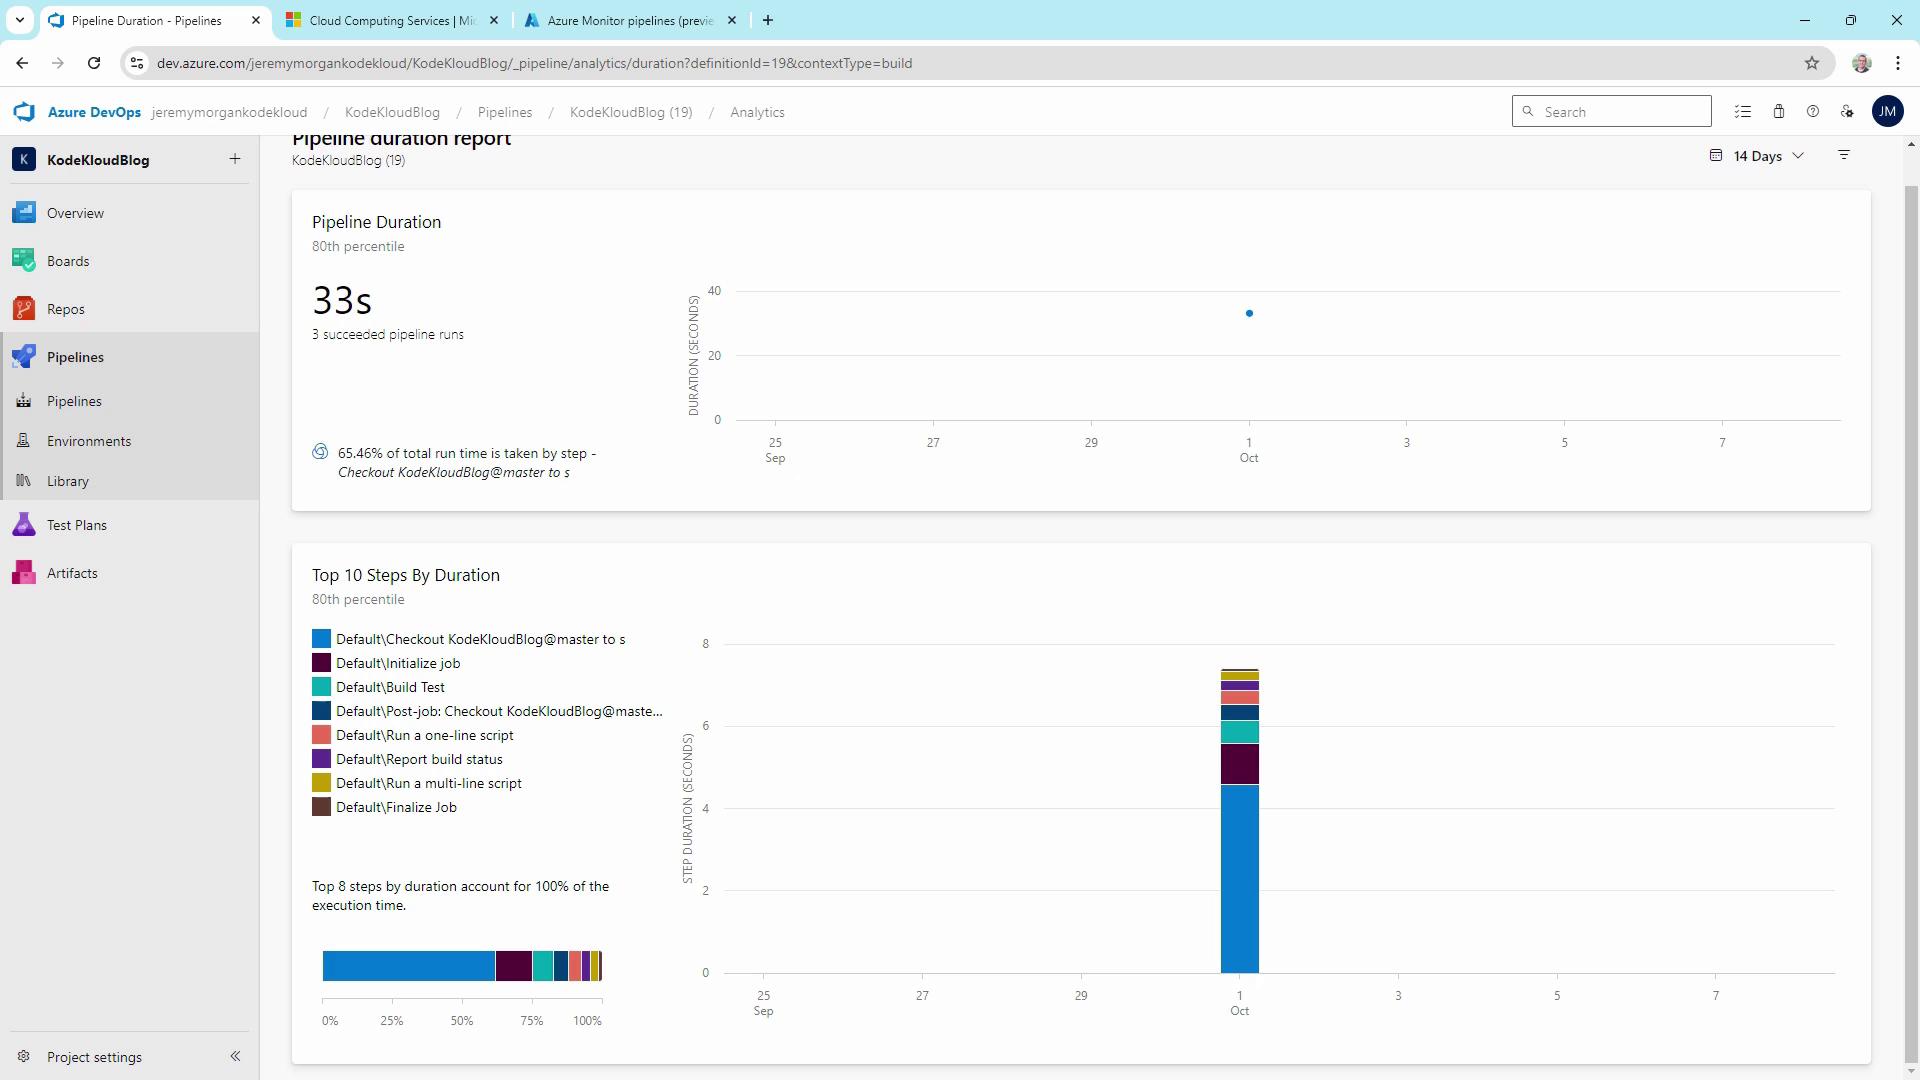
In this example, **checkout** and **initialize job** are the longest steps. Optimizing these can significantly reduce total run time.
## 7. Comparing Pipeline Step Durations
Compare multiple pipelines to spot heavy tasks like VSTest or VSBuild.
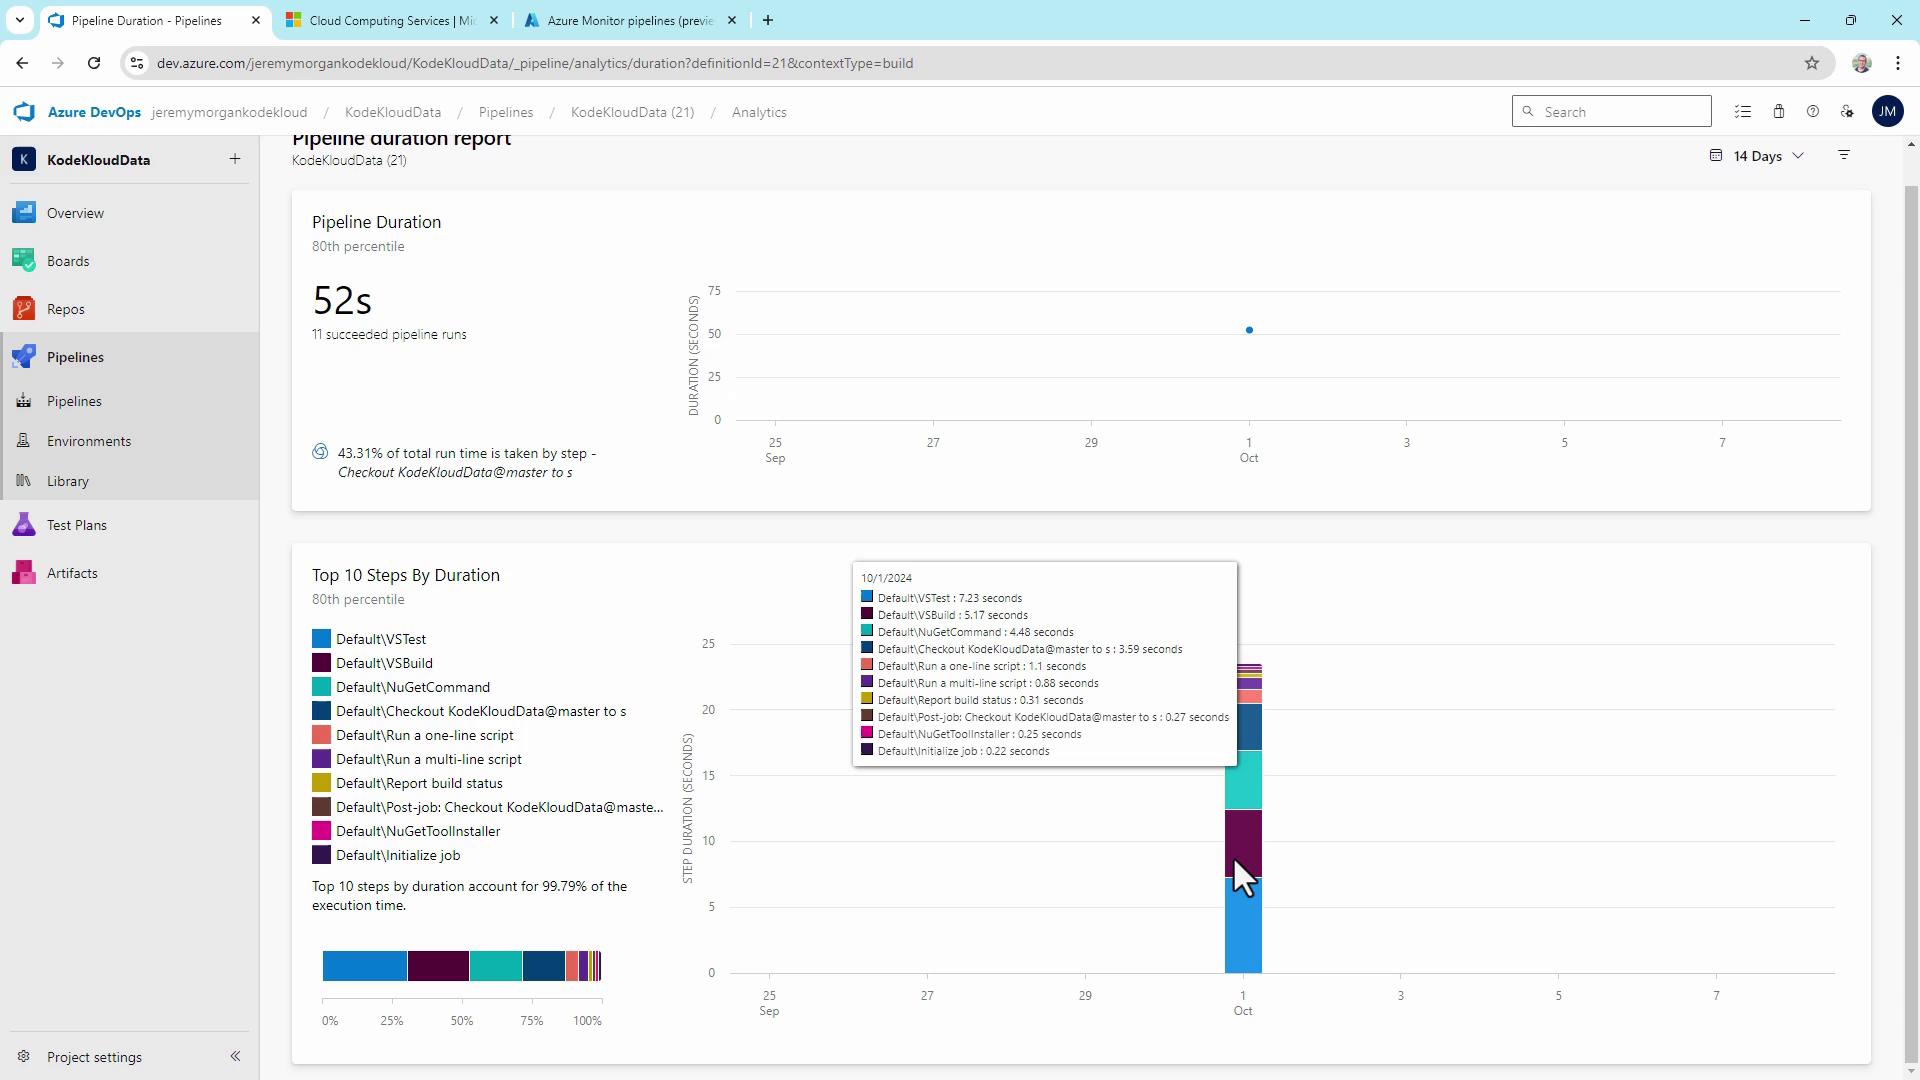
Long-running test or build phases often benefit from more CPU, memory, or additional self-hosted agents.
## 8. Managing Parallel Jobs and Capacity
Under **Project Settings > Parallel jobs**, view your subscription’s limits:
| Tier | Parallel jobs | Free minutes/month | Notes |
| ----------- | ------------- | ------------------ | -------------------------------- |
| Free | 1 | 1,800 | Suited for individual developers |
| Paid | Up to 10+ | Unlimited | Scale with purchased concurrency |
| Self-hosted | Unlimited | N/A | Only limited by your hardware |
Hitting your parallel job or minute quota will pause pipeline execution. Plan upgrades or add self-hosted agents proactively.
## 9. Custom Dashboards and Widgets
Aggregate metrics on a single pane:
1. Go to **Overview > Dashboards**.
2. Click **Add widget**, search for “Pipeline.”
3. Add **Build History**, **Release Pipeline Overview**, or community widgets from the Extension Marketplace.
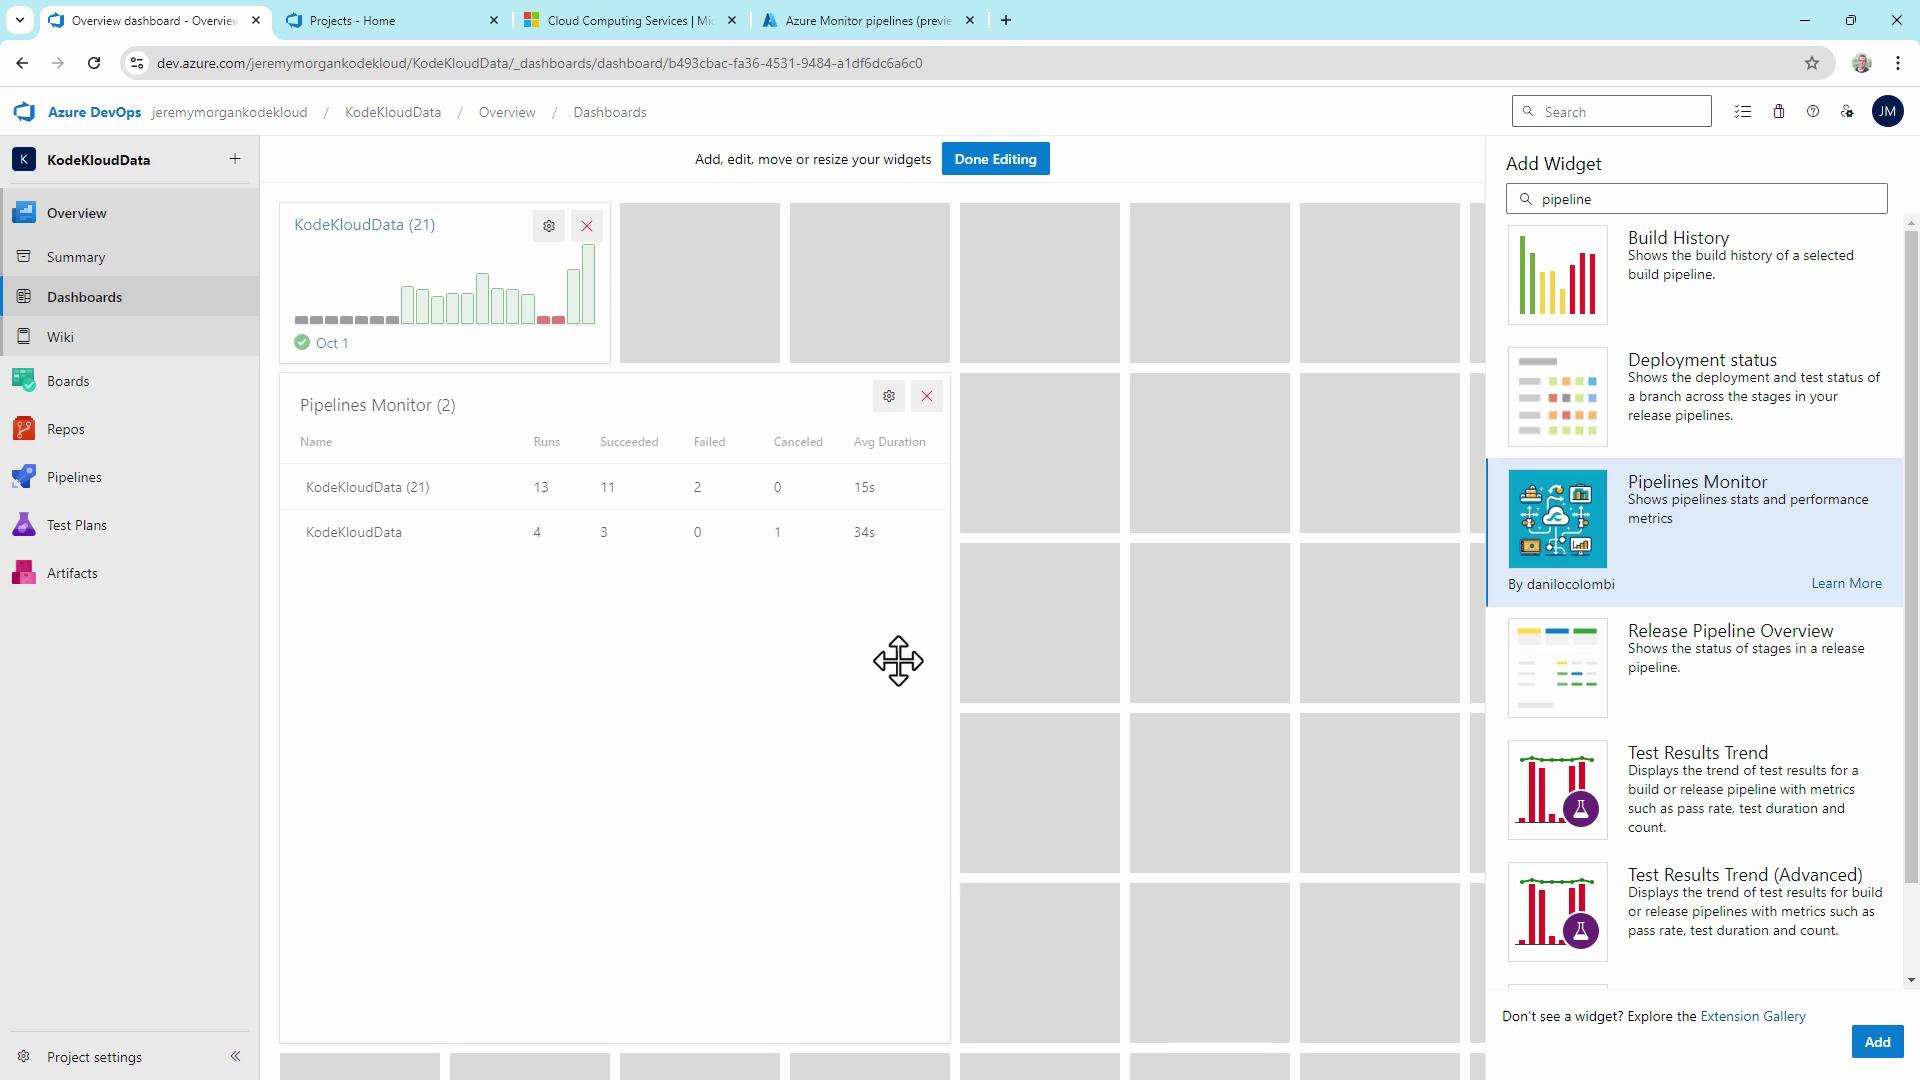
Monitoring **Average Duration** trends helps determine when to scale agents.
## 10. Integrating with Azure Log Analytics
For advanced telemetry, stream pipeline logs to an Azure Log Analytics workspace. Query build and release metrics over time for root-cause analysis.
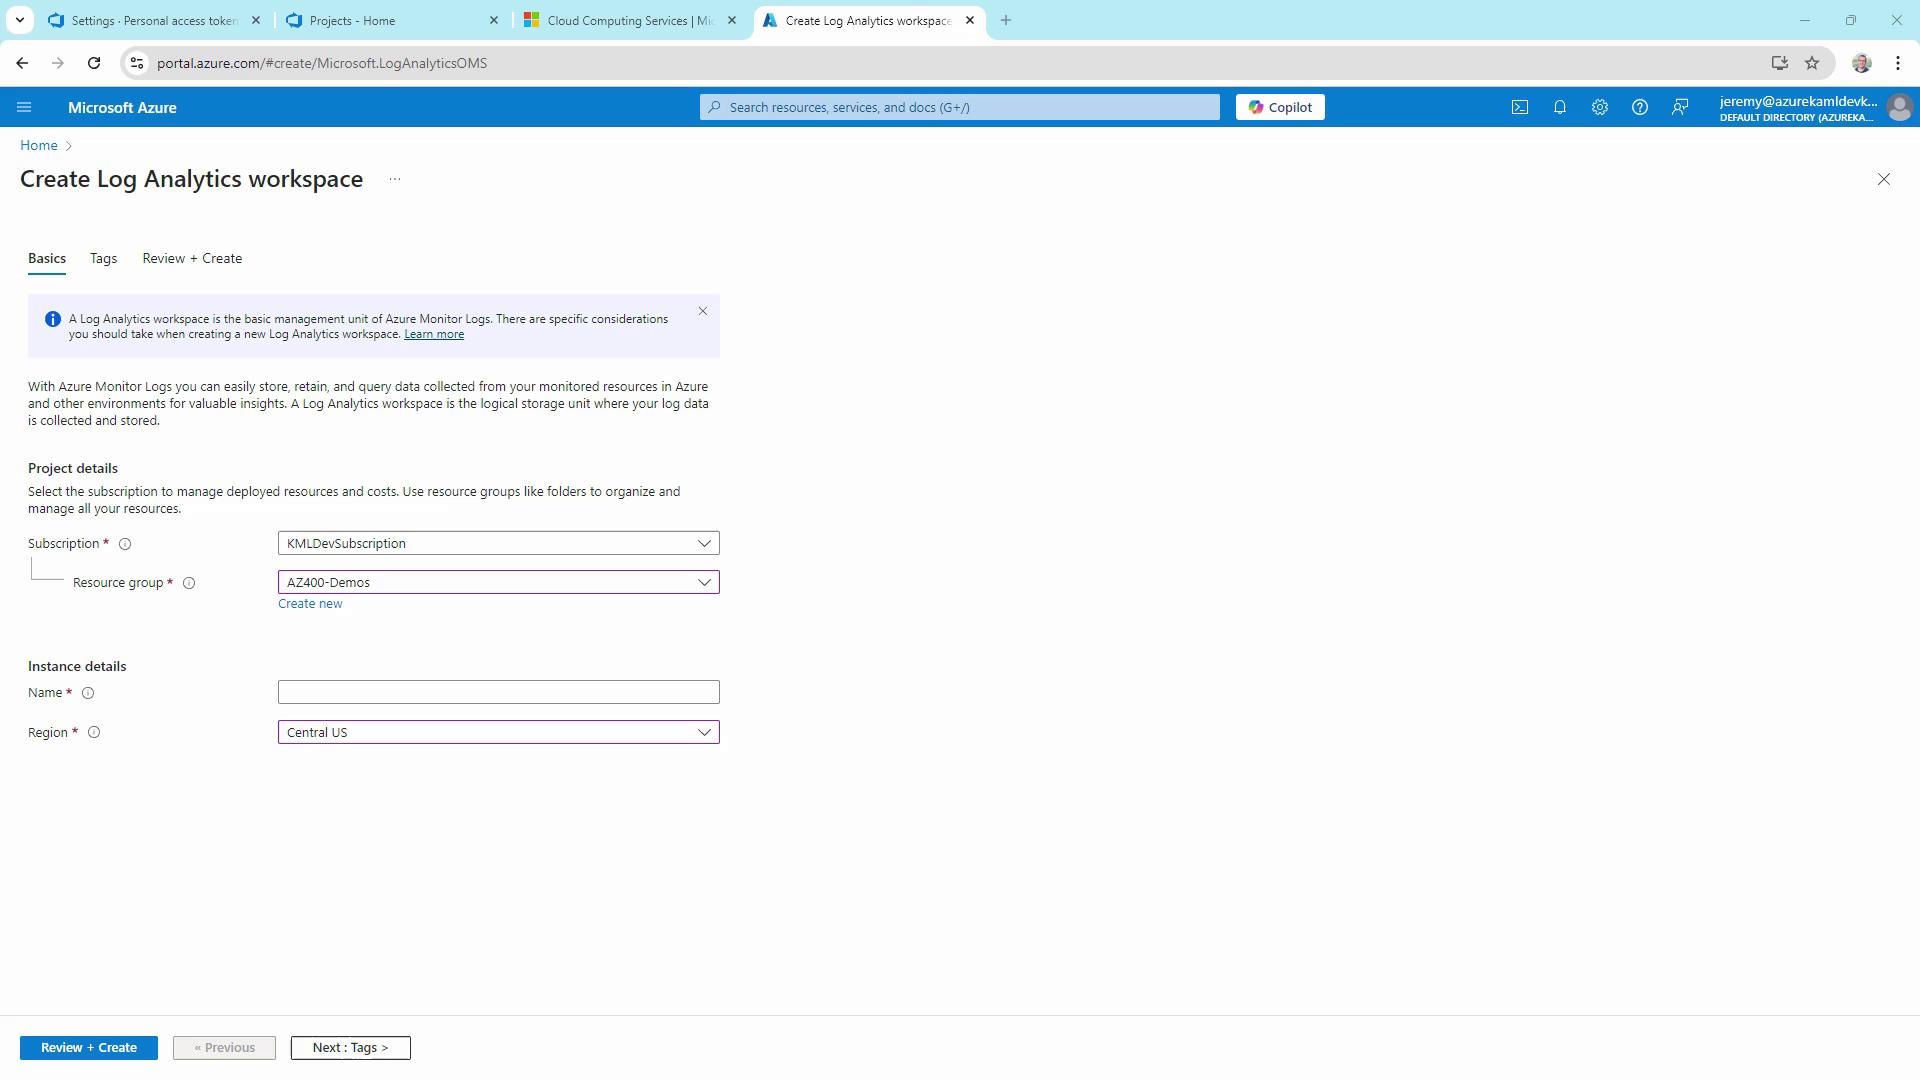
Learn more in the [Azure Monitor Logs documentation](https://learn.microsoft.com/en-us/azure/azure-monitor/logs/log-analytics-overview).
## 11. Provisioning Additional Build Agents
To scale quickly, install the **Build Agents for Azure DevOps** solution from the Azure Marketplace. It automates VM provisioning and agent registration:
1. Select your subscription, resource group, and region.
2. Choose VM size (vCPUs, RAM).
3. Deploy and connect to your agent pool.
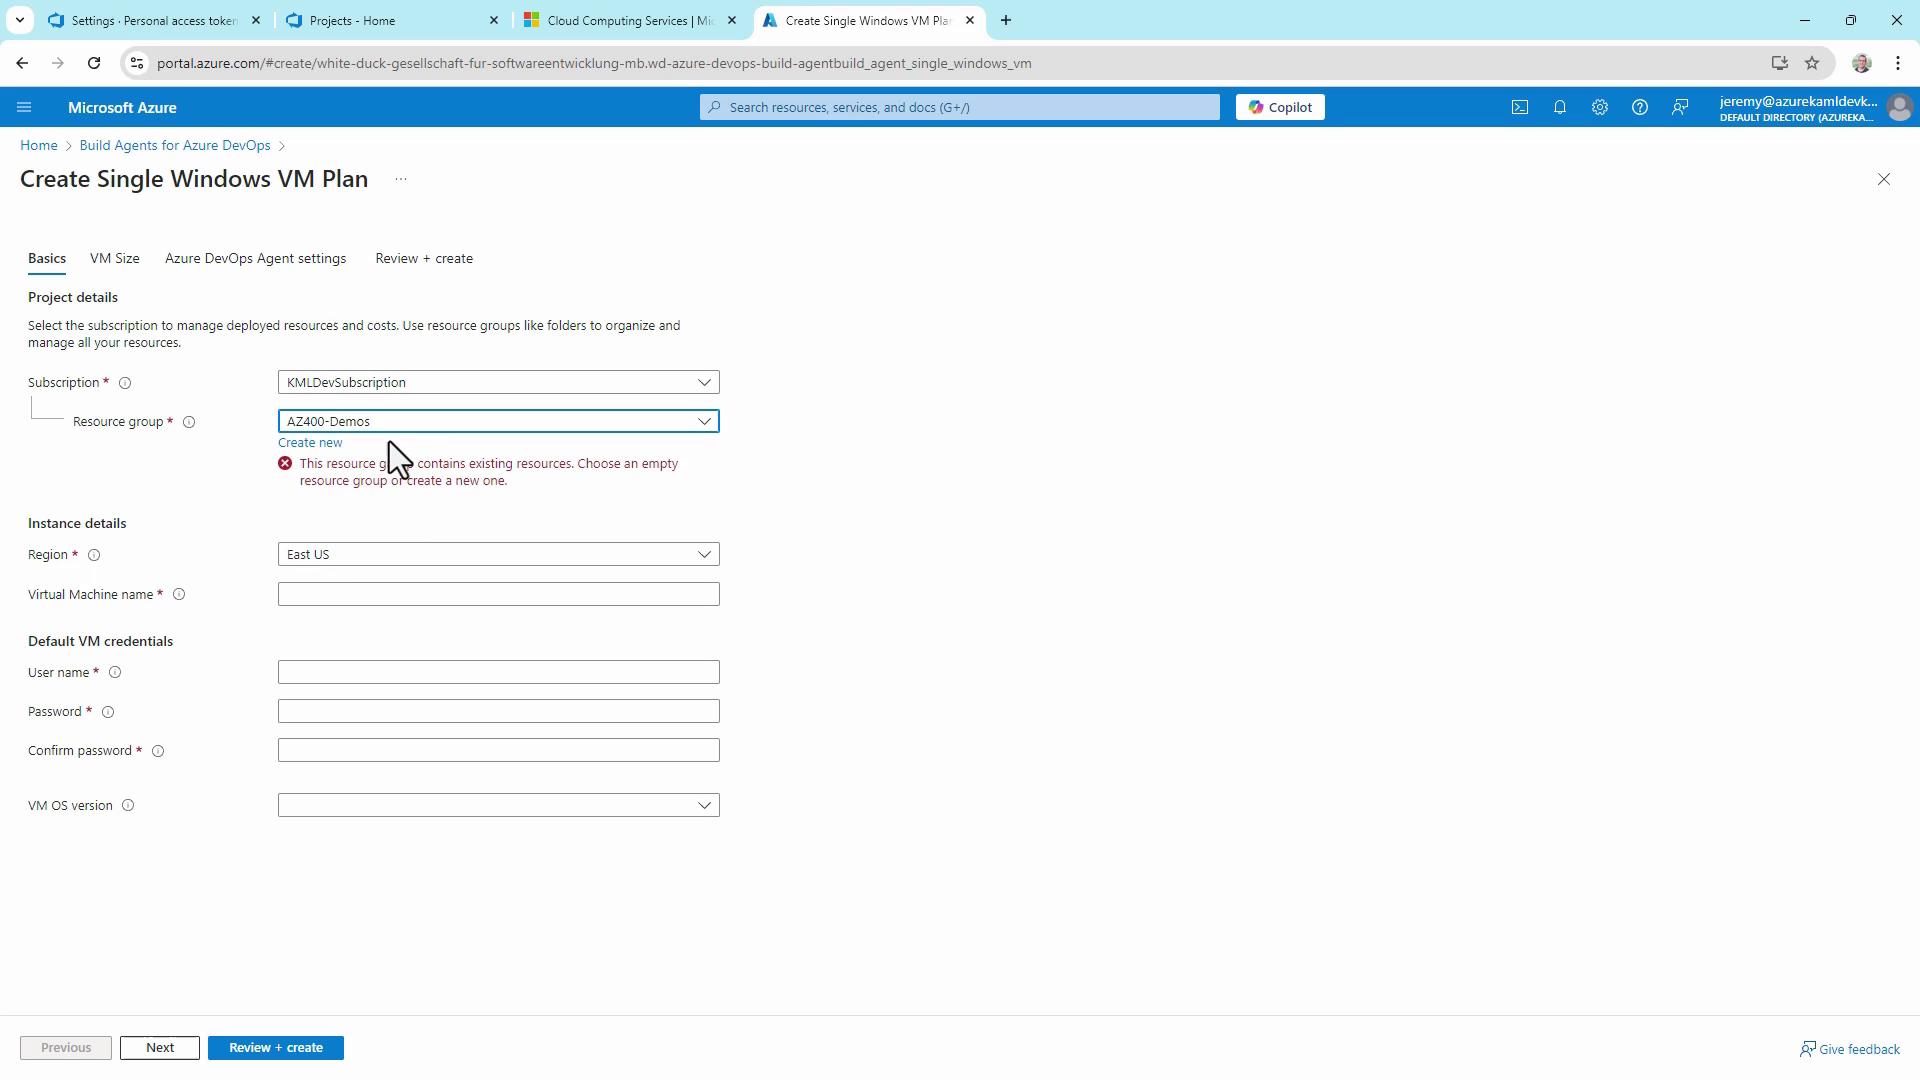
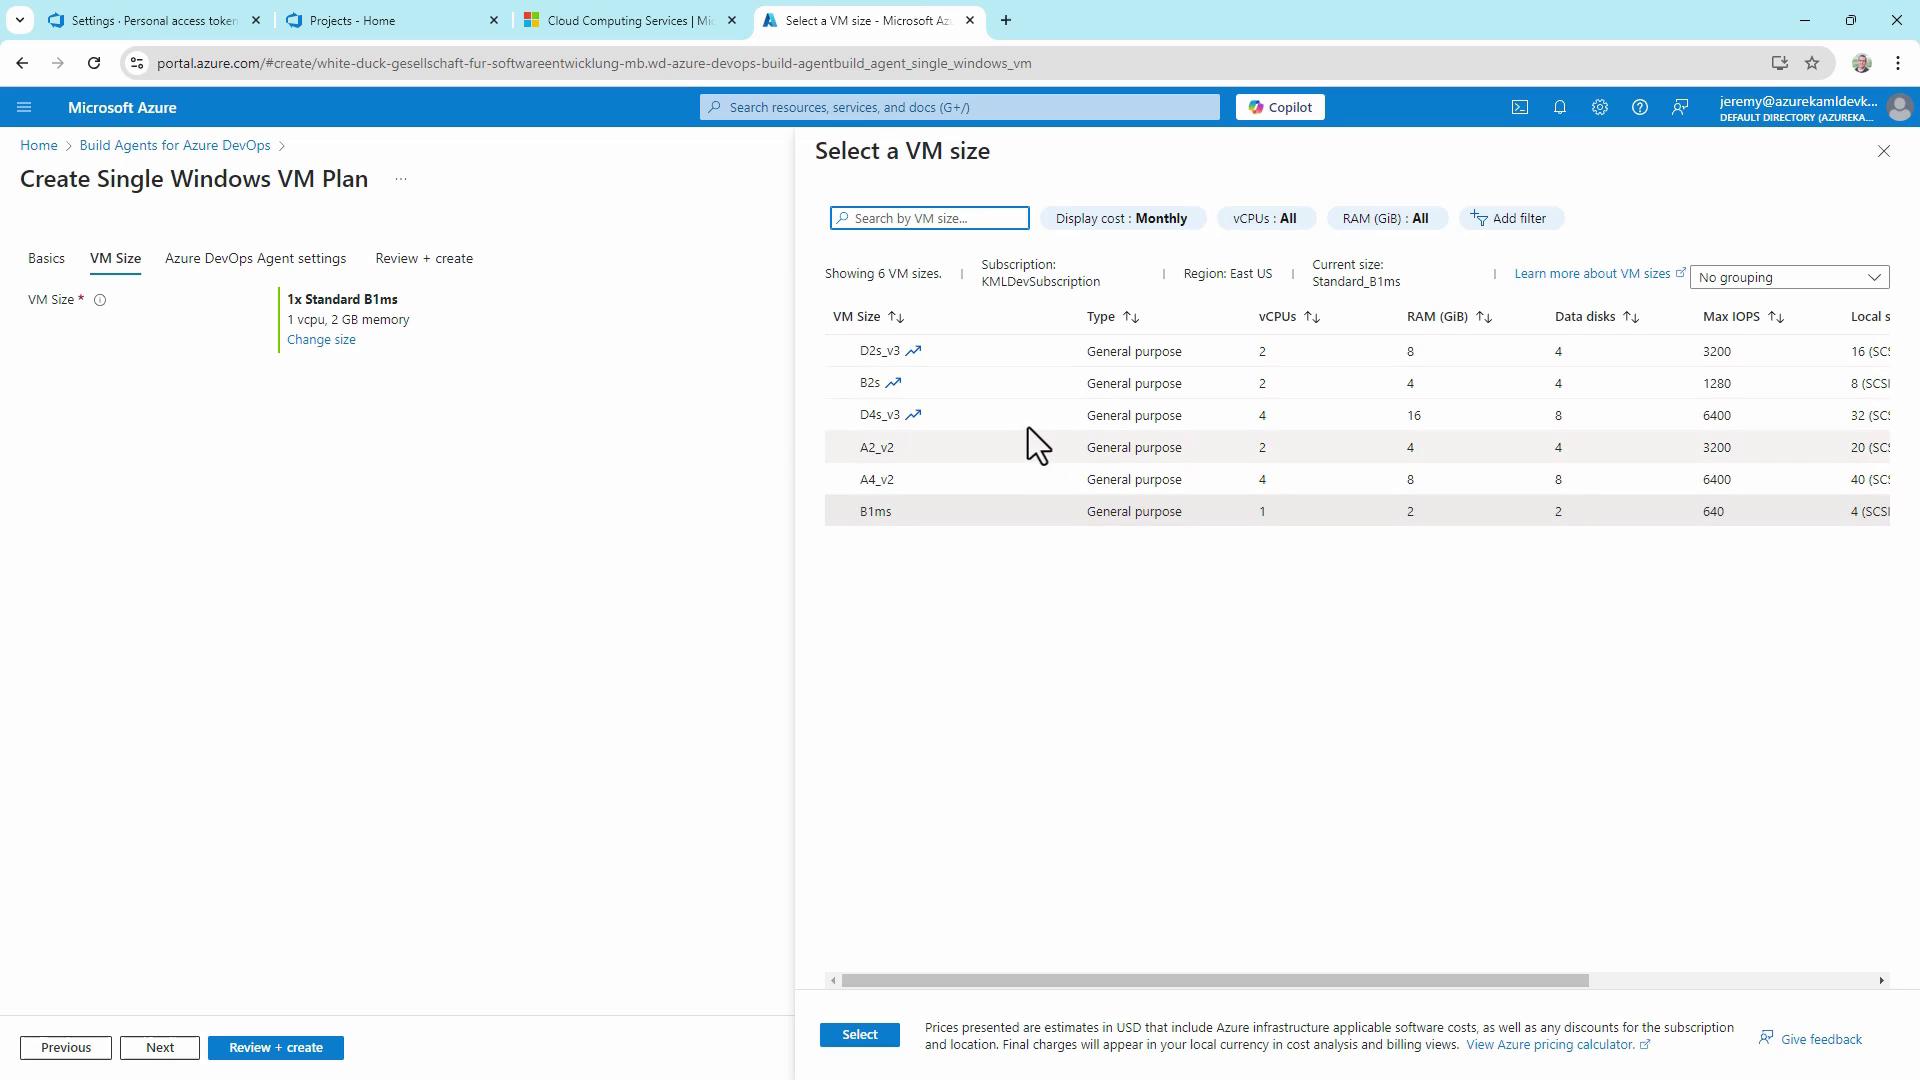
Alternatively, create VMs manually or via your own ARM/Bicep templates.
## Conclusion
Tracking queue time, execution time, and concurrency enables you to right-size Azure Pipelines agents and avoid bottlenecks. Use built-in analytics, custom dashboards, Log Analytics, and Marketplace extensions to monitor performance and scale your CI/CD infrastructure on demand.
## Links and References
* [Azure Pipelines Documentation](https://learn.microsoft.com/azure/devops/pipelines/)
* [AZ-400 Exam: Designing and Implementing Microsoft DevOps Solutions](https://learn.microsoft.com/en-us/certifications/exams/az-400)
* [Build Agents for Azure DevOps Marketplace](https://marketplace.visualstudio.com/items?itemName=ms.vss-admin.buildmachines)