> ## Documentation Index
> Fetch the complete documentation index at: https://notes.kodekloud.com/llms.txt
> Use this file to discover all available pages before exploring further.
# Azure Monitor
> Overview of Azure Monitor features for collecting, analyzing, visualizing, and automating responses to metrics and logs to maintain cloud infrastructure health and observability.
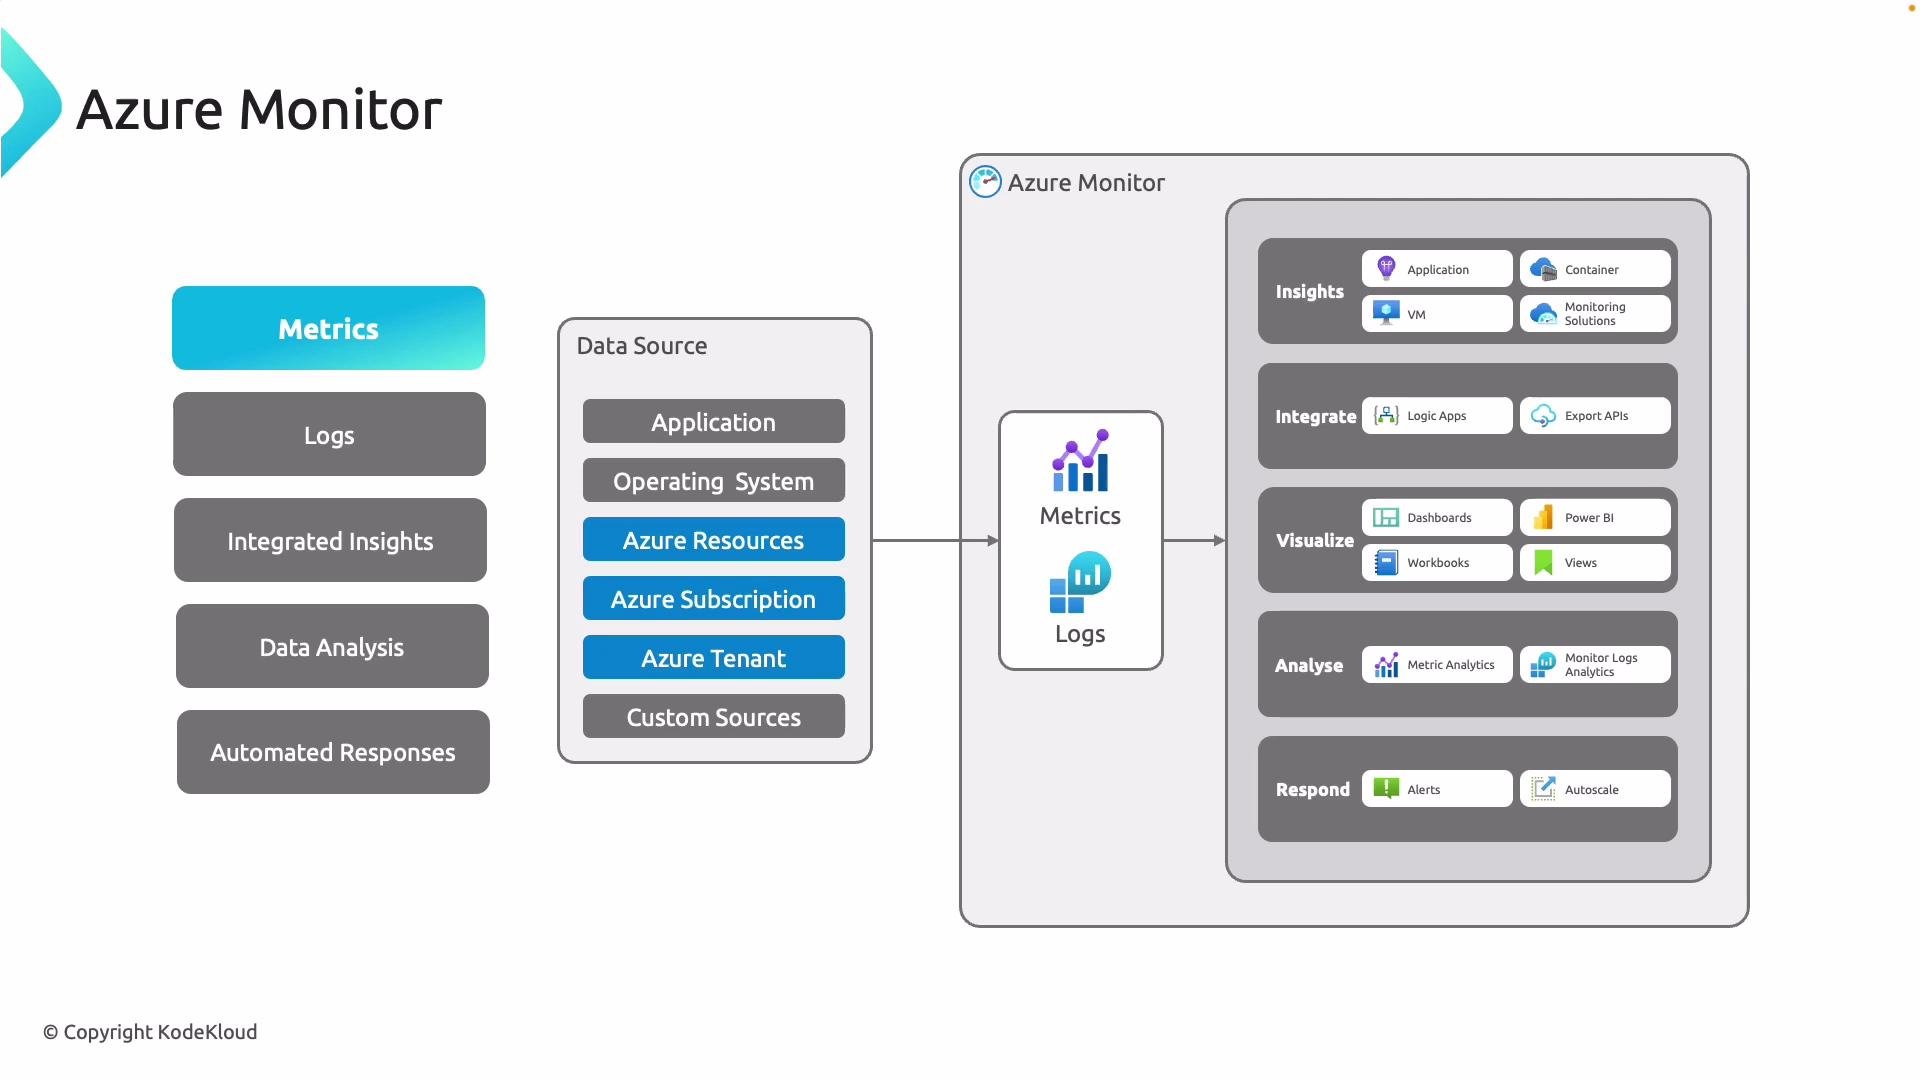
Azure Monitor centralizes telemetry collection, analysis, and automated responses so you can keep network infrastructure healthy, secure, and performant. Monitoring is essential for cloud operations—without it you lack visibility into application behavior, VM health, container performance, and network availability. Azure Monitor brings metrics, logs, integrated insights, visualization, and automation together to support observability and incident response.
## Core capabilities
* Metrics: lightweight numeric data points collected at short intervals (CPU, memory, network). Great for real-time dashboards and alerting.
* Logs: rich event and diagnostic records (traces, exceptions, audit events) stored in Log Analytics for advanced querying and long-term retention.
* Insights & integration: built-in experiences for applications, VMs, containers, networking, and hybrid systems. Use dashboards, workbooks, Log Analytics, and Metrics Explorer to visualize and correlate data. Alerts can trigger automated remediation—scale, restart, notify, or run playbooks.
Below is a high-level view of Azure Monitor’s workflow showing data sources, the data store and processing modules, and the actions and insights you can derive.
 ## Metrics vs Logs — quick comparison
| Aspect | Metrics | Logs |
| --------- | -----------------------------------: | ----------------------------------------------- |
| Data type | Numeric time-series | Detailed events and records |
| Frequency | Near real-time (short intervals) | Event-driven (varies) |
| Best for | Dashboards, thresholds, alerts | Troubleshooting, correlation, auditing |
| Storage | Short to medium retention by default | Long-term when sent to Log Analytics or storage |
| Example | `CPU %`, network in/out | Exception stack traces, audit events, flow logs |
## Metrics Explorer
Metrics Explorer is the primary UI for graphing real-time and historical metrics. Use it to detect patterns (latency spikes, packet drops), compare resources, and build KPIs (e.g., firewall dropped packets, SQL MI transaction latency).
## Metrics vs Logs — quick comparison
| Aspect | Metrics | Logs |
| --------- | -----------------------------------: | ----------------------------------------------- |
| Data type | Numeric time-series | Detailed events and records |
| Frequency | Near real-time (short intervals) | Event-driven (varies) |
| Best for | Dashboards, thresholds, alerts | Troubleshooting, correlation, auditing |
| Storage | Short to medium retention by default | Long-term when sent to Log Analytics or storage |
| Example | `CPU %`, network in/out | Exception stack traces, audit events, flow logs |
## Metrics Explorer
Metrics Explorer is the primary UI for graphing real-time and historical metrics. Use it to detect patterns (latency spikes, packet drops), compare resources, and build KPIs (e.g., firewall dropped packets, SQL MI transaction latency).
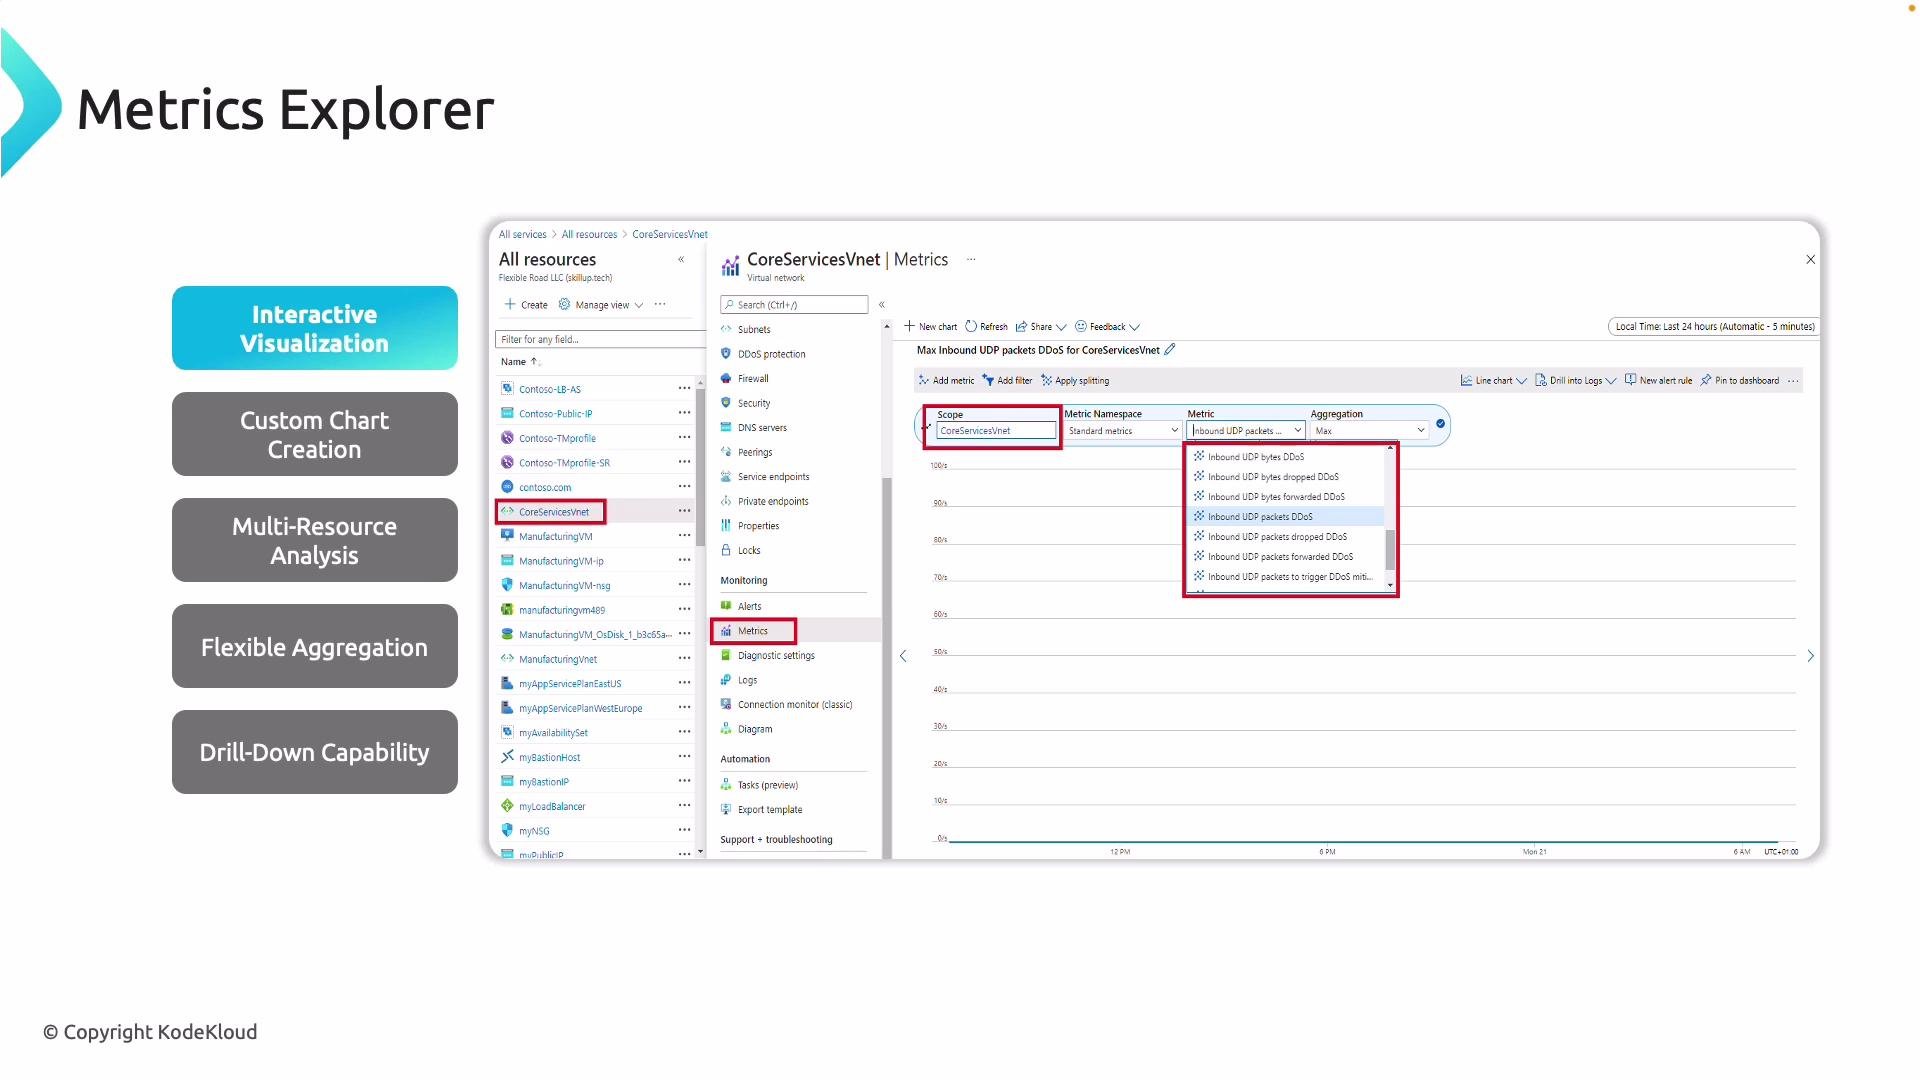 Key Metrics Explorer capabilities:
* Compare metrics across multiple resources (throughput across VNets, VM CPU across a pool).
* Use aggregations: Sum, Average, Min, Max, Count.
* Drill into specific time ranges for root-cause analysis (e.g., investigate a five-minute window during a DDoS event).
* Save charts to dashboards, create alert rules from charts, and change visualization types (line, area, stacked).
### Accessing Metrics Explorer in the Azure portal
Most Azure resources expose a Monitoring blade where you can launch Metrics (Metrics Explorer). You can open Metrics either directly from a resource (resource-scoped metrics) or from the Azure Monitor blade for cross-resource analysis.
Key Metrics Explorer capabilities:
* Compare metrics across multiple resources (throughput across VNets, VM CPU across a pool).
* Use aggregations: Sum, Average, Min, Max, Count.
* Drill into specific time ranges for root-cause analysis (e.g., investigate a five-minute window during a DDoS event).
* Save charts to dashboards, create alert rules from charts, and change visualization types (line, area, stacked).
### Accessing Metrics Explorer in the Azure portal
Most Azure resources expose a Monitoring blade where you can launch Metrics (Metrics Explorer). You can open Metrics either directly from a resource (resource-scoped metrics) or from the Azure Monitor blade for cross-resource analysis.
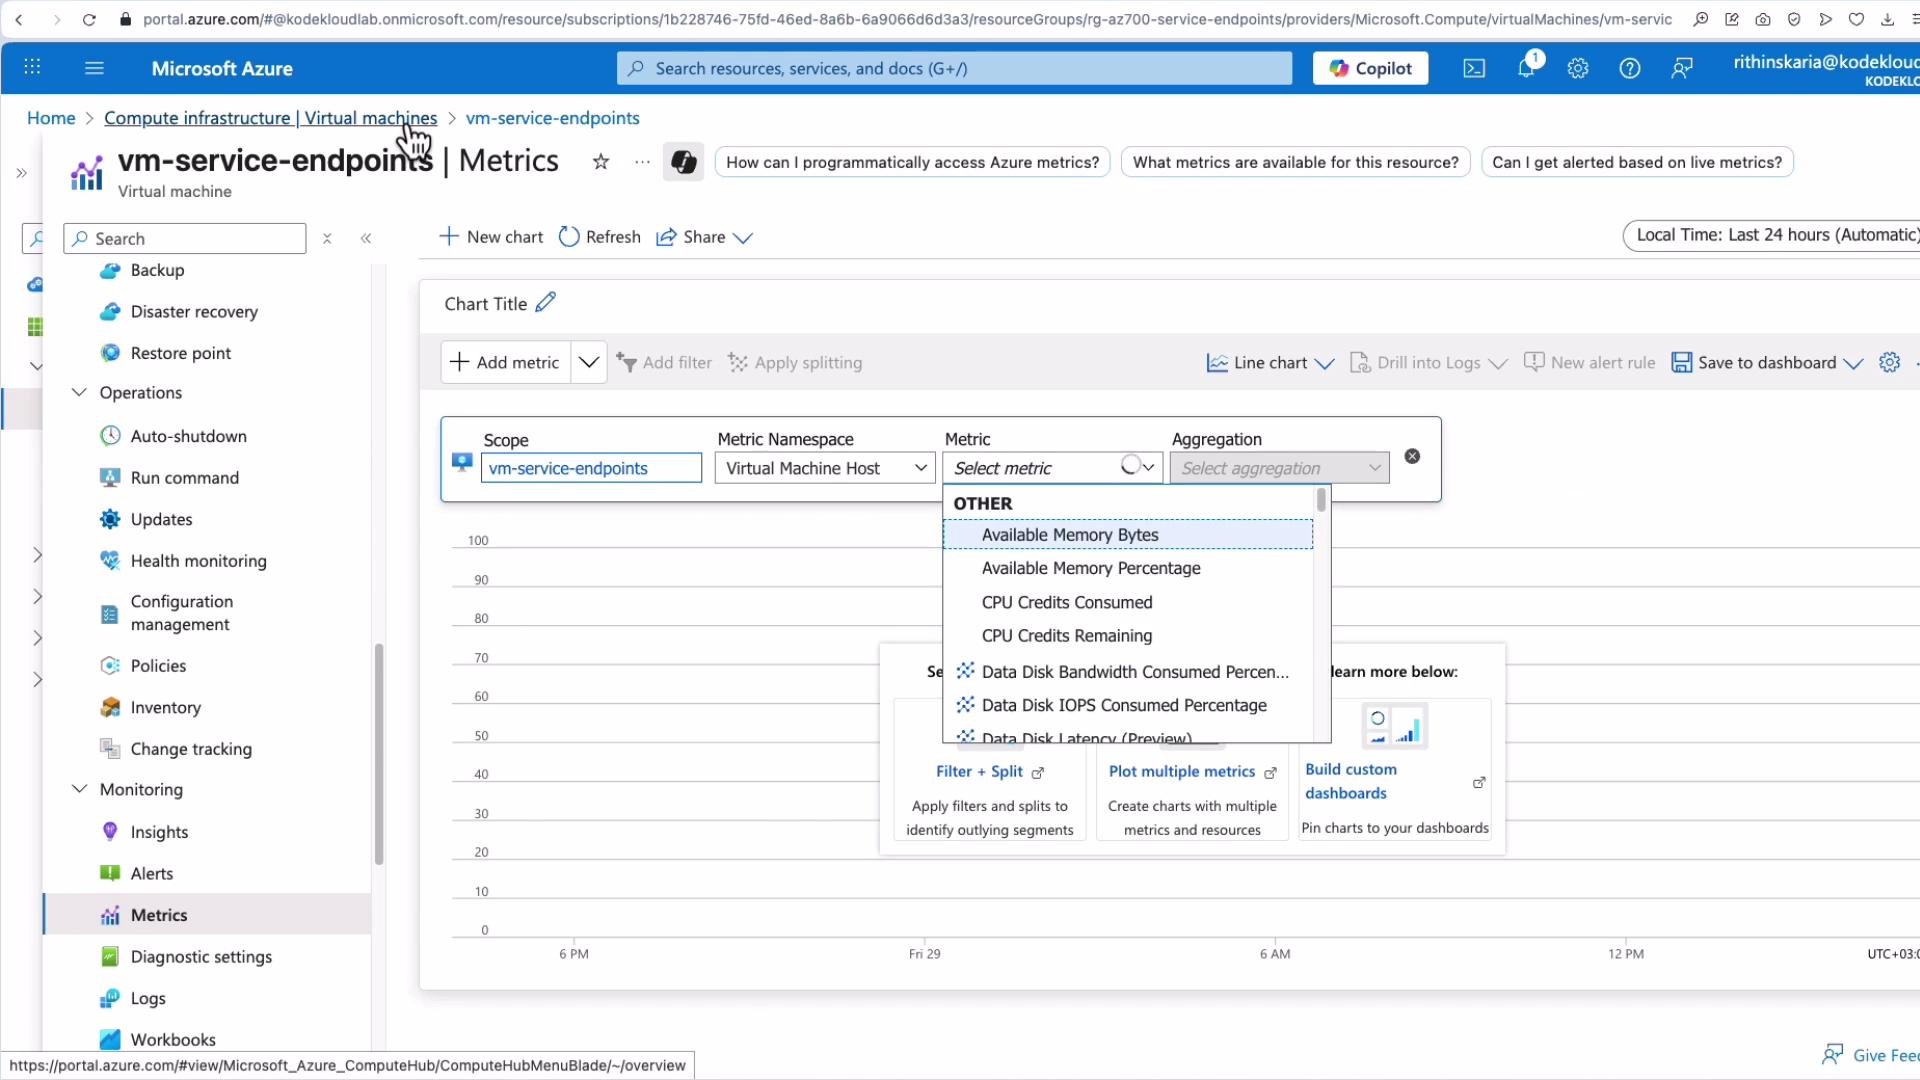 Example workflow:
1. Open a resource (for example, a virtual machine) in the Azure portal.
2. From the Monitoring blade, choose **Metrics** to open Metrics Explorer for that resource.
3. Search for a metric such as `Percentage CPU` and select an aggregation (Average, Max, etc.).
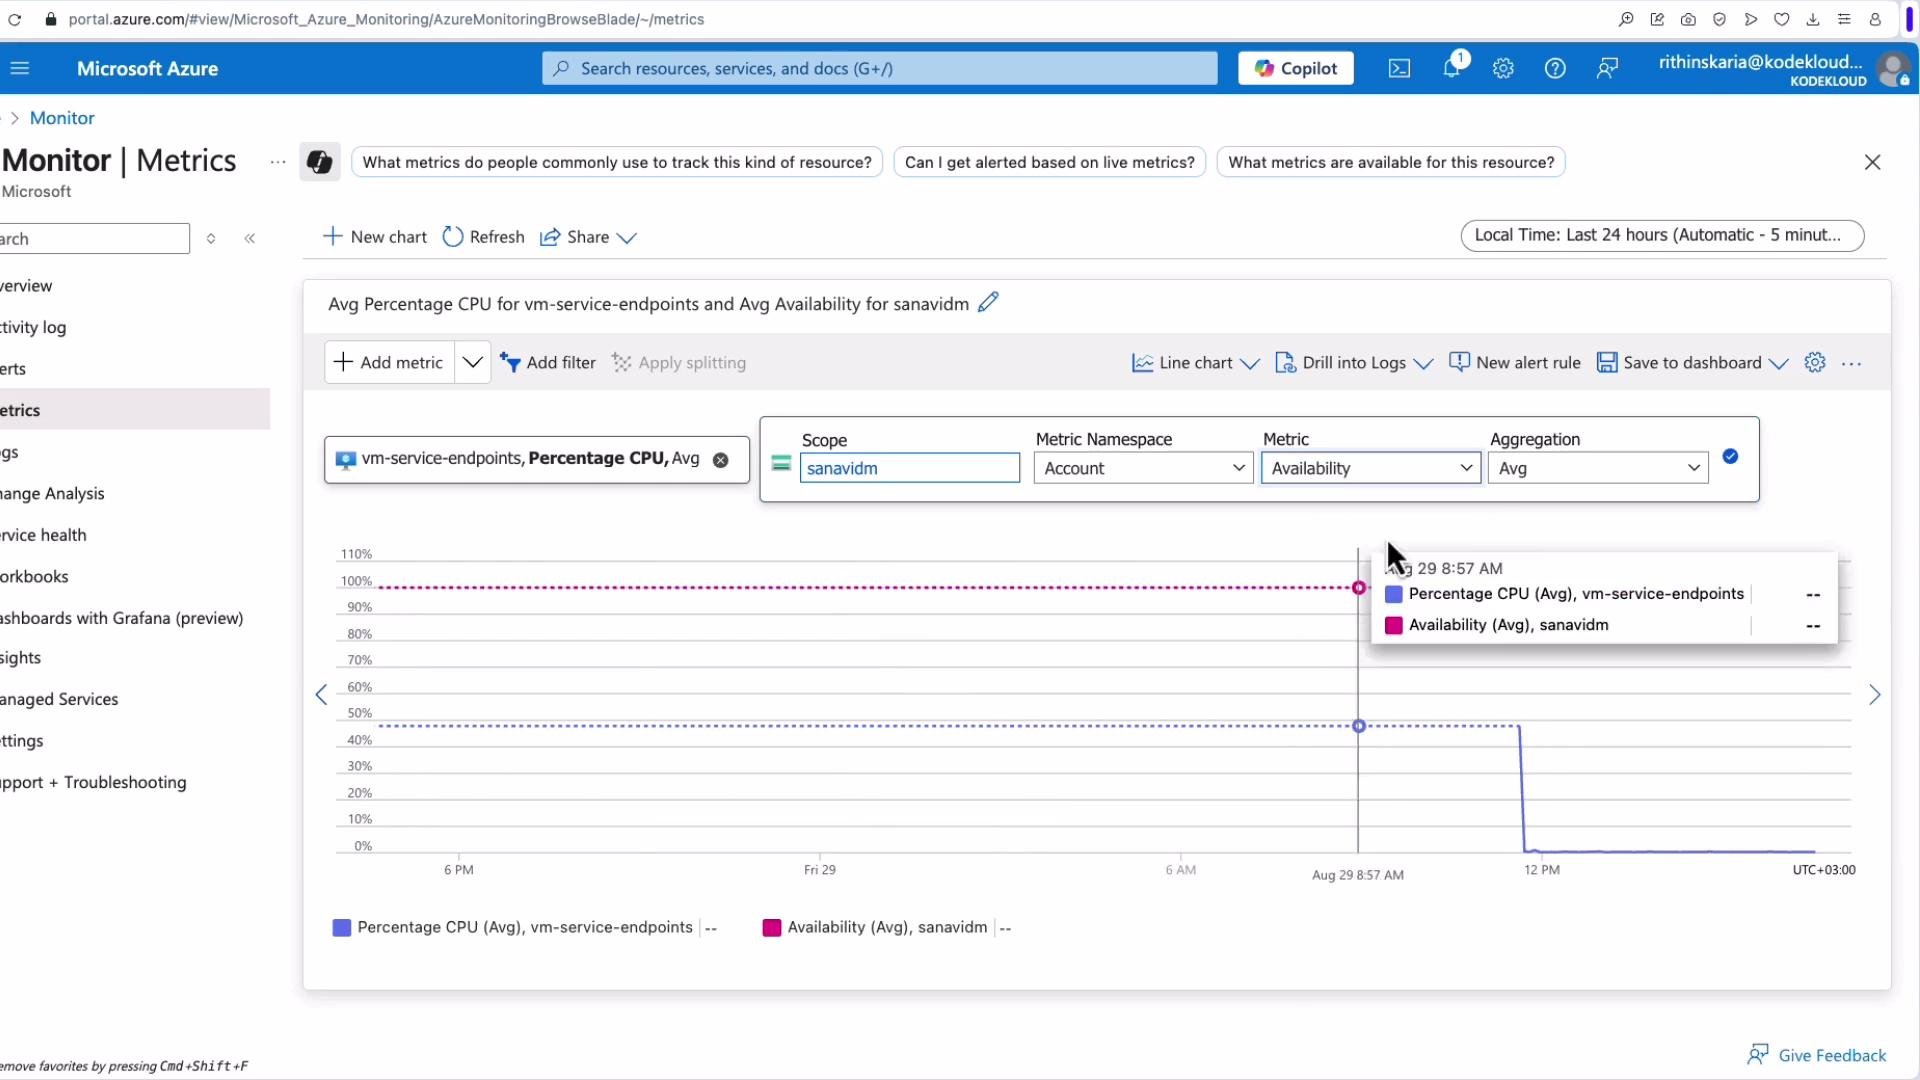
4. Add another metric like `Available Memory %` to plot multiple series on the same chart.
5. For cross-resource analysis, go to Azure Monitor > Metrics and select resources across subscriptions or resource groups—plot VM CPU alongside VNet or storage metrics.
Example workflow:
1. Open a resource (for example, a virtual machine) in the Azure portal.
2. From the Monitoring blade, choose **Metrics** to open Metrics Explorer for that resource.
3. Search for a metric such as `Percentage CPU` and select an aggregation (Average, Max, etc.).
4. Add another metric like `Available Memory %` to plot multiple series on the same chart.
5. For cross-resource analysis, go to Azure Monitor > Metrics and select resources across subscriptions or resource groups—plot VM CPU alongside VNet or storage metrics.
 ## Diagnostics, Logs, and destinations
Platform metrics are useful out of the box but are retained for a limited period. To capture diagnostic logs or retain data beyond default retention, configure Diagnostic settings per resource. Diagnostics let you select log and metric categories (which vary by resource) and route them to destinations for analysis or archival.
## Diagnostics, Logs, and destinations
Platform metrics are useful out of the box but are retained for a limited period. To capture diagnostic logs or retain data beyond default retention, configure Diagnostic settings per resource. Diagnostics let you select log and metric categories (which vary by resource) and route them to destinations for analysis or archival.
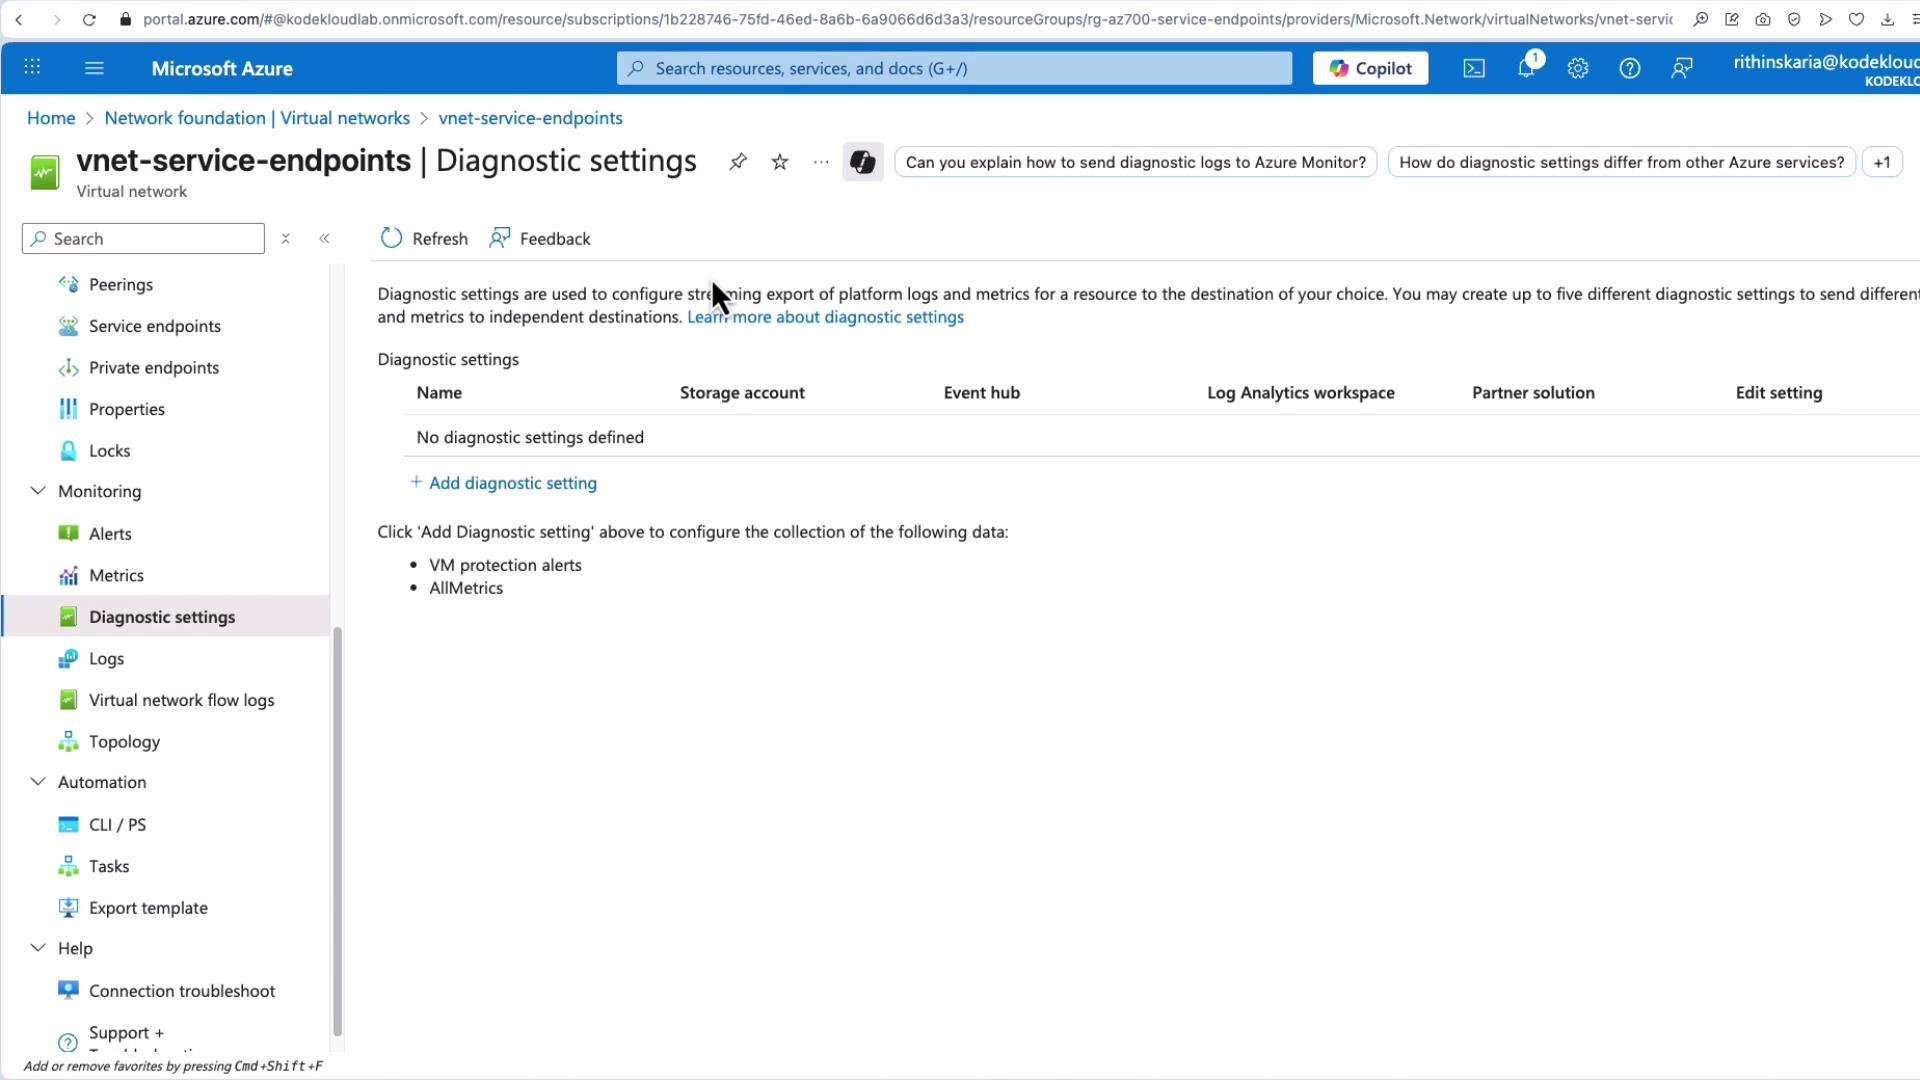 Common diagnostic destinations
| Destination | Use case | Notes / examples |
| ----------------------- | -------------------------------------------------------- | ----------------------------------------------------------------- |
| Log Analytics workspace | Rich queries, correlation, incident investigation | Use Kusto Query Language (KQL) to correlate logs across resources |
| Storage account | Long-term archival and compliance | Export raw logs for retention beyond workspace limits |
| Event Hubs | Stream telemetry to SIEMs or external processors | Integrate with third-party analytics or real-time pipelines |
| Partner solutions | Forward logs to supported partner (security, monitoring) | Depends on resource and partner support |
Common diagnostic destinations
| Destination | Use case | Notes / examples |
| ----------------------- | -------------------------------------------------------- | ----------------------------------------------------------------- |
| Log Analytics workspace | Rich queries, correlation, incident investigation | Use Kusto Query Language (KQL) to correlate logs across resources |
| Storage account | Long-term archival and compliance | Export raw logs for retention beyond workspace limits |
| Event Hubs | Stream telemetry to SIEMs or external processors | Integrate with third-party analytics or real-time pipelines |
| Partner solutions | Forward logs to supported partner (security, monitoring) | Depends on resource and partner support |
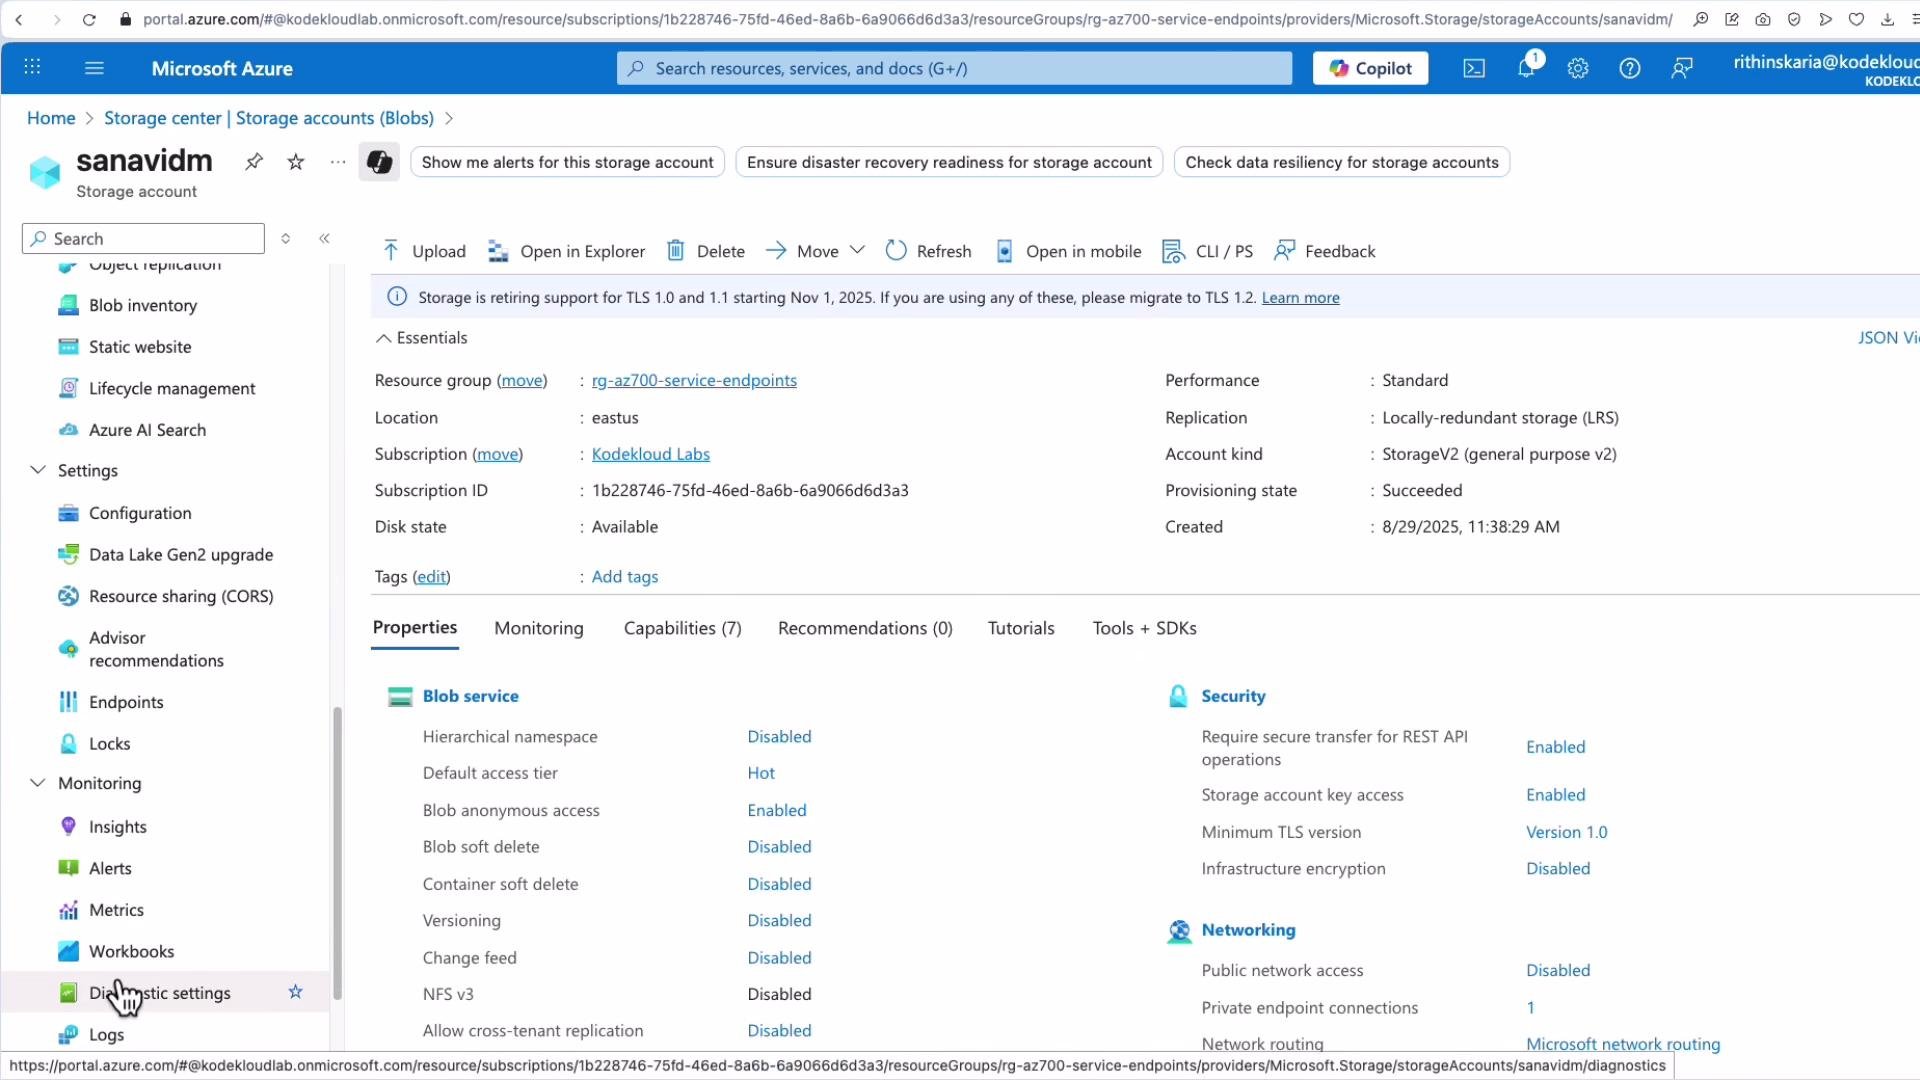 When configuring diagnostics for a resource such as a storage account, you can select categories (`StorageRead`, `StorageWrite`, `StorageDelete`), transaction metrics, and audit logs, then send them to a destination of your choice.
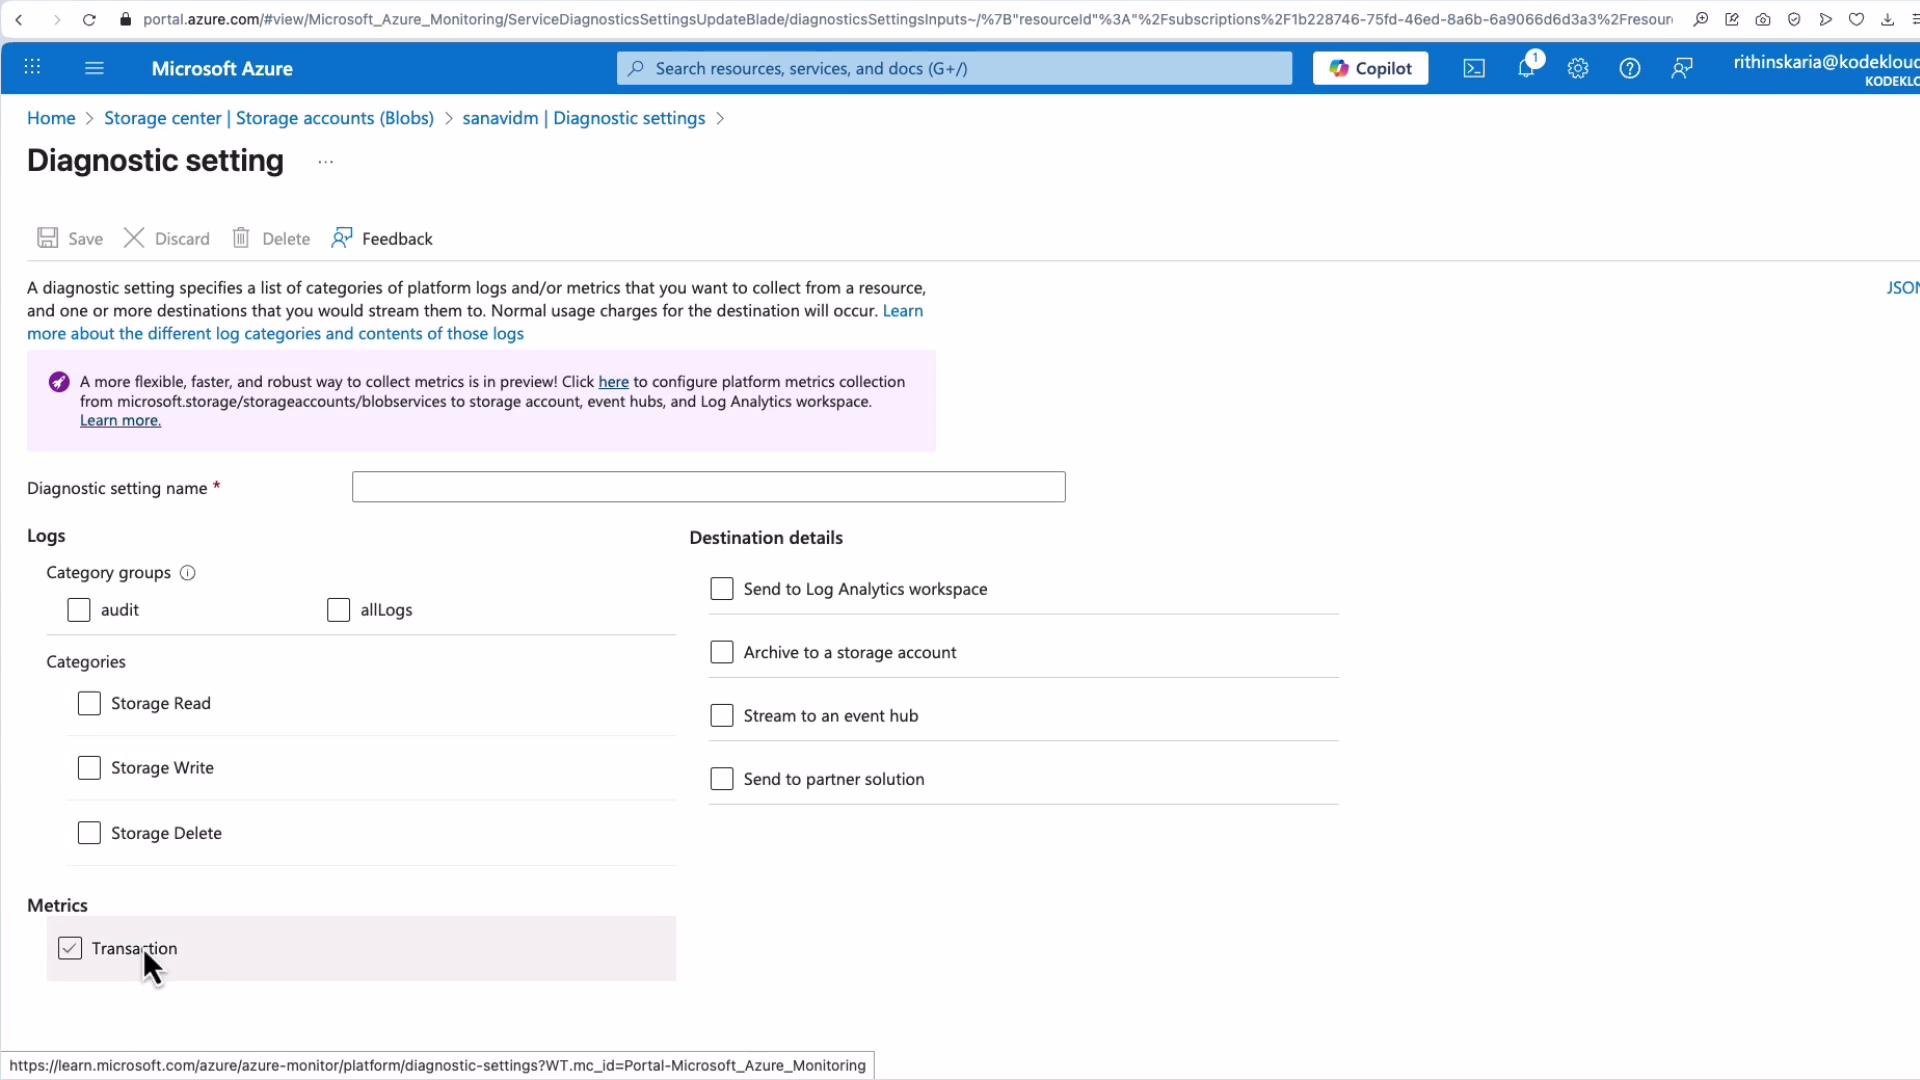 Metrics in Metrics Explorer are available out-of-the-box (typically with a 90-day view). For longer retention or advanced queries, send diagnostics to a Log Analytics workspace, a storage account for archival, or Event Hubs for streaming to external systems.
## Next steps and recommended learning path
* Configure Diagnostic settings for resource types that matter to your service-level objectives (NSG flow logs, VM guest diagnostics, storage analytics).
* Build dashboards and workbooks to visualize KPIs and correlate metrics with logs.
* Create alert rules from metrics and logs to automate responses (auto-scale VMs, trigger runbooks, notify teams).
* Learn Log Analytics and Kusto Query Language (KQL) for powerful cross-resource analysis and threat hunting.
Useful references:
* Azure Monitor overview: [https://learn.microsoft.com/azure/azure-monitor/](https://learn.microsoft.com/azure/azure-monitor/)
* Log Analytics and KQL: [https://learn.microsoft.com/azure/data-explorer/kusto/query/](https://learn.microsoft.com/azure/data-explorer/kusto/query/)
* Metrics and Metrics Explorer: [https://learn.microsoft.com/azure/azure-monitor/essentials/metrics-overview](https://learn.microsoft.com/azure/azure-monitor/essentials/metrics-overview)
You should now have a clearer understanding of Azure Monitor’s components—metrics, logs, insights, visualization, and automated response—and how to use Metrics Explorer and Diagnostic settings to collect and analyze telemetry. Explore Alerts, Log Analytics queries, and workbooks to complete your monitoring strategy.
Metrics in Metrics Explorer are available out-of-the-box (typically with a 90-day view). For longer retention or advanced queries, send diagnostics to a Log Analytics workspace, a storage account for archival, or Event Hubs for streaming to external systems.
## Next steps and recommended learning path
* Configure Diagnostic settings for resource types that matter to your service-level objectives (NSG flow logs, VM guest diagnostics, storage analytics).
* Build dashboards and workbooks to visualize KPIs and correlate metrics with logs.
* Create alert rules from metrics and logs to automate responses (auto-scale VMs, trigger runbooks, notify teams).
* Learn Log Analytics and Kusto Query Language (KQL) for powerful cross-resource analysis and threat hunting.
Useful references:
* Azure Monitor overview: [https://learn.microsoft.com/azure/azure-monitor/](https://learn.microsoft.com/azure/azure-monitor/)
* Log Analytics and KQL: [https://learn.microsoft.com/azure/data-explorer/kusto/query/](https://learn.microsoft.com/azure/data-explorer/kusto/query/)
* Metrics and Metrics Explorer: [https://learn.microsoft.com/azure/azure-monitor/essentials/metrics-overview](https://learn.microsoft.com/azure/azure-monitor/essentials/metrics-overview)
You should now have a clearer understanding of Azure Monitor’s components—metrics, logs, insights, visualization, and automated response—and how to use Metrics Explorer and Diagnostic settings to collect and analyze telemetry. Explore Alerts, Log Analytics queries, and workbooks to complete your monitoring strategy.