> ## Documentation Index
> Fetch the complete documentation index at: https://notes.kodekloud.com/llms.txt
> Use this file to discover all available pages before exploring further.
# Using Network Watcher
> Guide to using Azure Network Watcher tools for monitoring, diagnosing, and troubleshooting network connectivity, NSG evaluations, packet captures, flow logs, and traffic analytics.
In this lesson we’ll review the core tools available in Azure Network Watcher, explain how each helps monitor and diagnose network issues, and show where to find them in the Azure portal. The content preserves the original diagram sequence and focuses on concise, actionable guidance for troubleshooting and observability.
## What Network Watcher gives you at a glance
Azure Network Watcher provides region-scoped diagnostics and monitoring features to help you visualize topology, validate connectivity, inspect NSG rule evaluation, capture packets, and analyze traffic patterns. Use the tools together to accelerate root-cause analysis across Azure and hybrid environments.
## Topology
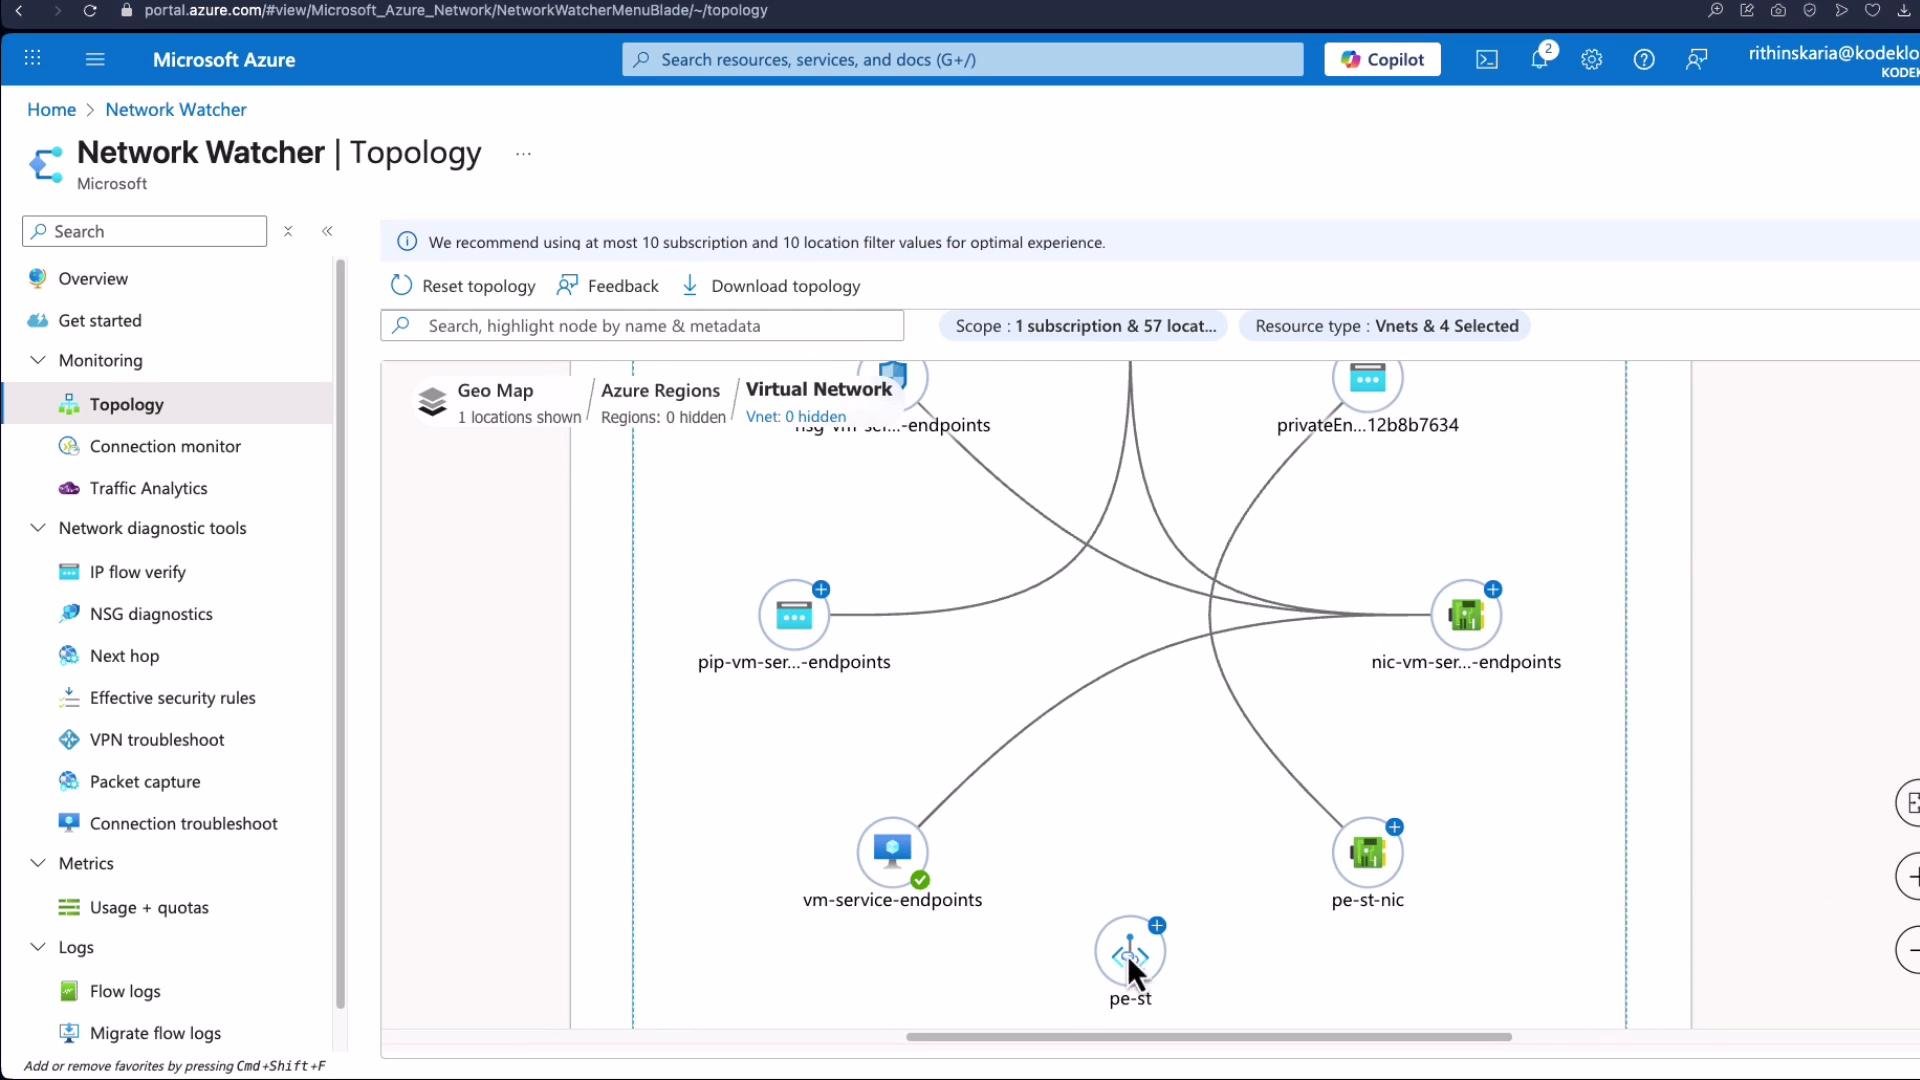
Topology produces a visual map of a VNet (interfaces, VMs, subnets, NSGs and their associations), showing resource dependencies and how things connect. This is especially helpful in complex environments when you need to confirm NIC-to-VM mappings, subnet placement, and NSG attachments.
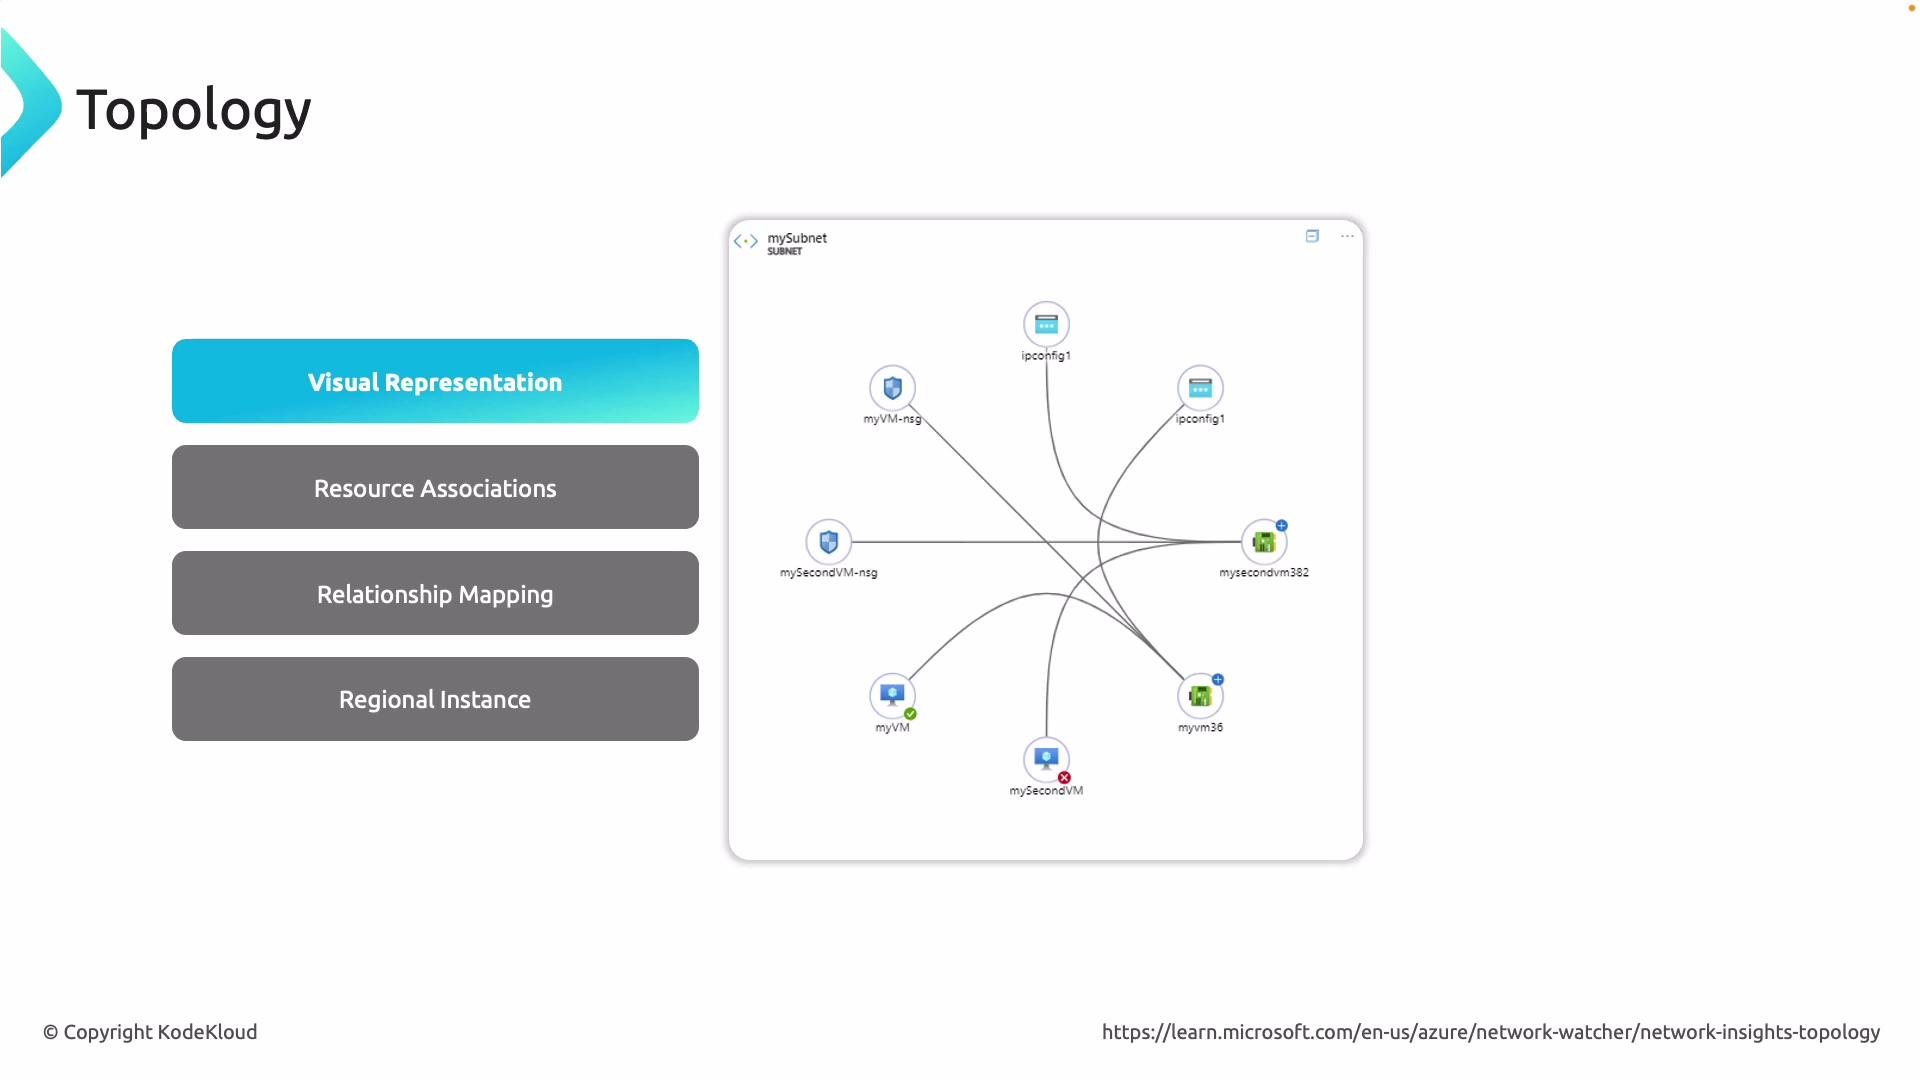 Topology is regional. Deploy or enable Network Watcher in the same Azure region as the VNet you want to visualize.
## Connection Monitor
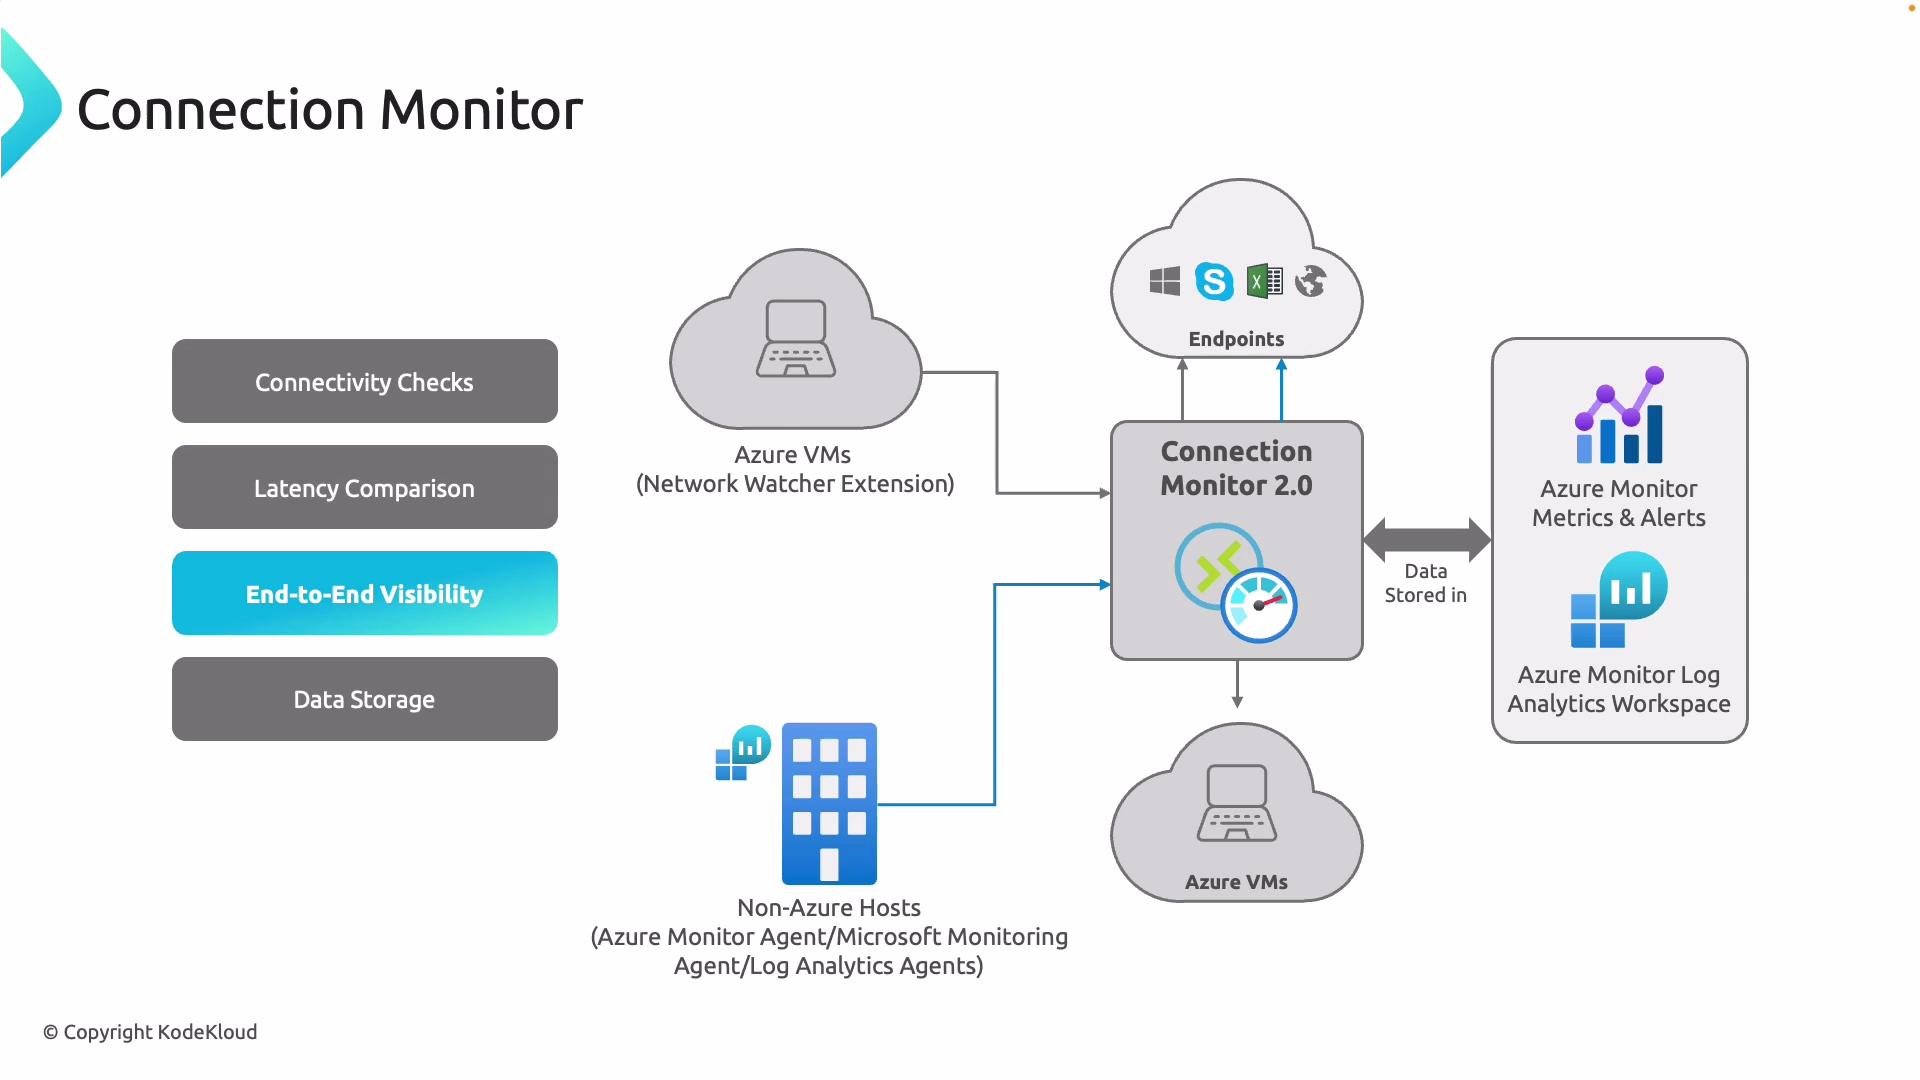
Connection Monitor performs active connectivity checks between endpoints (for example VM-to-VM or on-premises-to-Azure). It measures latency, success/failure, and other telemetry and persists results in Azure Monitor (Metrics, Alerts, and Log Analytics) so you can track trends and create alerts.
Topology is regional. Deploy or enable Network Watcher in the same Azure region as the VNet you want to visualize.
## Connection Monitor
Connection Monitor performs active connectivity checks between endpoints (for example VM-to-VM or on-premises-to-Azure). It measures latency, success/failure, and other telemetry and persists results in Azure Monitor (Metrics, Alerts, and Log Analytics) so you can track trends and create alerts.
 ## IP Flow Verify
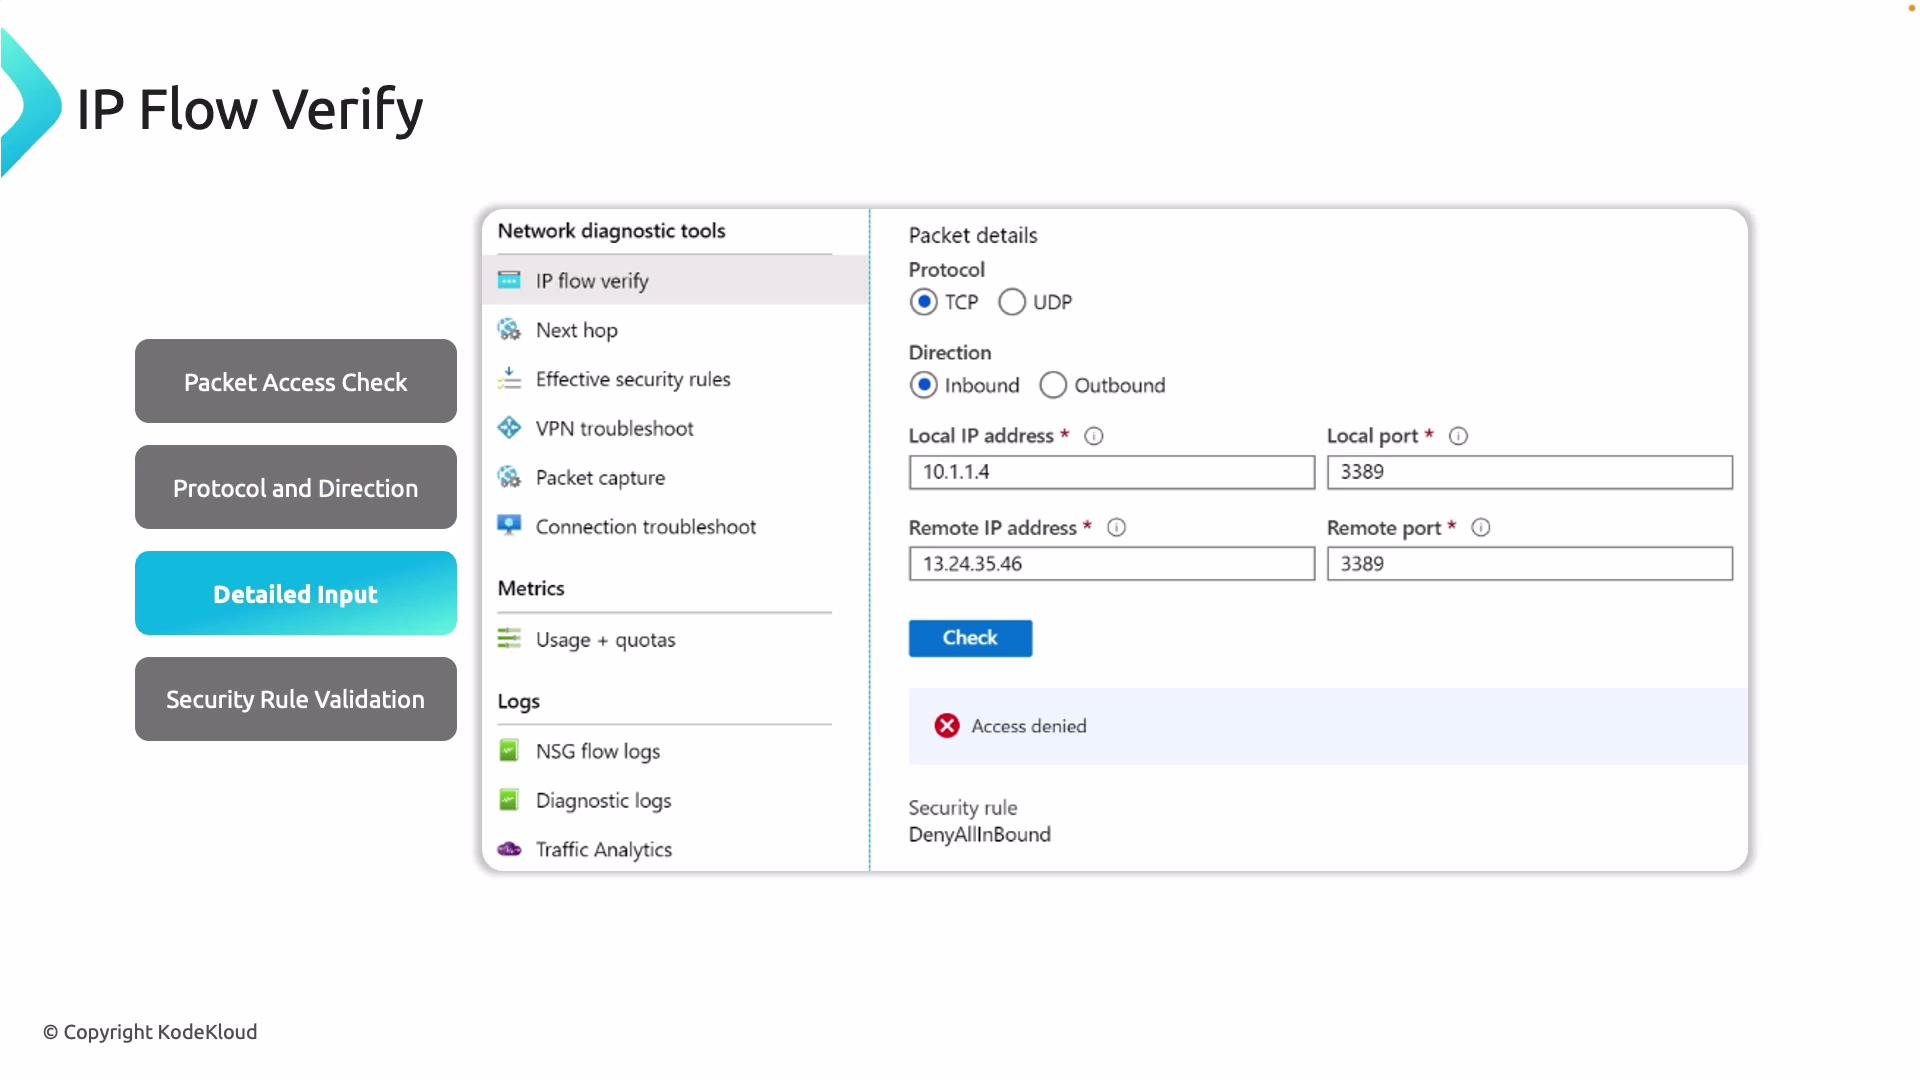
IP Flow Verify simulates a single packet (TCP/UDP, inbound/outbound) for a VM and reports whether NSG rules would allow or deny it. Provide source/destination IPs and ports to determine which NSG rule (and its priority) made the decision.
## IP Flow Verify
IP Flow Verify simulates a single packet (TCP/UDP, inbound/outbound) for a VM and reports whether NSG rules would allow or deny it. Provide source/destination IPs and ports to determine which NSG rule (and its priority) made the decision.
 ## NSG diagnostics
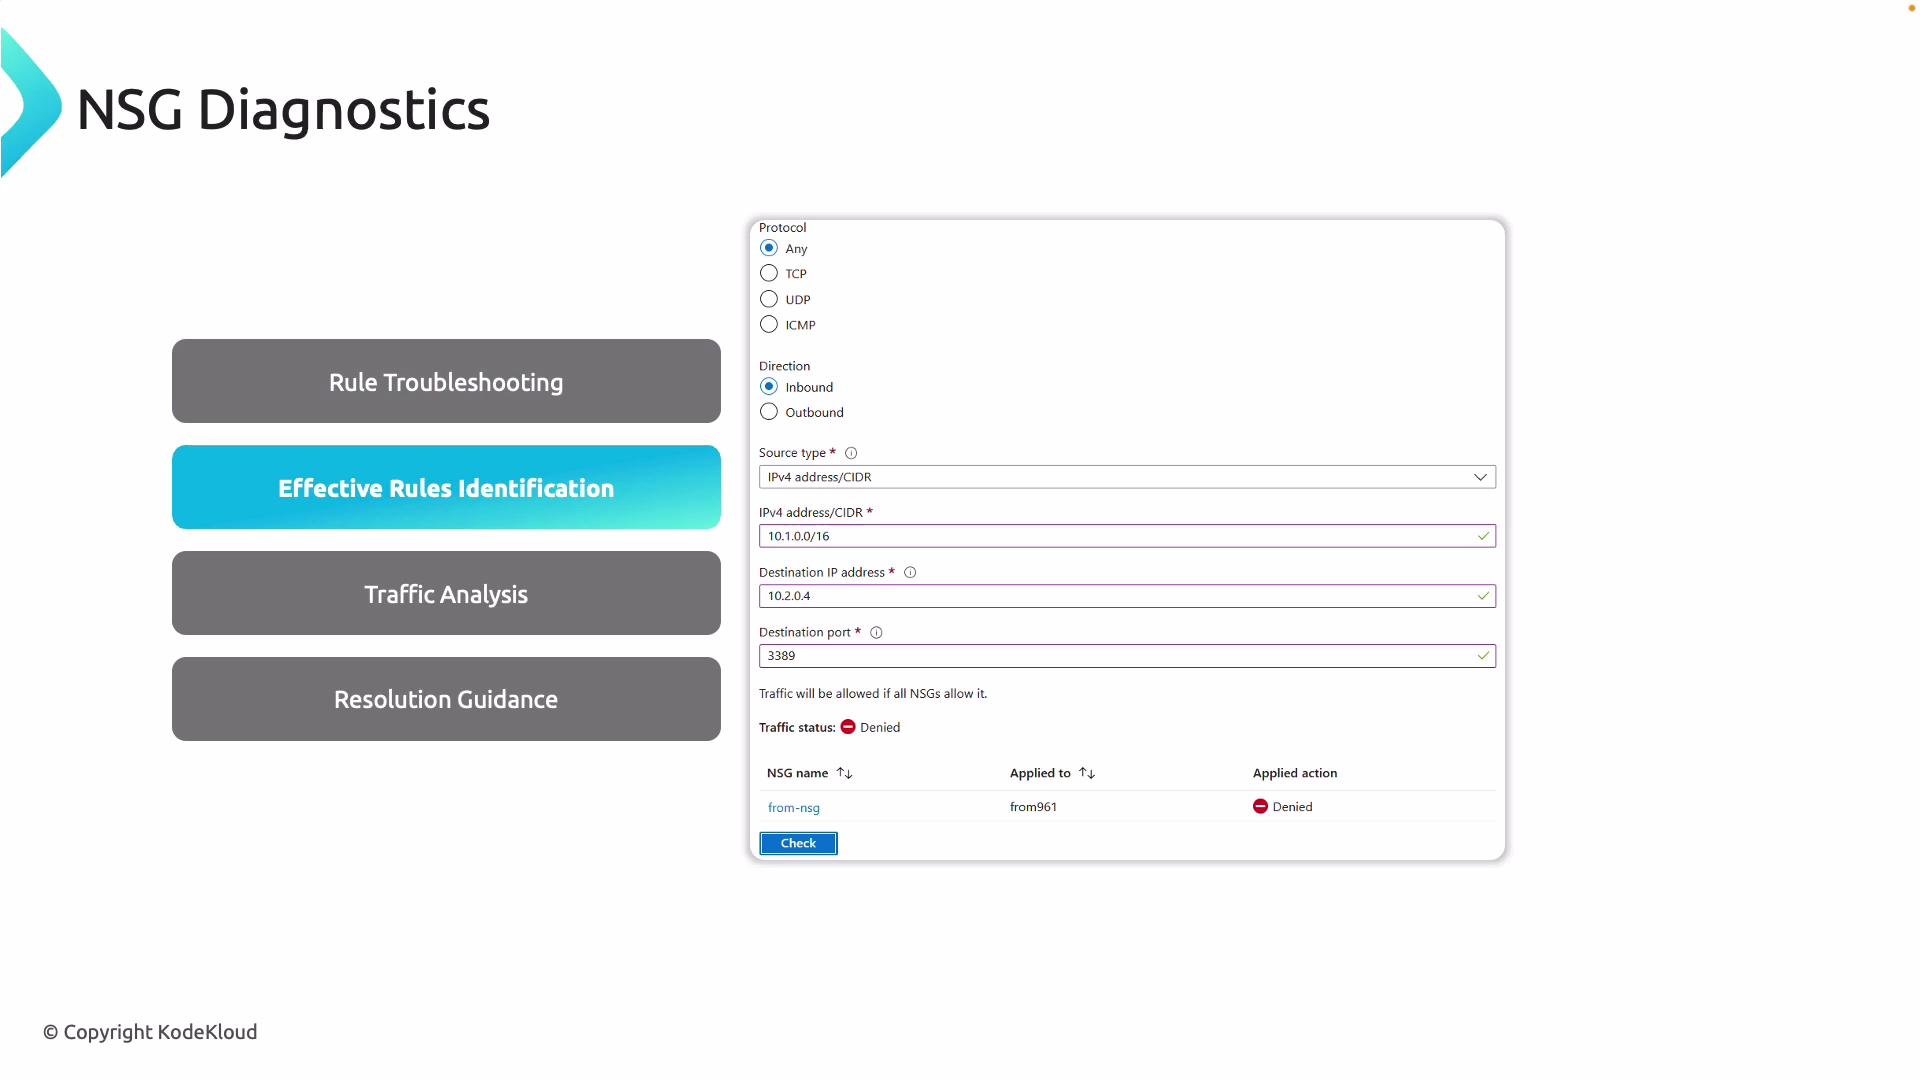
NSG diagnostics lists inherited and explicit rules applied to NICs and subnets and explains the evaluation order. It’s ideal for resolving rule conflicts, confirming priorities, and understanding why traffic was allowed or denied.
## NSG diagnostics
NSG diagnostics lists inherited and explicit rules applied to NICs and subnets and explains the evaluation order. It’s ideal for resolving rule conflicts, confirming priorities, and understanding why traffic was allowed or denied.
 ## VPN Troubleshoot
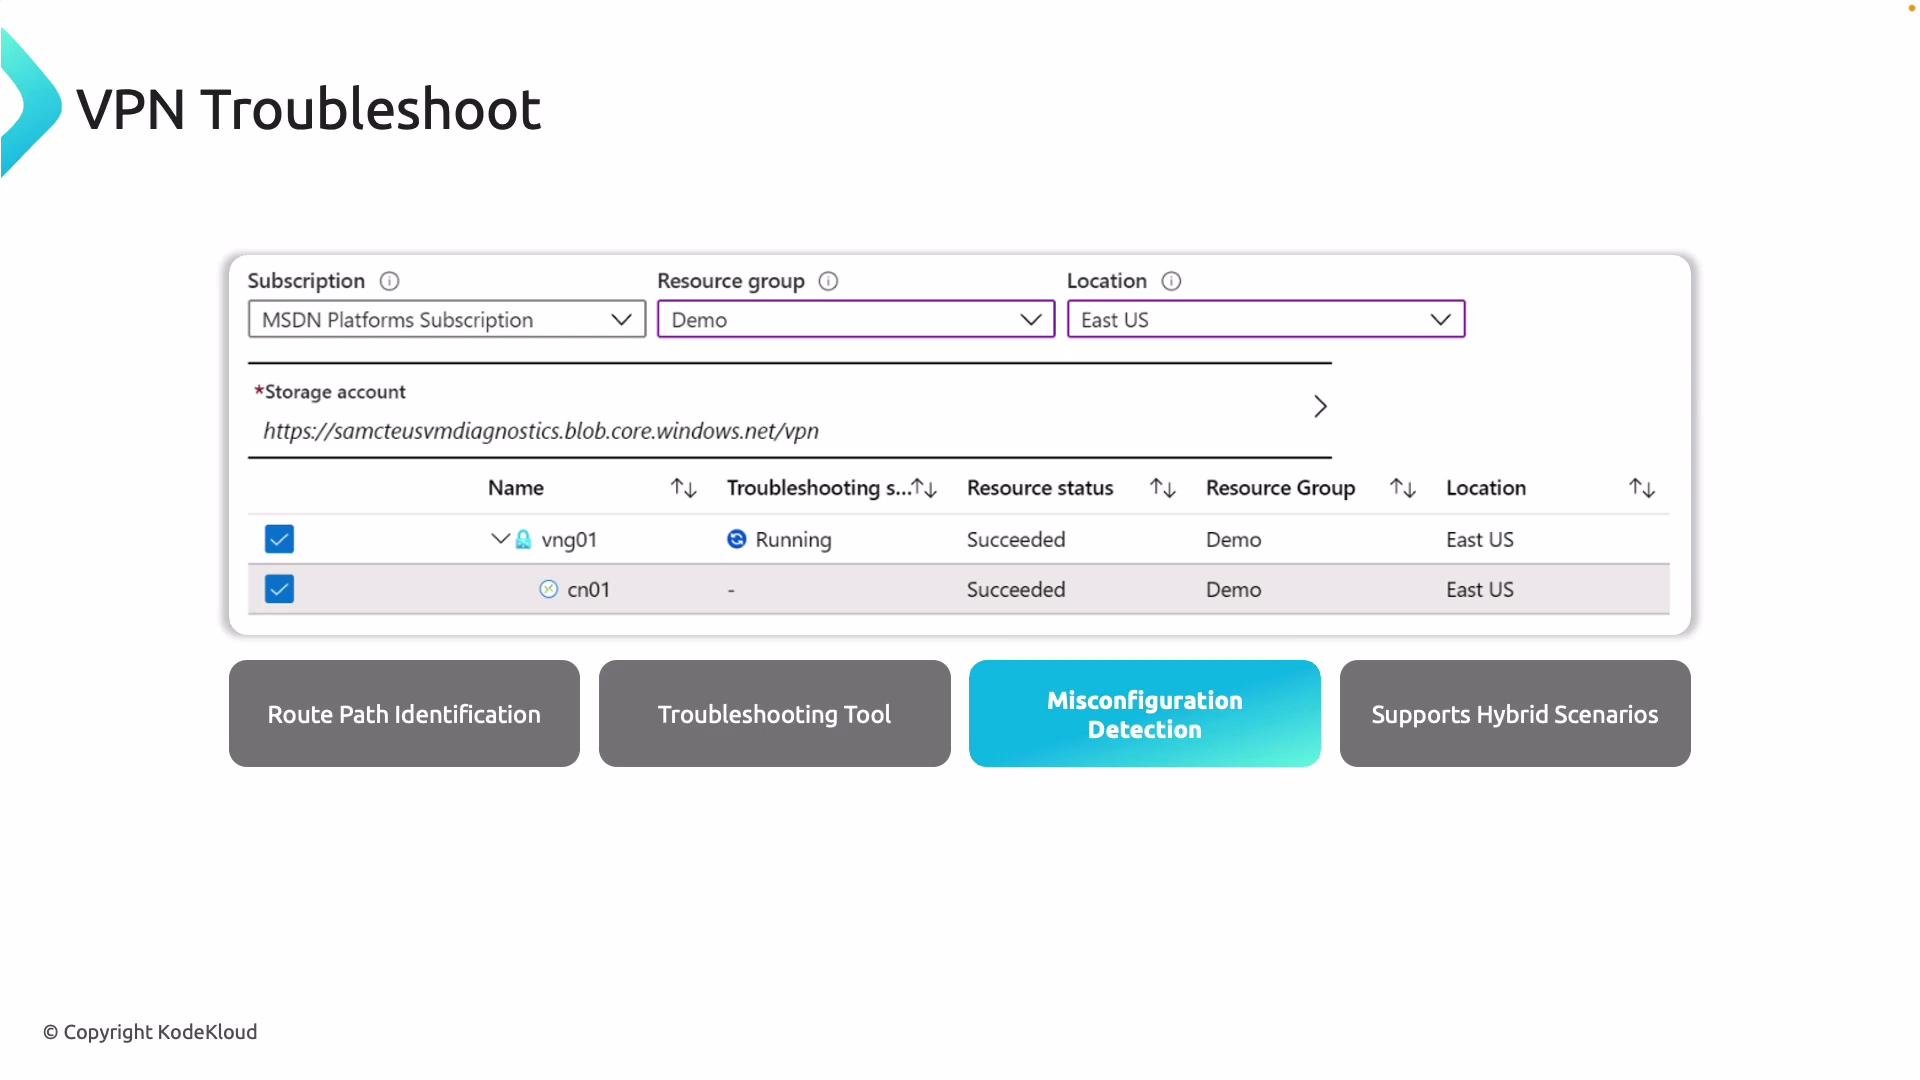
VPN Troubleshoot validates site-to-site and point-to-site VPN paths and confirms the next hop for VPN traffic. It detects incorrect or unexpected routes caused by User-Defined Routes (UDR) or system routes and works across hybrid links.
## VPN Troubleshoot
VPN Troubleshoot validates site-to-site and point-to-site VPN paths and confirms the next hop for VPN traffic. It detects incorrect or unexpected routes caused by User-Defined Routes (UDR) or system routes and works across hybrid links.
 ## Packet capture
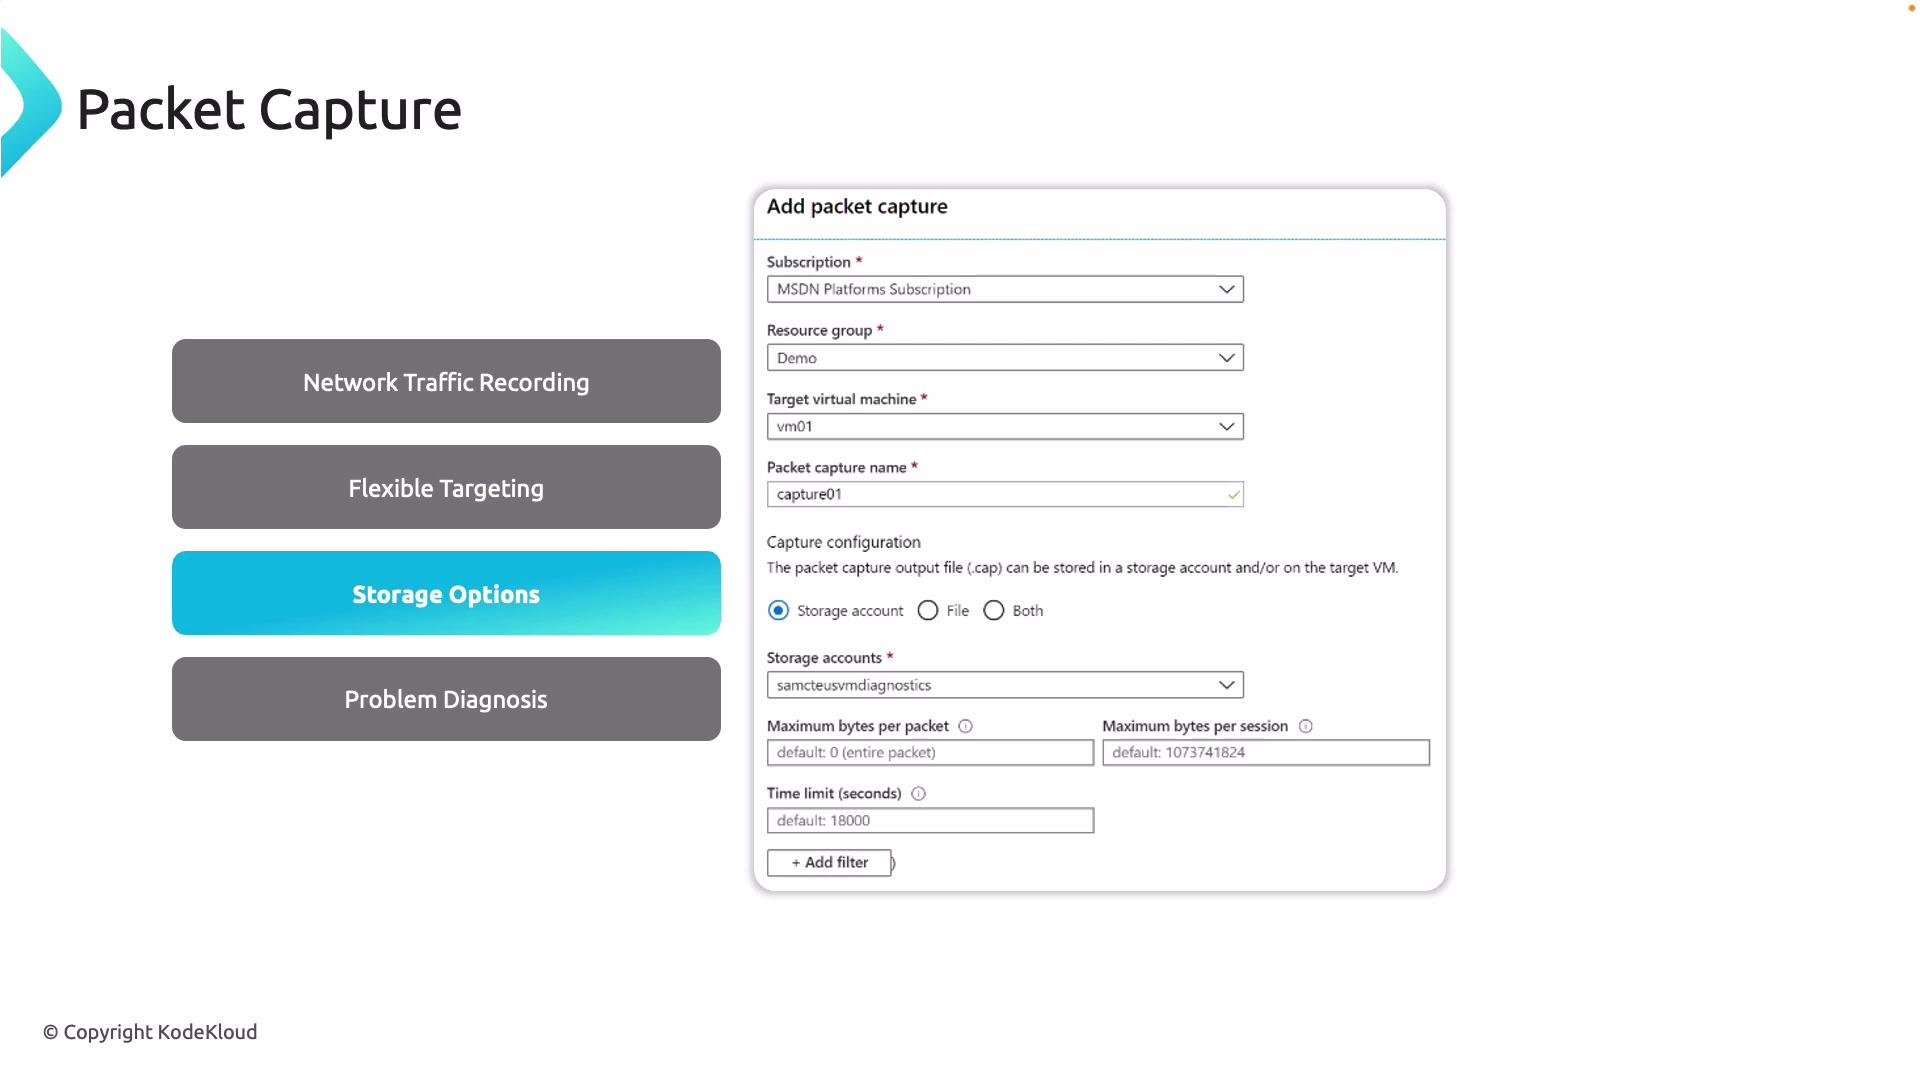
Packet capture collects raw packet data to or from a VM. You can filter by VM, protocol, IP, or port and store captures in an Azure Storage account or on the VM. Use this when investigating latency spikes, dropped connections, or suspicious traffic.
## Packet capture
Packet capture collects raw packet data to or from a VM. You can filter by VM, protocol, IP, or port and store captures in an Azure Storage account or on the VM. Use this when investigating latency spikes, dropped connections, or suspicious traffic.
 ## Connection Troubleshoot
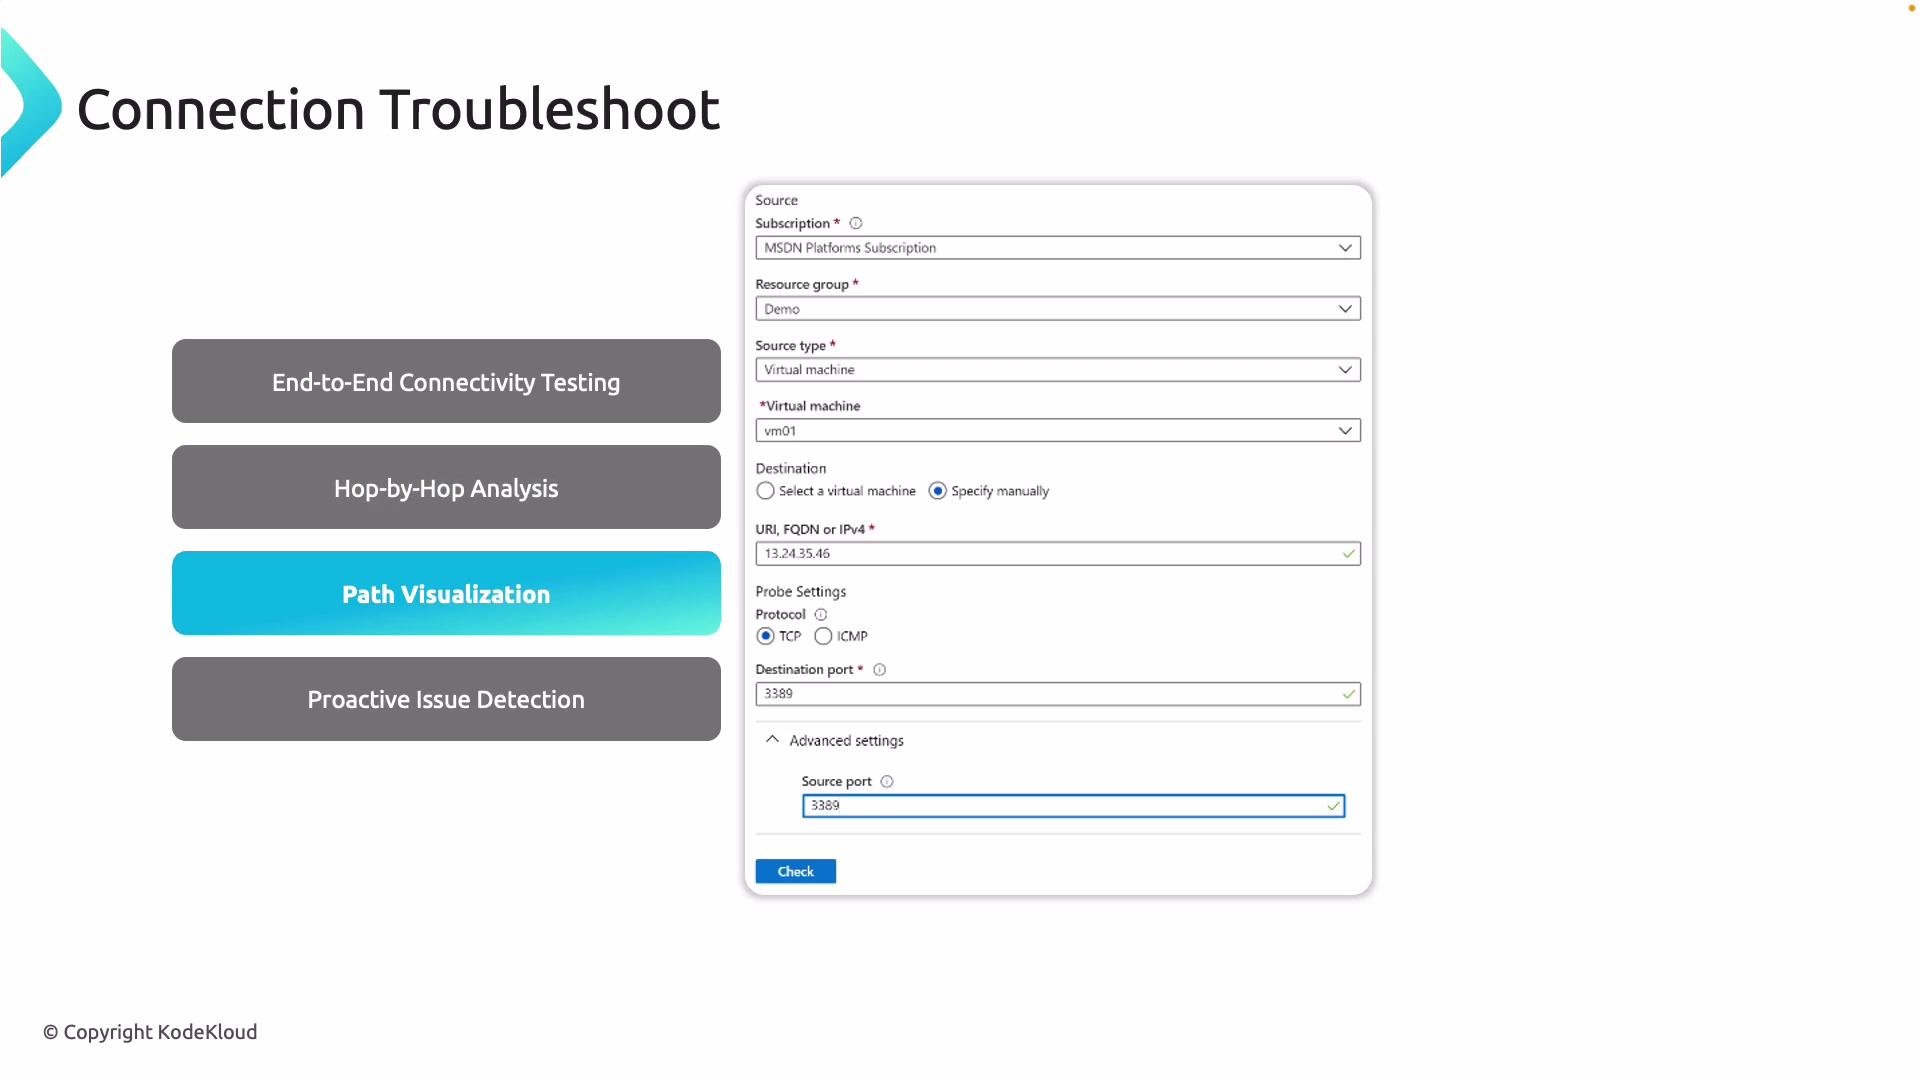
Connection Troubleshoot runs an end-to-end connectivity test between two endpoints, showing every hop and isolating failures caused by NSGs, UDRs, or firewalls. It visualizes the path and highlights where packets are blocked or delayed.
## Connection Troubleshoot
Connection Troubleshoot runs an end-to-end connectivity test between two endpoints, showing every hop and isolating failures caused by NSGs, UDRs, or firewalls. It visualizes the path and highlights where packets are blocked or delayed.
 ## Flow Logs
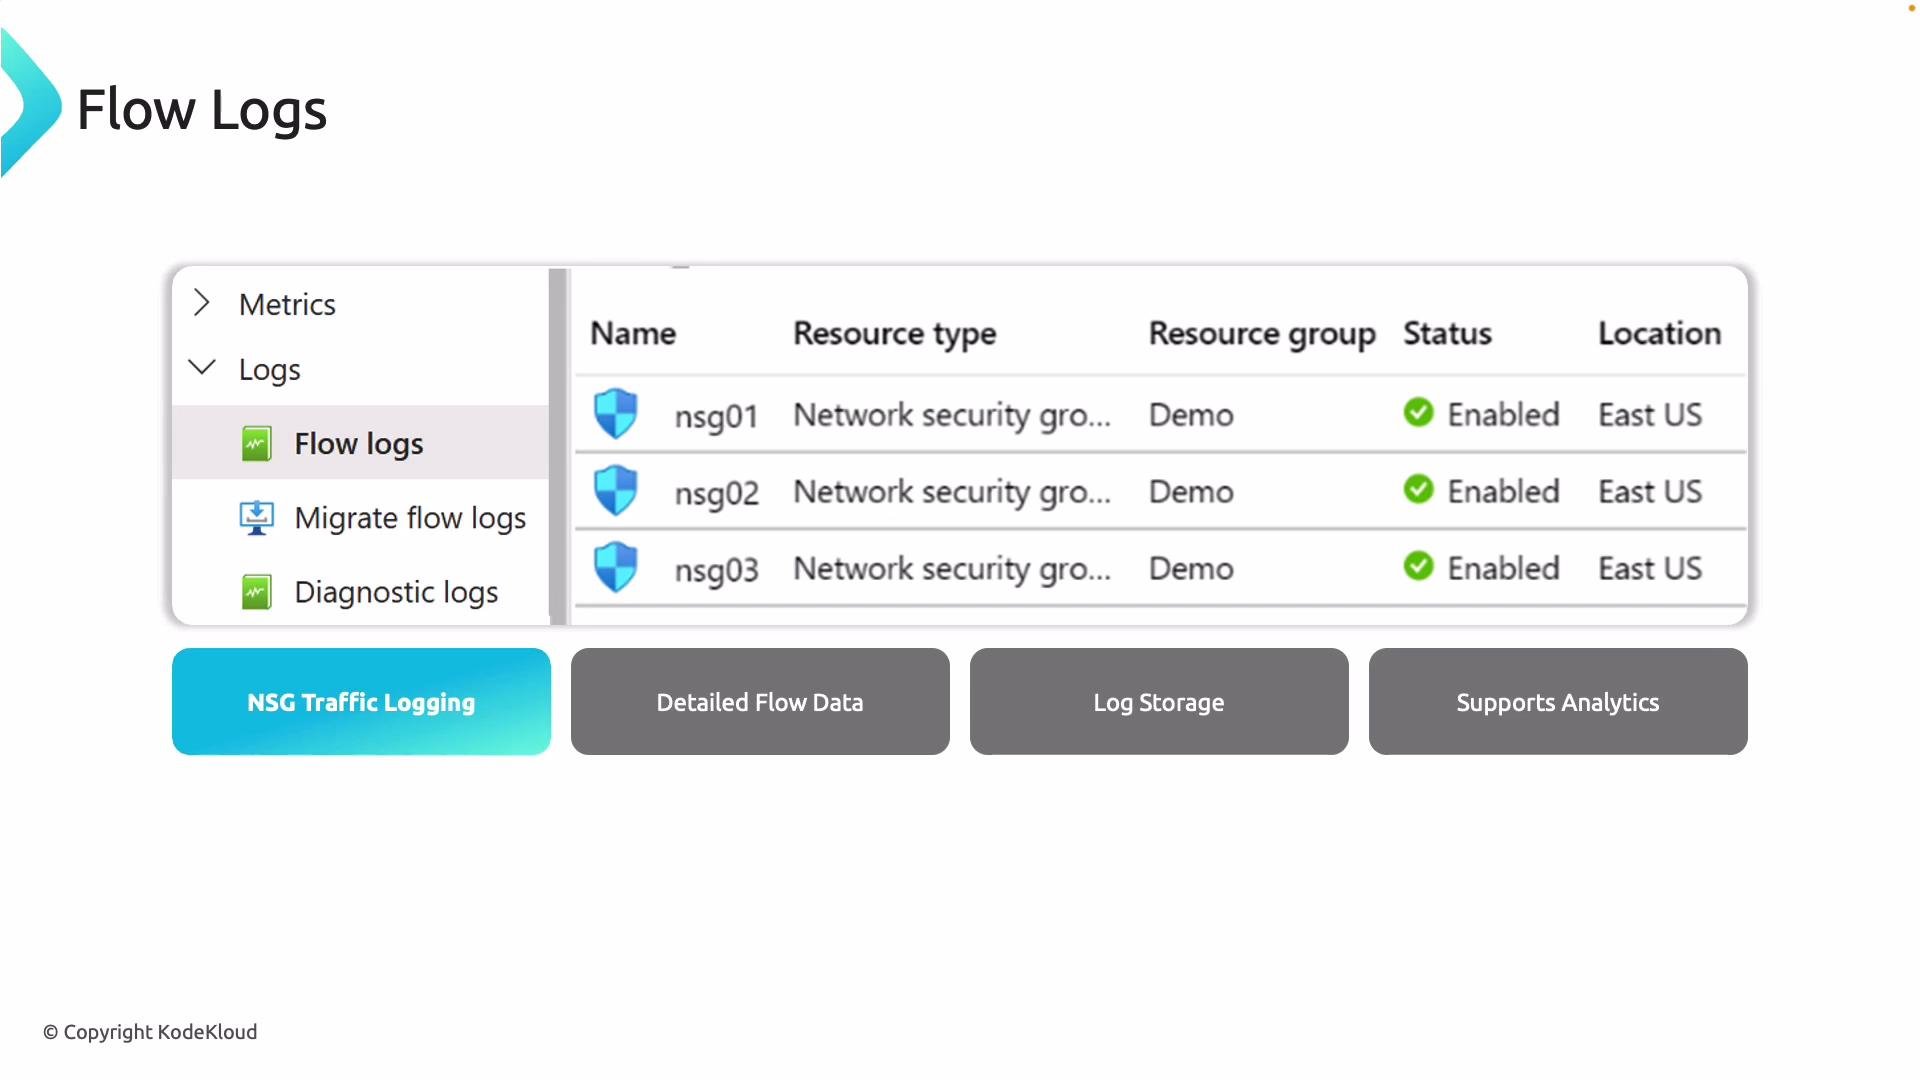
Flow Logs capture NSG traffic records (source/destination IPs, ports, and allow/deny actions). Logs are stored in Azure Storage and can be forwarded to Log Analytics or SIEM tools for deeper analysis, retention, and correlation with other telemetry.
## Flow Logs
Flow Logs capture NSG traffic records (source/destination IPs, ports, and allow/deny actions). Logs are stored in Azure Storage and can be forwarded to Log Analytics or SIEM tools for deeper analysis, retention, and correlation with other telemetry.
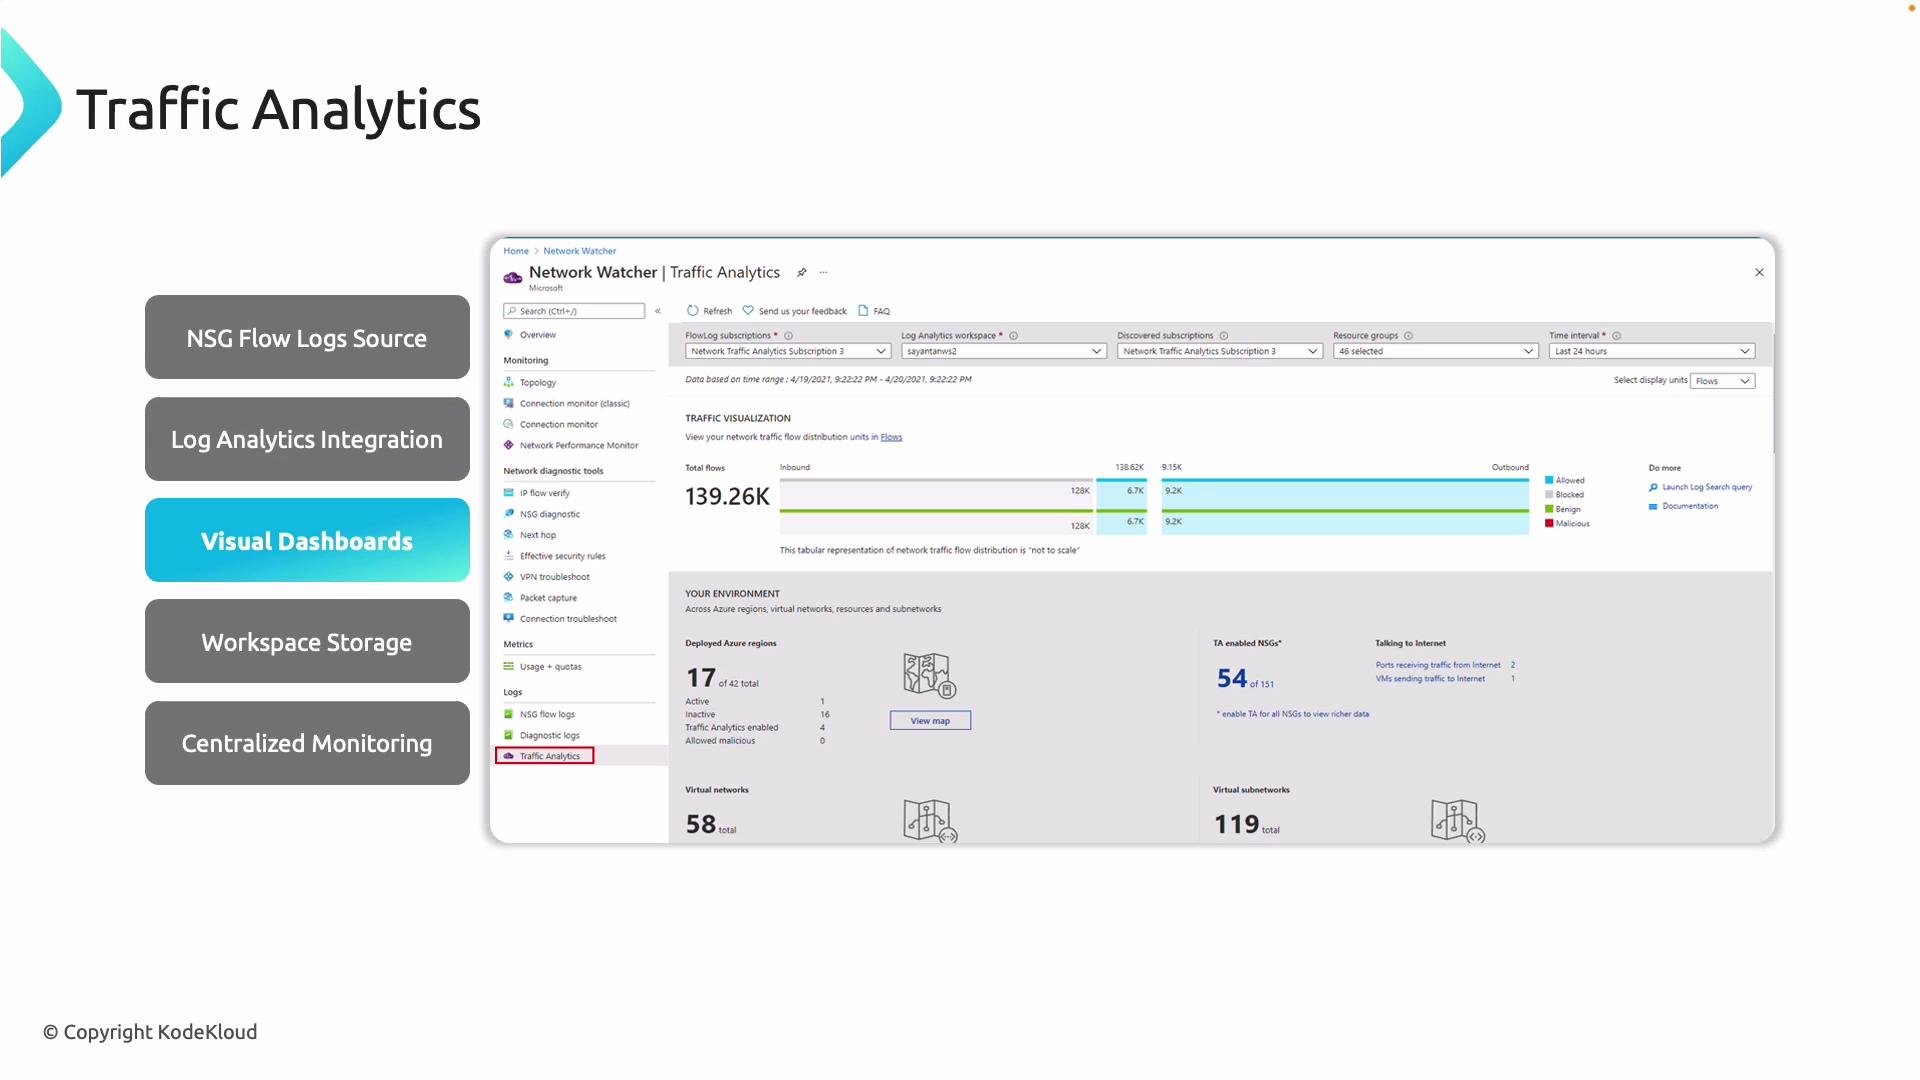
 ## Traffic Analytics
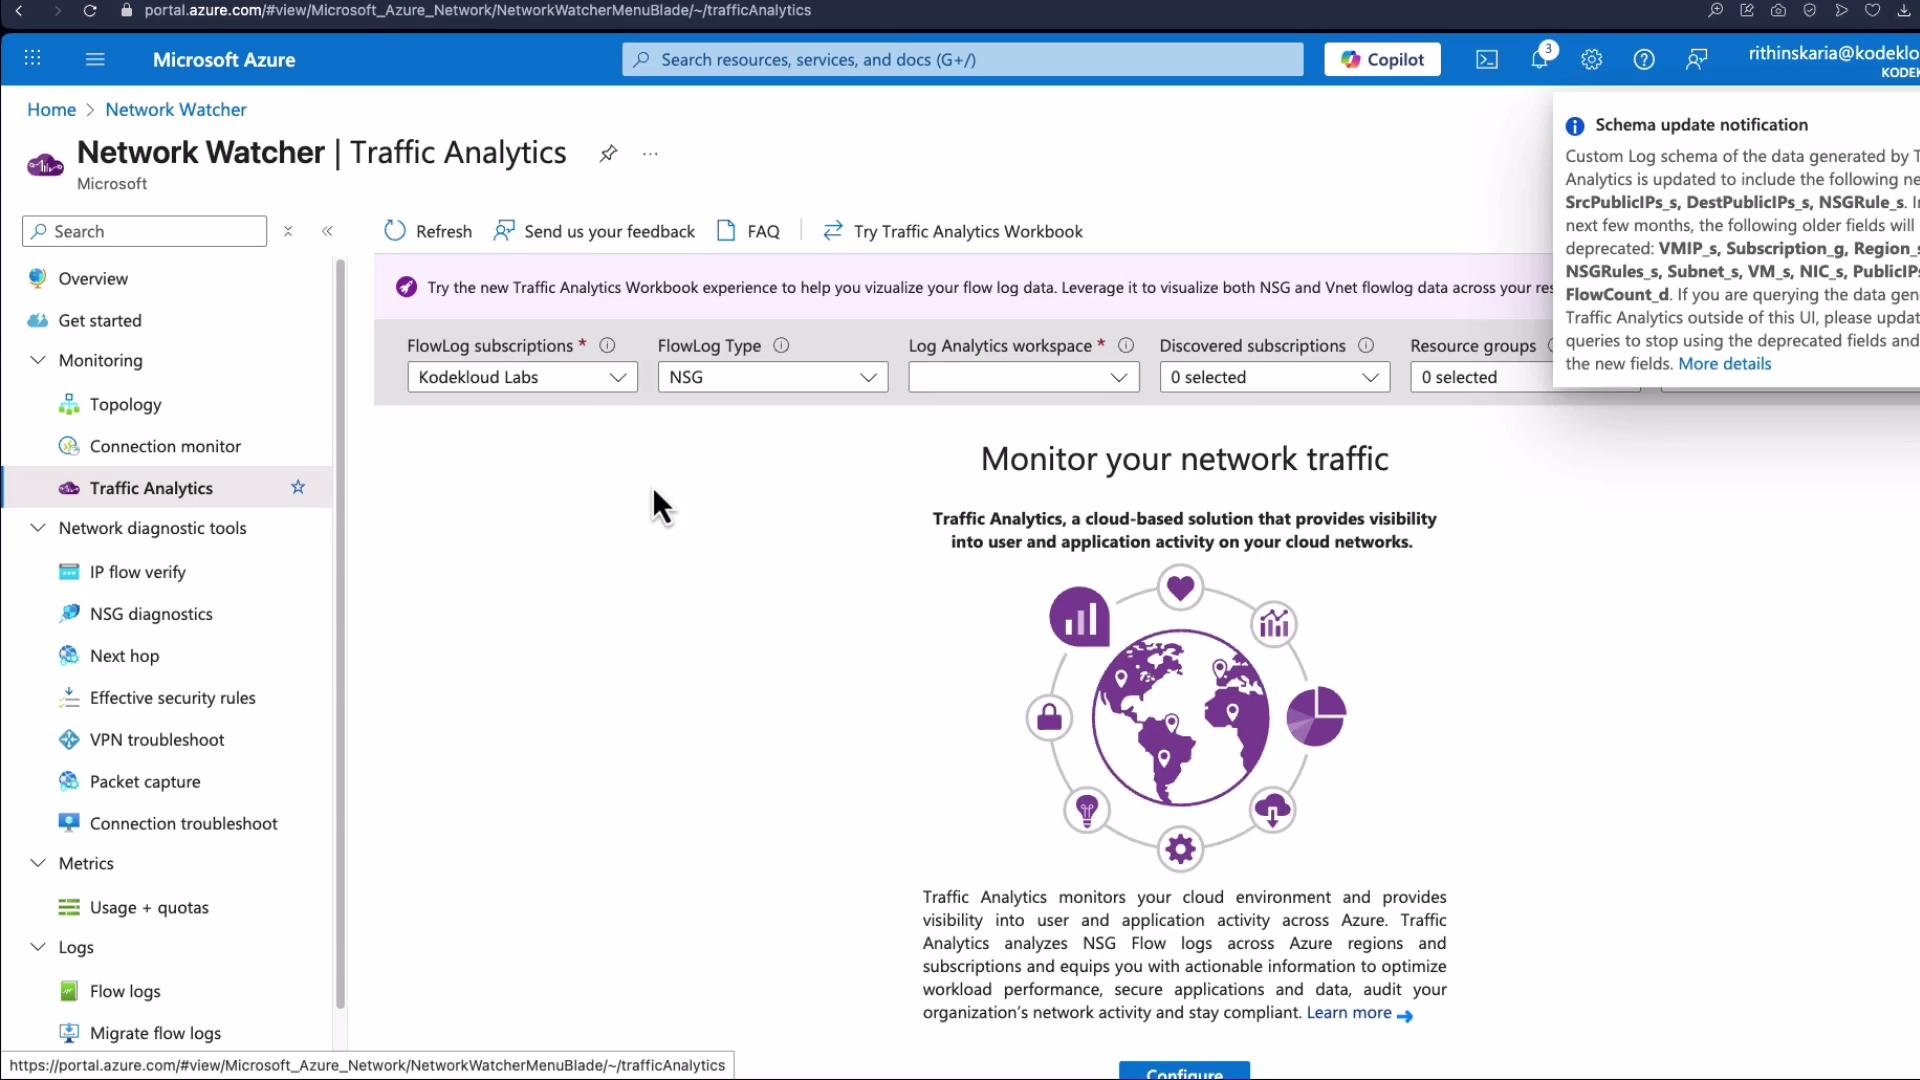
Traffic Analytics ingests flow logs via Log Analytics and visualizes traffic patterns, hotspots, blocked flows, and potential malicious attempts. It provides centralized dashboards and cross-region insights for trending and anomaly detection.
## Traffic Analytics
Traffic Analytics ingests flow logs via Log Analytics and visualizes traffic patterns, hotspots, blocked flows, and potential malicious attempts. It provides centralized dashboards and cross-region insights for trending and anomaly detection.
 ***
## Portal walkthrough — quick demos
The Network Watcher tools live in the Network Watcher blade in the Azure portal. Below are practical steps and what to expect in the UI for several common diagnostics.
### IP Flow Verify (portal steps)
1. Search for **Network Watcher** in the Azure portal.
2. Choose **IP Flow Verify** from the left-hand tools.
3. Select the VM and its NIC, choose protocol (TCP/UDP) and direction (inbound/outbound).
4. Enter local and remote IP addresses and ports, then run the test.\
Network Watcher will report whether the packet would be allowed and which NSG rule matched.
***
## Portal walkthrough — quick demos
The Network Watcher tools live in the Network Watcher blade in the Azure portal. Below are practical steps and what to expect in the UI for several common diagnostics.
### IP Flow Verify (portal steps)
1. Search for **Network Watcher** in the Azure portal.
2. Choose **IP Flow Verify** from the left-hand tools.
3. Select the VM and its NIC, choose protocol (TCP/UDP) and direction (inbound/outbound).
4. Enter local and remote IP addresses and ports, then run the test.\
Network Watcher will report whether the packet would be allowed and which NSG rule matched.
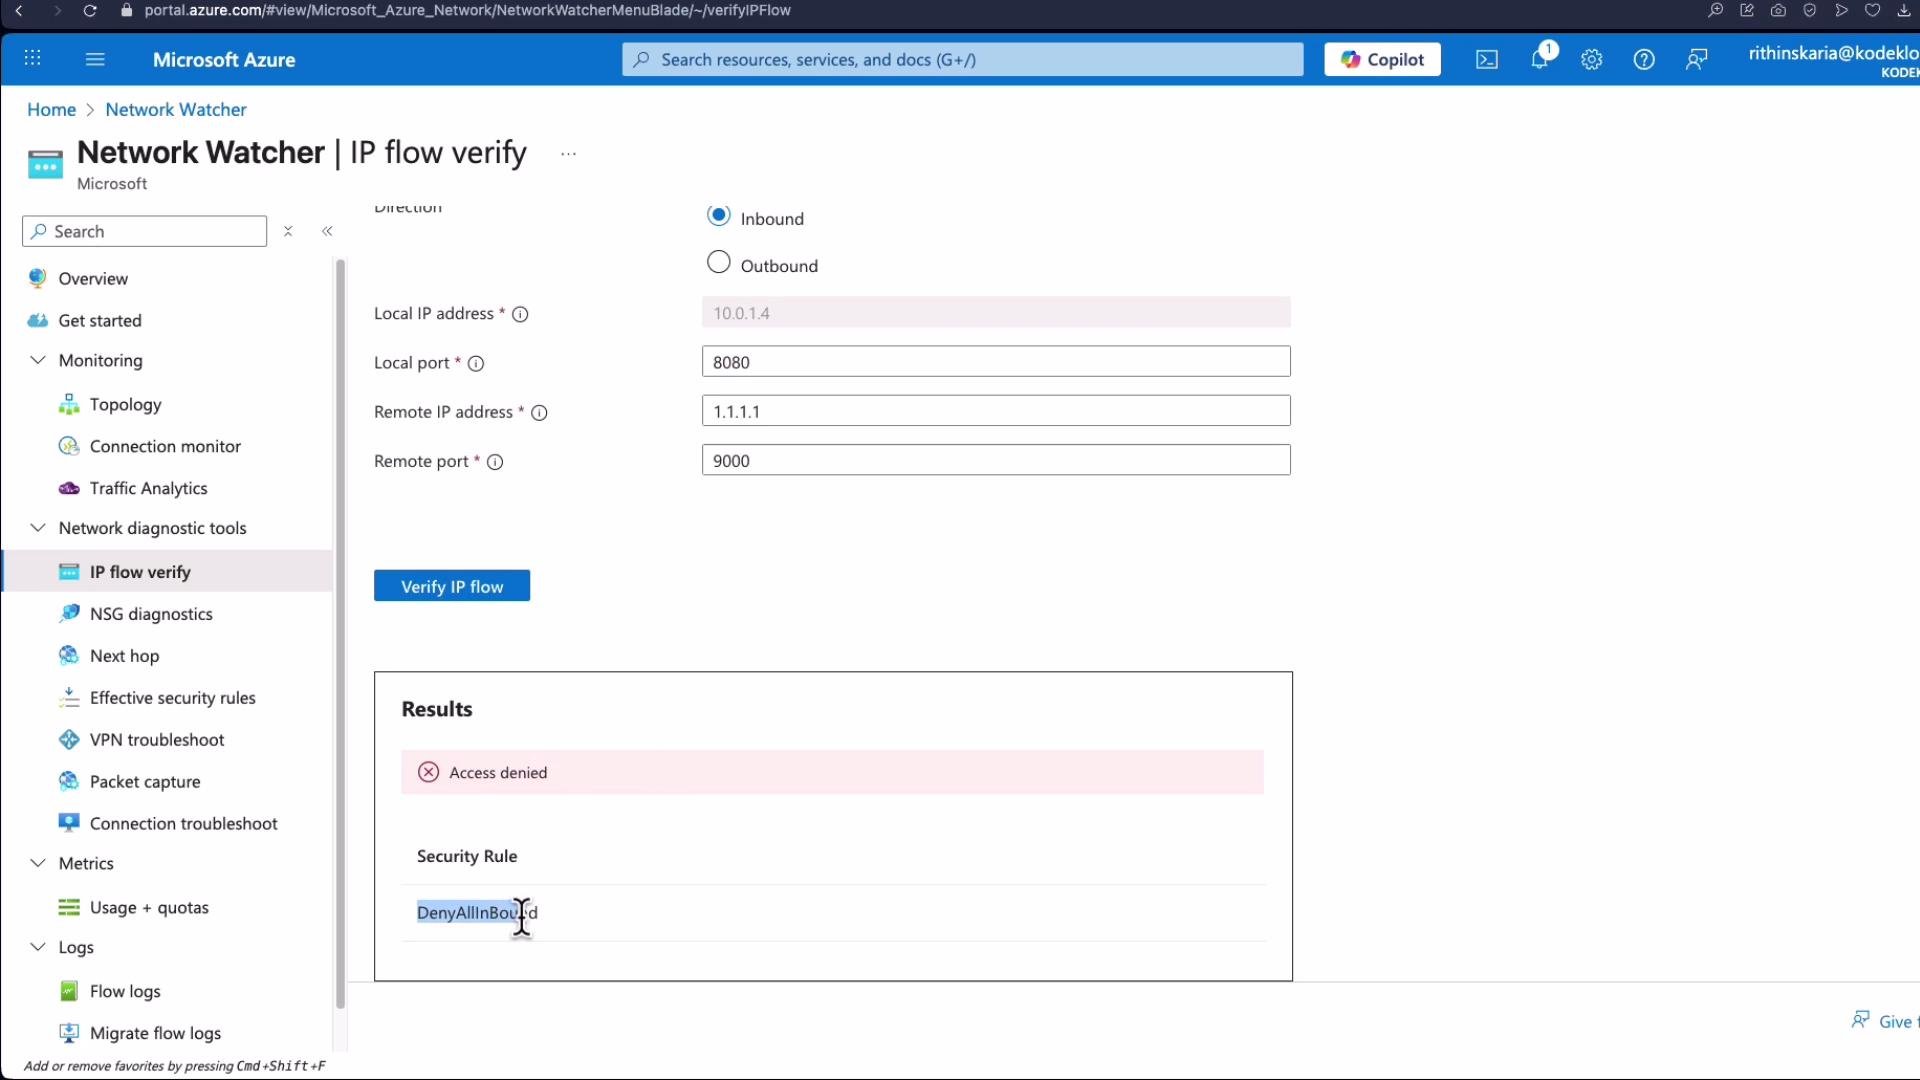
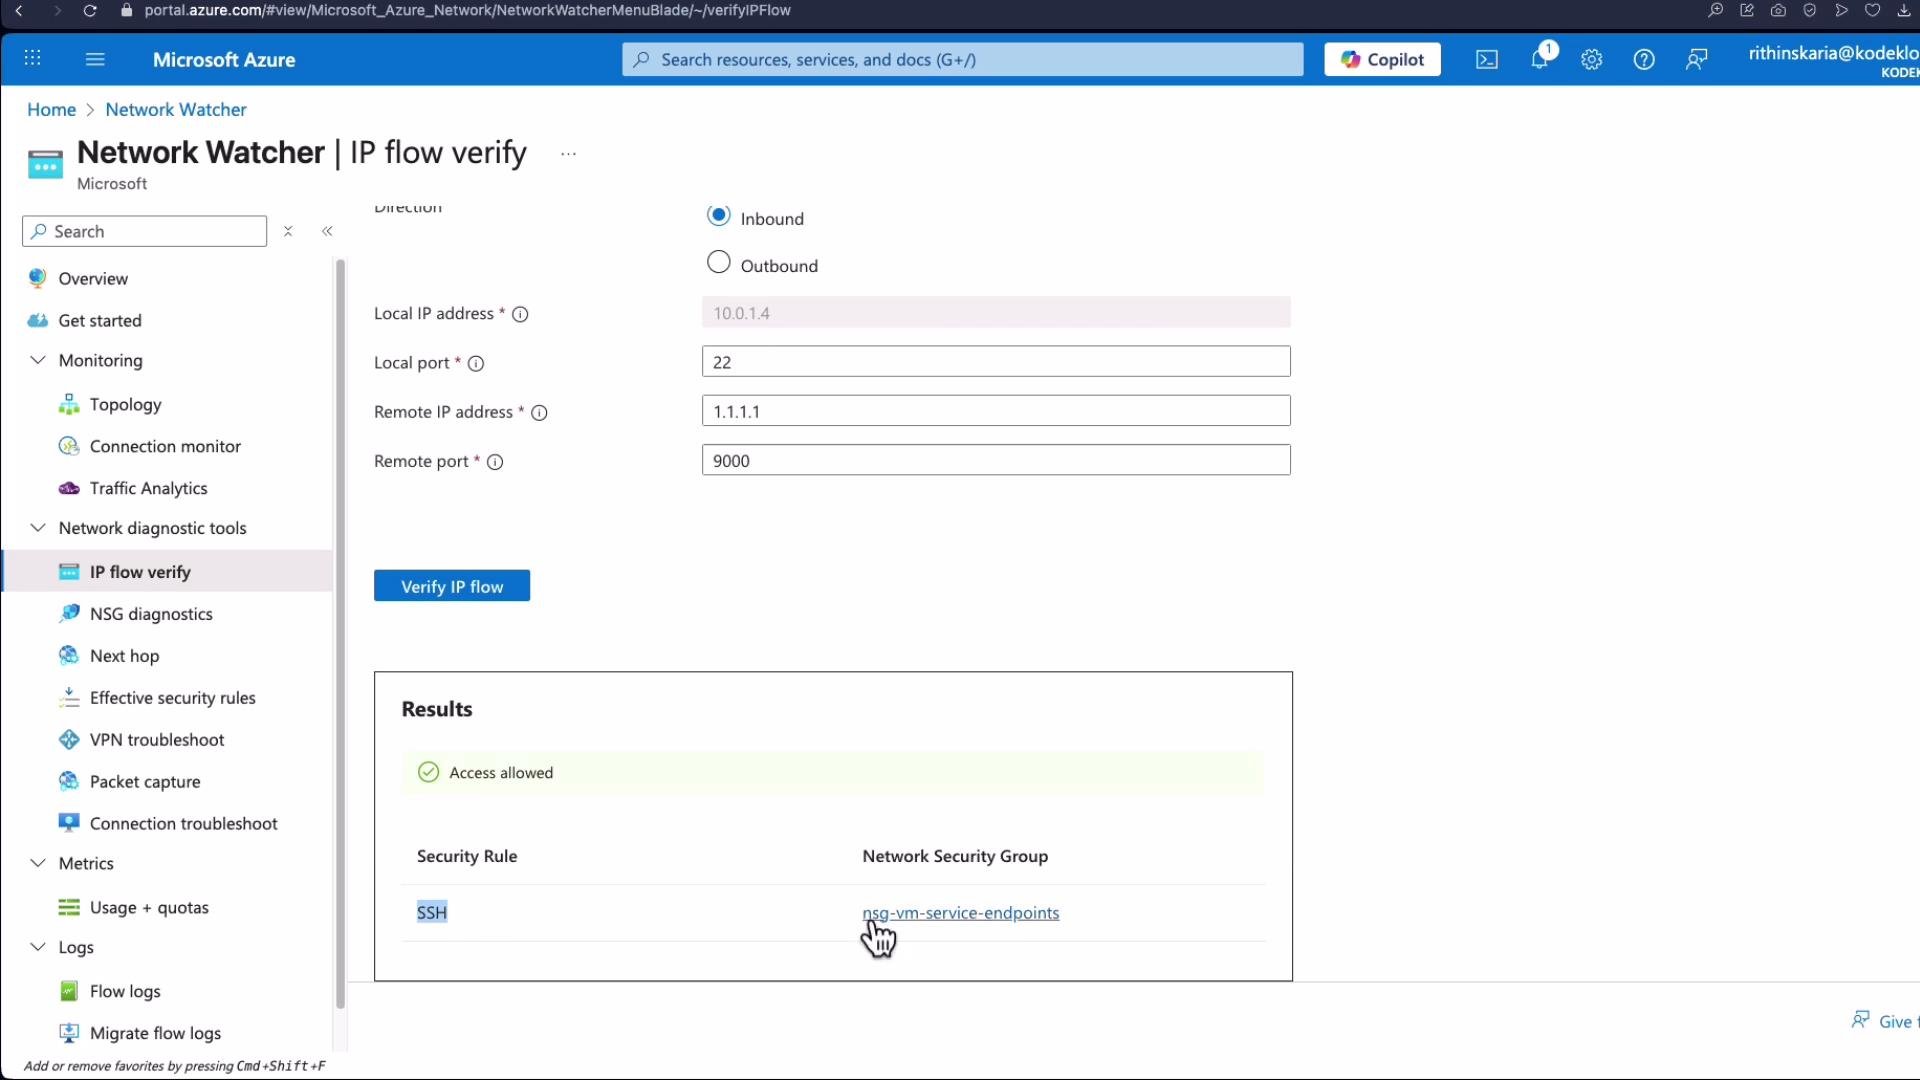 Try an unauthorized port (for example TCP 8080) to see IP Flow Verify return **Access denied** and identify the blocking rule.
 ### NSG diagnostics (portal steps)
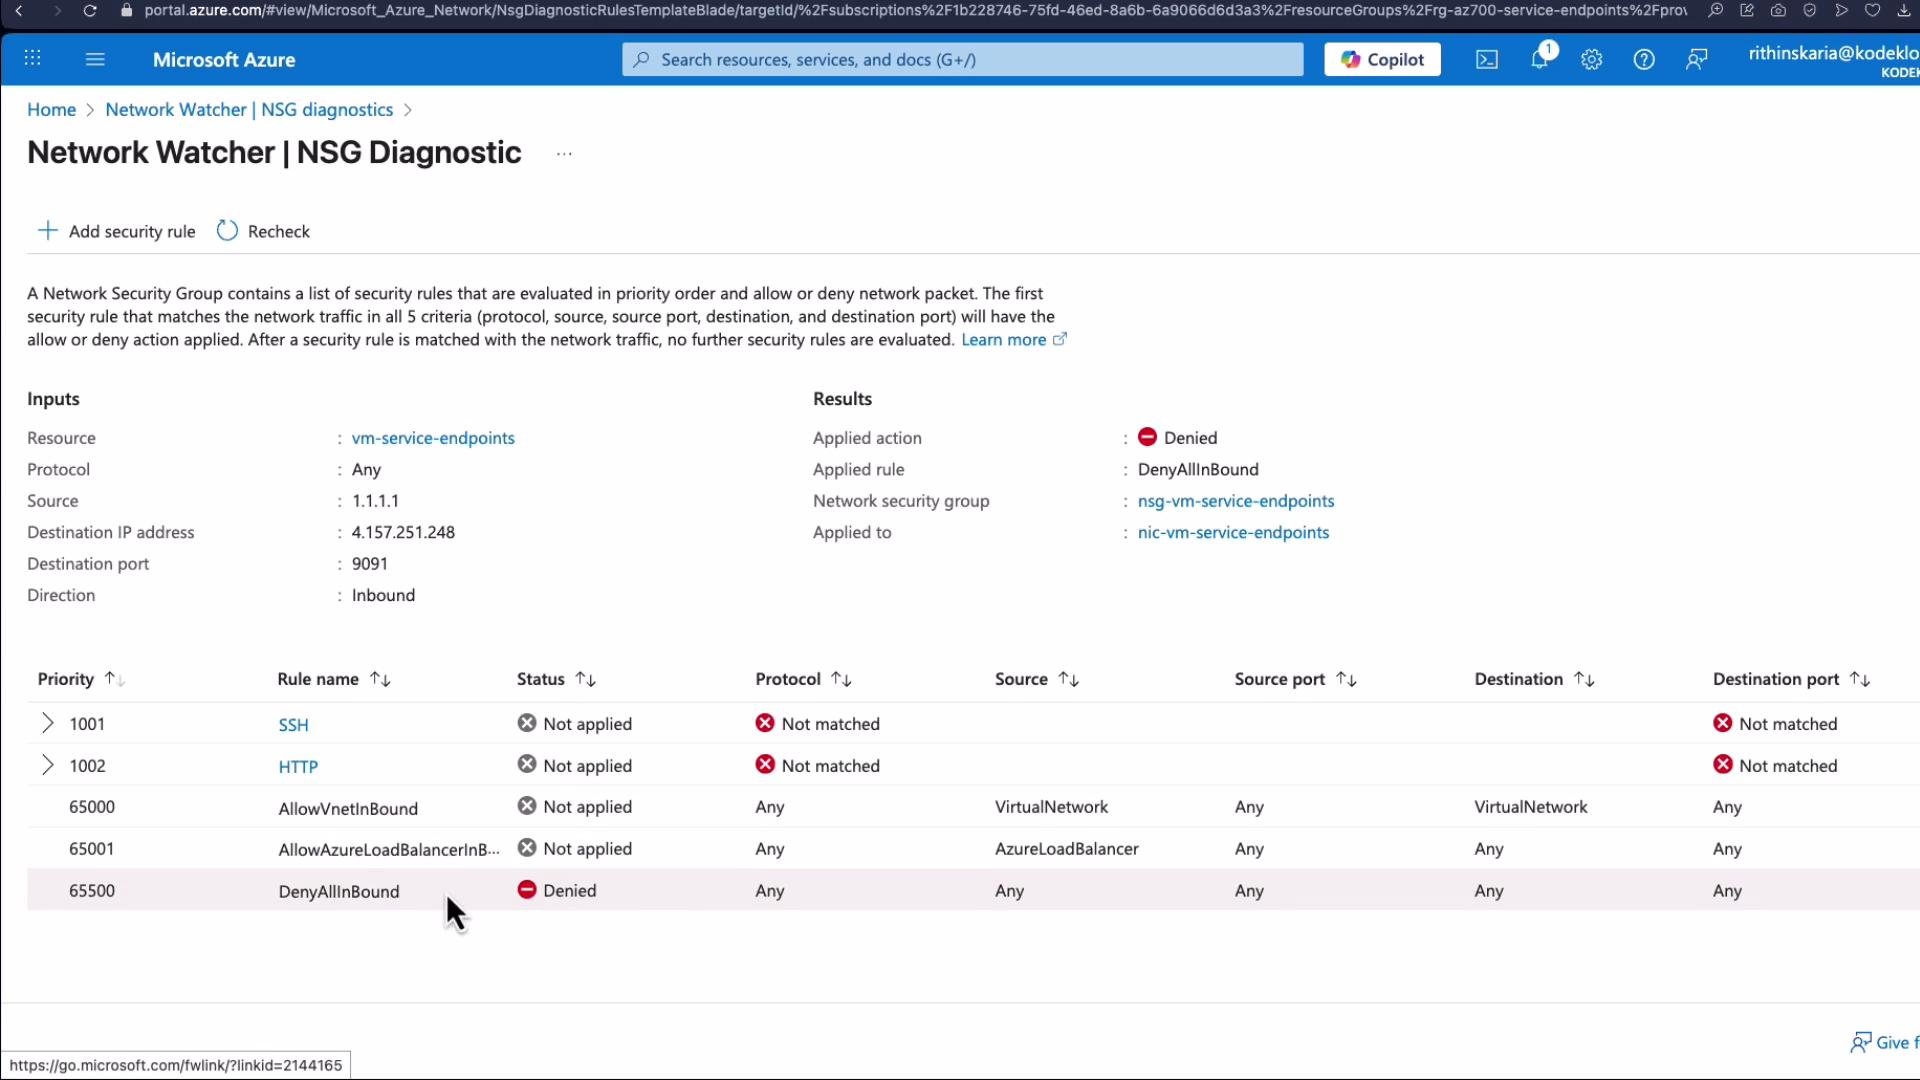
* Select **NSG diagnostics**, pick a VM and simulate traffic (protocol, direction, source IP, destination port).
* The tool runs a simulated evaluation and shows whether traffic would be allowed or denied and which rule matched (including priority and action).
### NSG diagnostics (portal steps)
* Select **NSG diagnostics**, pick a VM and simulate traffic (protocol, direction, source IP, destination port).
* The tool runs a simulated evaluation and shows whether traffic would be allowed or denied and which rule matched (including priority and action).
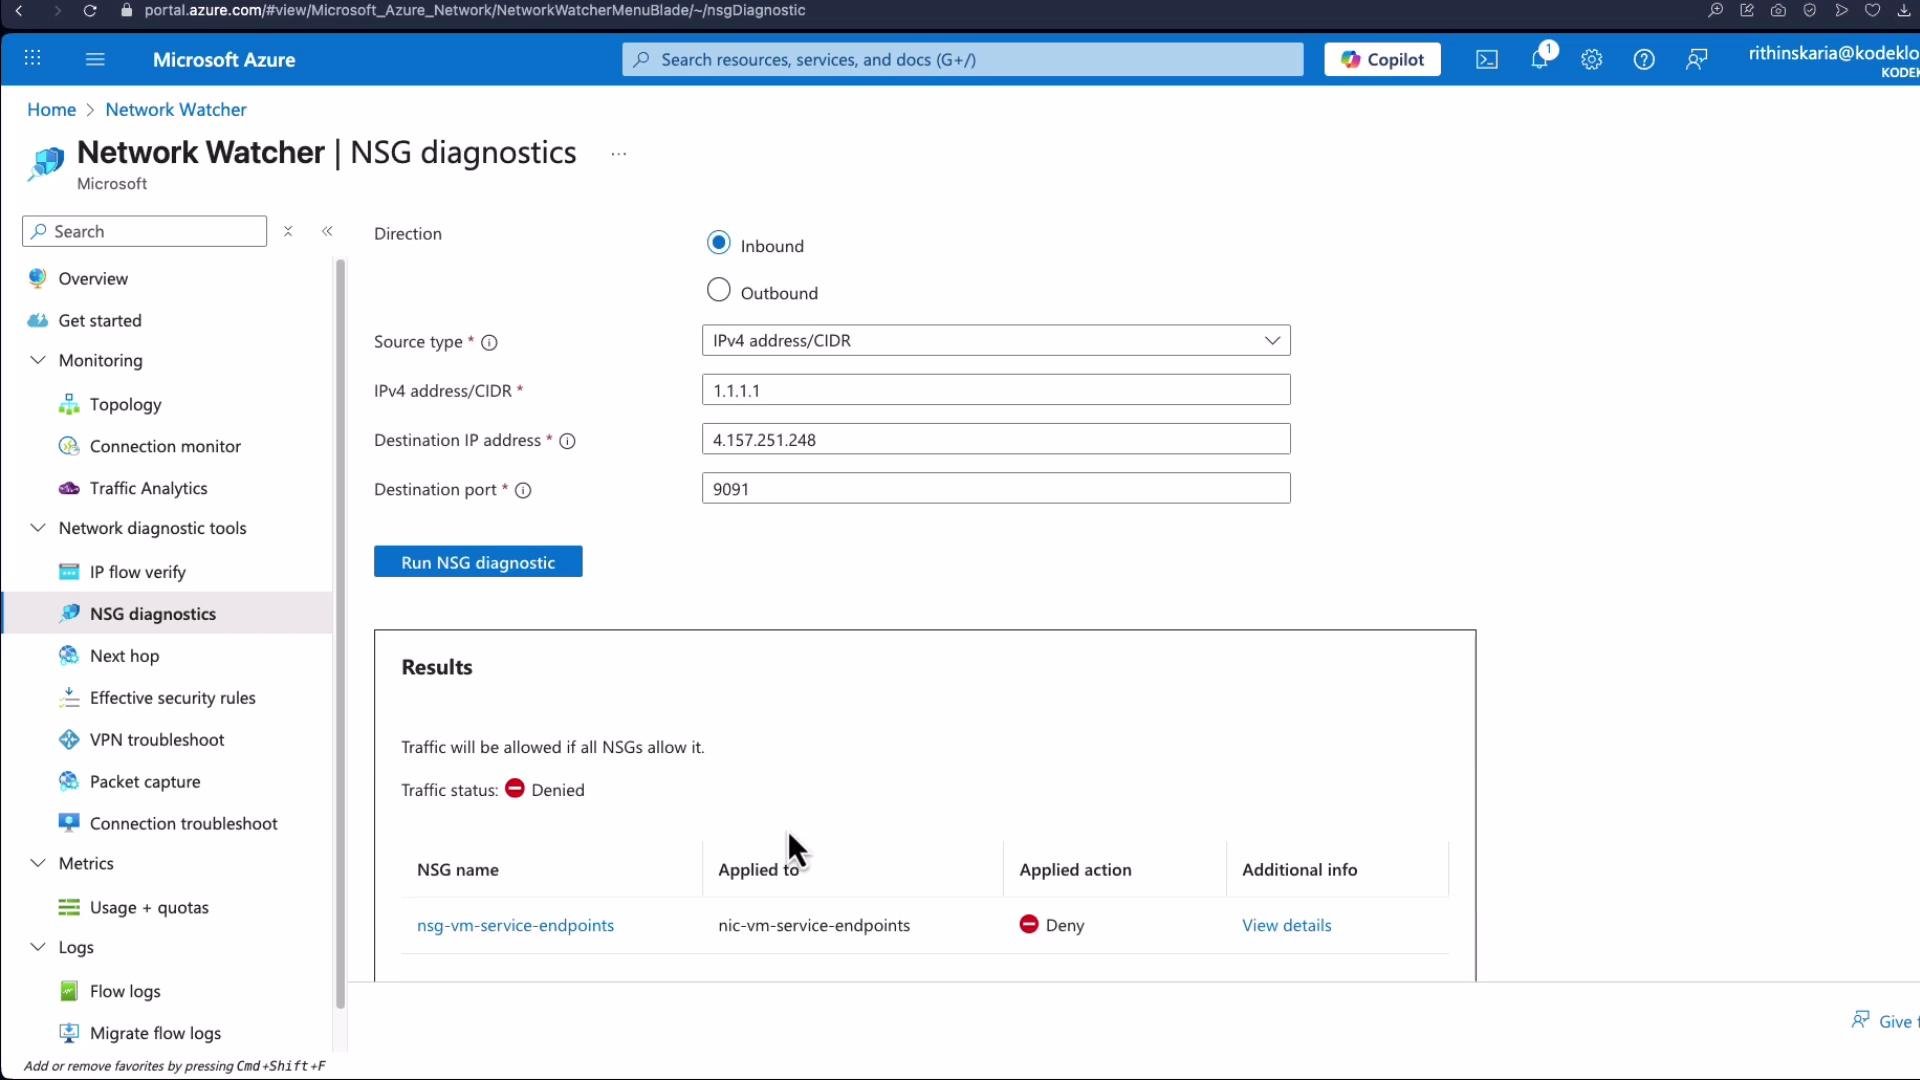 Click **View details** to see the rule evaluation order and the matching rule that caused the allow/deny decision.
 ### Next hop
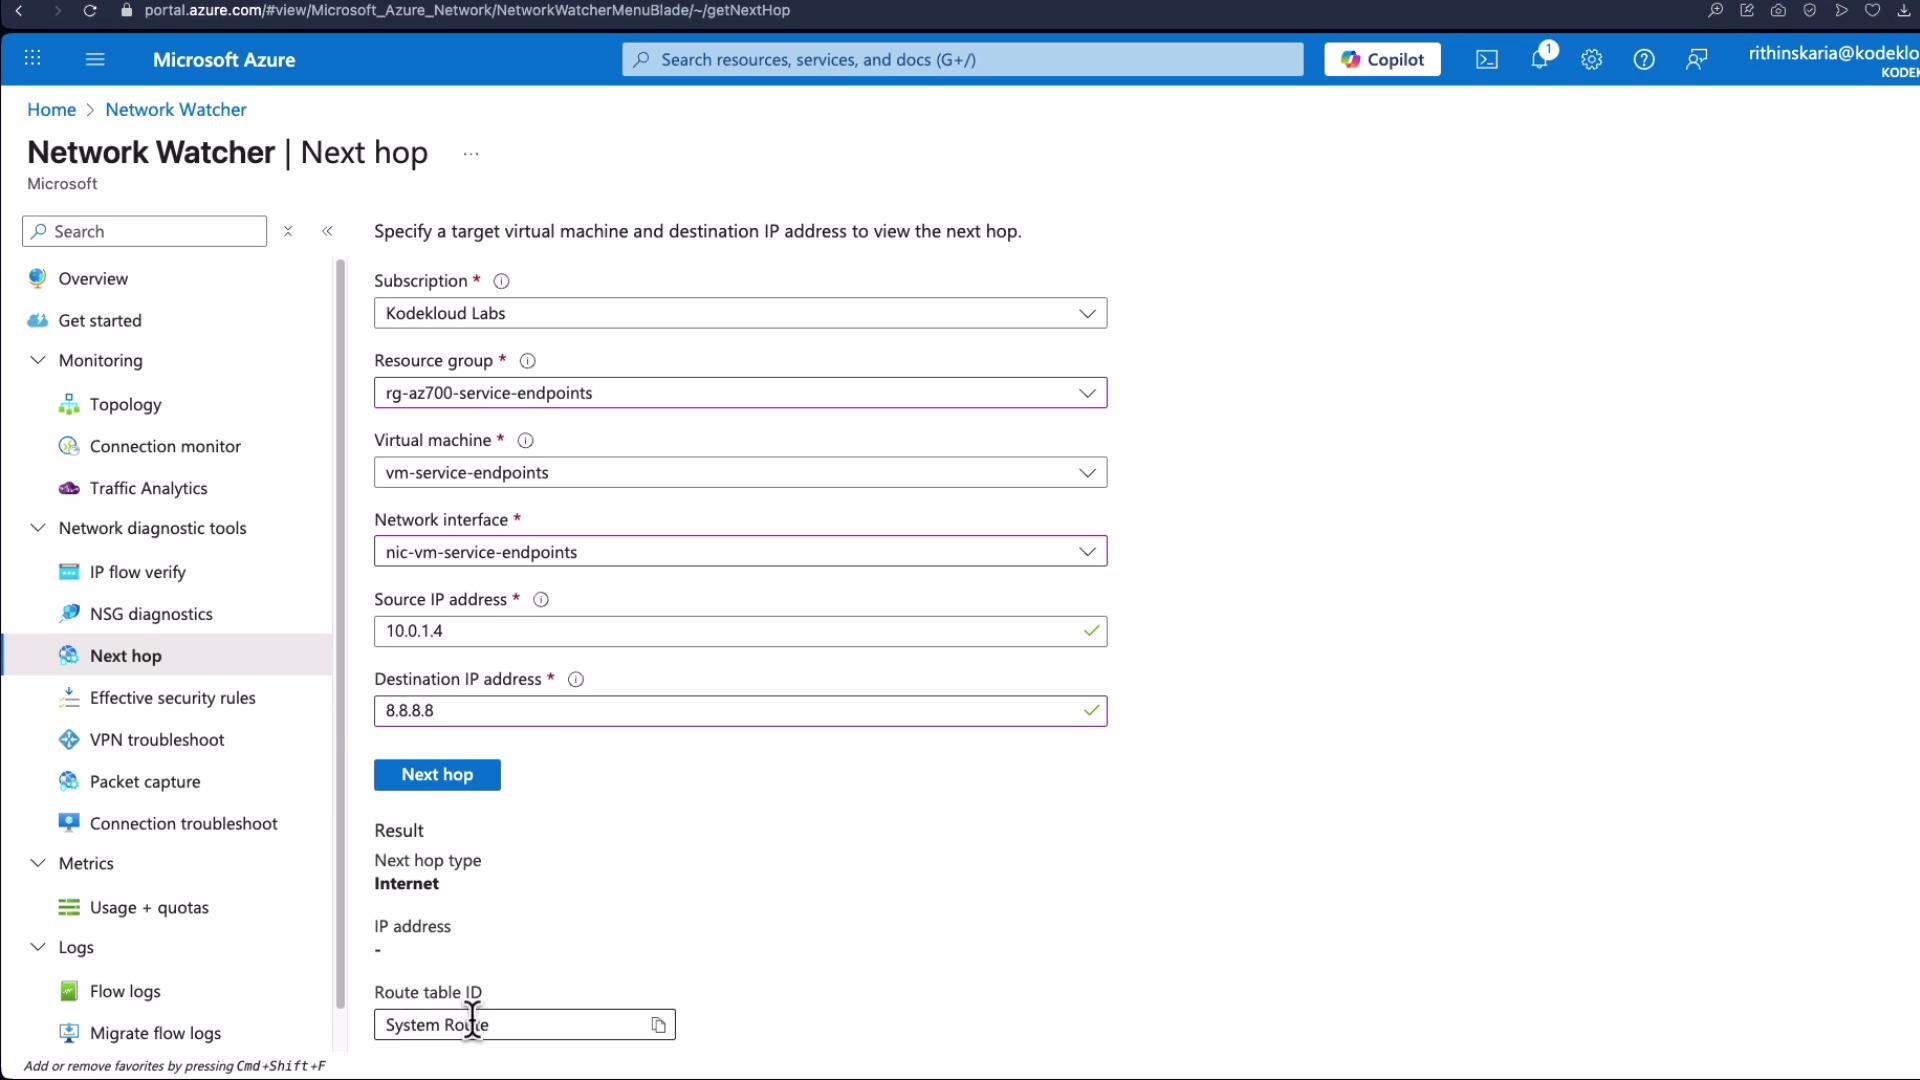
* Use the **Next Hop** tool to determine which route a VM uses for a destination IP (example: `8.8.8.8`).
* The result indicates next hop type (Internet, VirtualAppliance, VirtualNetworkGateway, VnetLocal, None) and whether a UDR or system route is used.
### Next hop
* Use the **Next Hop** tool to determine which route a VM uses for a destination IP (example: `8.8.8.8`).
* The result indicates next hop type (Internet, VirtualAppliance, VirtualNetworkGateway, VnetLocal, None) and whether a UDR or system route is used.
 ### Connection Troubleshoot (demo)
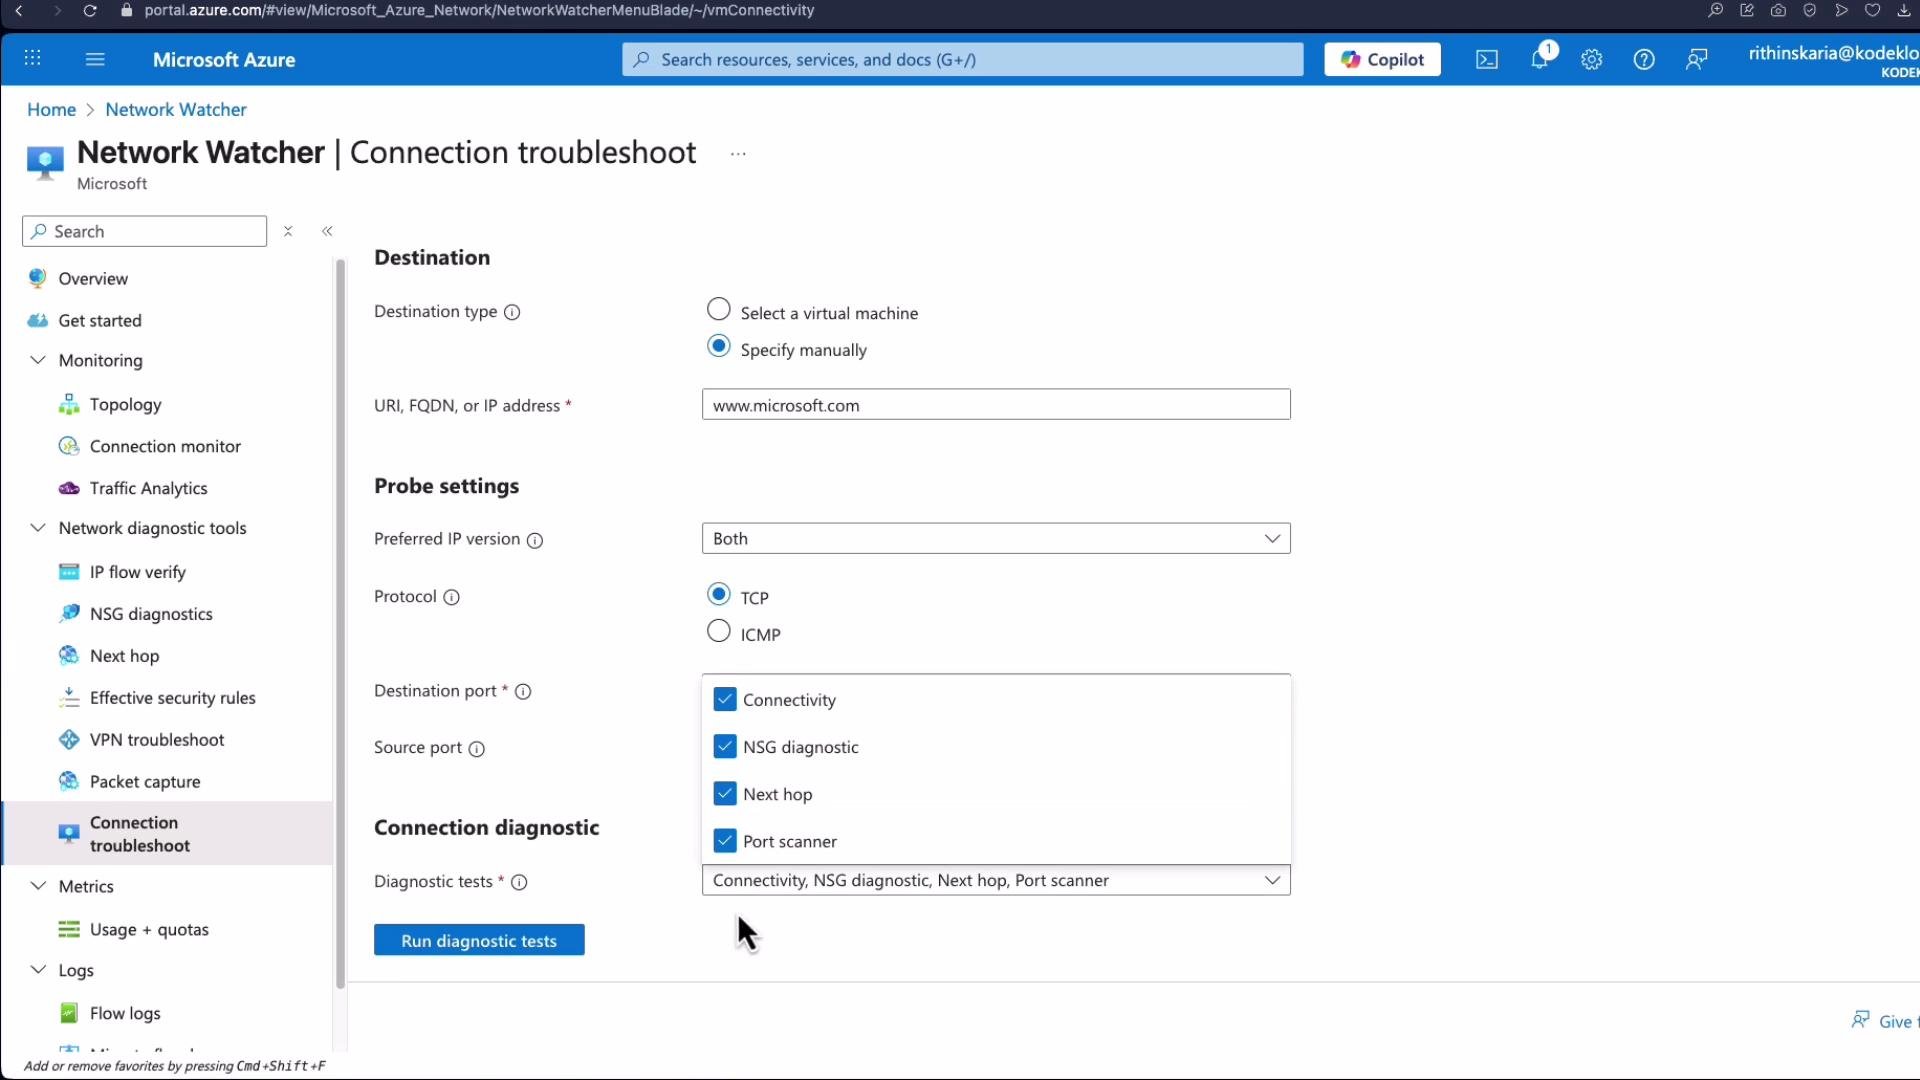
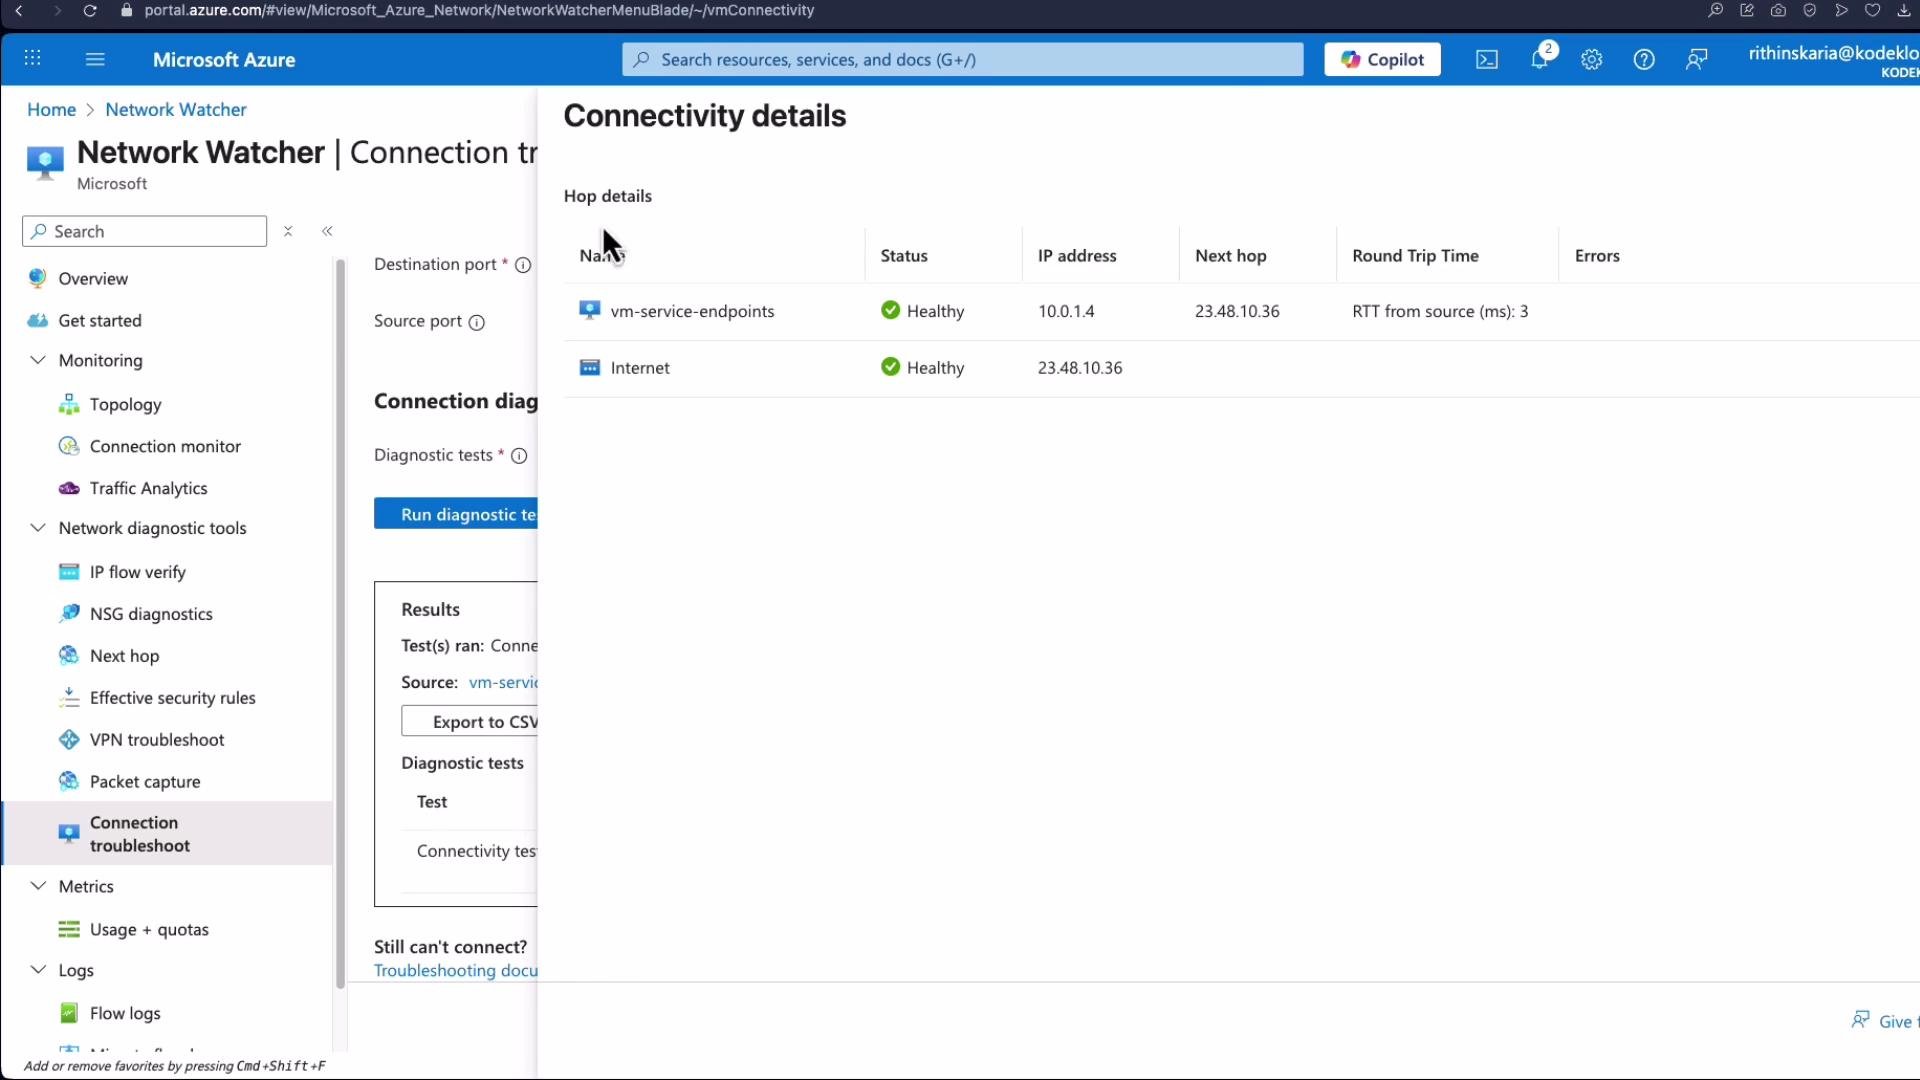
Connection Troubleshoot aggregates multiple checks (connectivity, NSG diagnostics, Next Hop, port scan). Provide the VM, destination (URI/FQDN/IP), protocol version, and port (for example `443`), then run the test. The report shows reachability, probe counts, failures, average/max latency, and provides a hop-by-hop path with diagnostics.
### Connection Troubleshoot (demo)
Connection Troubleshoot aggregates multiple checks (connectivity, NSG diagnostics, Next Hop, port scan). Provide the VM, destination (URI/FQDN/IP), protocol version, and port (for example `443`), then run the test. The report shows reachability, probe counts, failures, average/max latency, and provides a hop-by-hop path with diagnostics.
 The test summary includes overall reachability and a “See details” link to view per-hop diagnostics. In the sample run, the target was reachable with 66 probes, 0 failures, average latency 2 ms and max 7 ms.
 ### Flow Logs and Topology in the portal
* Use **Flow Logs** to enable NSG logging (allowed and denied flows). Store logs in Azure Storage and forward to Log Analytics or SIEM for retention and correlation.
* Use **Topology** to zoom into VNets and inspect VMs, NICs, NSG attachments, private endpoints, and IP configurations for quick verification of associations.
### Flow Logs and Topology in the portal
* Use **Flow Logs** to enable NSG logging (allowed and denied flows). Store logs in Azure Storage and forward to Log Analytics or SIEM for retention and correlation.
* Use **Topology** to zoom into VNets and inspect VMs, NICs, NSG attachments, private endpoints, and IP configurations for quick verification of associations.
 ### Connection Monitor & Traffic Analytics (portal)
* Use **Connection Monitor** to create continuous monitors for critical endpoints and push metrics to Azure Monitor.
* **Traffic Analytics** consumes NSG flow logs via Log Analytics to present dashboards, identify hotspots and blocked flows, and detect anomalies across regions.
### Connection Monitor & Traffic Analytics (portal)
* Use **Connection Monitor** to create continuous monitors for critical endpoints and push metrics to Azure Monitor.
* **Traffic Analytics** consumes NSG flow logs via Log Analytics to present dashboards, identify hotspots and blocked flows, and detect anomalies across regions.
 ***
## Tools quick reference
| Tool | Purpose | Portal location / Output |
| ----------------------- | ------------------------------------------------------ | ---------------------------------------------------------------- |
| Topology | Visualize VNets, NICs, NSGs, and associations | Network Watcher → Topology |
| Connection Monitor | Continuous endpoint monitoring (latency, availability) | Network Watcher → Connection Monitor (Azure Monitor integration) |
| IP Flow Verify | Simulate single packet through NSGs | Network Watcher → IP Flow Verify |
| NSG diagnostics | Detailed rule evaluation and priority matching | Network Watcher → NSG diagnostics |
| Next Hop | Determine route used to reach destination | Network Watcher → Next hop |
| Connection Troubleshoot | End-to-end path, hop-by-hop diagnostics | Network Watcher → Connection Troubleshoot |
| Packet capture | Collect raw packets for analysis | Network Watcher → Packet capture (stores to Storage/VM) |
| Flow Logs | Record allowed/denied NSG flows | Network Watcher → Flow Logs (Storage / Log Analytics) |
| Traffic Analytics | Analyze flow logs, dashboards and trends | Log Analytics → Traffic Analytics |
***
## Conclusion
Azure Network Watcher is a comprehensive toolkit for visibility and troubleshooting across Azure and hybrid networks. Combine topology, connection tests, NSG evaluation, packet captures, flow logs, and analytics to speed root-cause analysis and maintain reliable, secure network operations.
For further reading:
* [Azure Network Watcher documentation](https://learn.microsoft.com/azure/network-watcher)
* [Monitor networks with Network Watcher — tutorials and best practices](https://learn.microsoft.com/azure/network-watcher/network-watcher-monitoring-overview)
***
## Tools quick reference
| Tool | Purpose | Portal location / Output |
| ----------------------- | ------------------------------------------------------ | ---------------------------------------------------------------- |
| Topology | Visualize VNets, NICs, NSGs, and associations | Network Watcher → Topology |
| Connection Monitor | Continuous endpoint monitoring (latency, availability) | Network Watcher → Connection Monitor (Azure Monitor integration) |
| IP Flow Verify | Simulate single packet through NSGs | Network Watcher → IP Flow Verify |
| NSG diagnostics | Detailed rule evaluation and priority matching | Network Watcher → NSG diagnostics |
| Next Hop | Determine route used to reach destination | Network Watcher → Next hop |
| Connection Troubleshoot | End-to-end path, hop-by-hop diagnostics | Network Watcher → Connection Troubleshoot |
| Packet capture | Collect raw packets for analysis | Network Watcher → Packet capture (stores to Storage/VM) |
| Flow Logs | Record allowed/denied NSG flows | Network Watcher → Flow Logs (Storage / Log Analytics) |
| Traffic Analytics | Analyze flow logs, dashboards and trends | Log Analytics → Traffic Analytics |
***
## Conclusion
Azure Network Watcher is a comprehensive toolkit for visibility and troubleshooting across Azure and hybrid networks. Combine topology, connection tests, NSG evaluation, packet captures, flow logs, and analytics to speed root-cause analysis and maintain reliable, secure network operations.
For further reading:
* [Azure Network Watcher documentation](https://learn.microsoft.com/azure/network-watcher)
* [Monitor networks with Network Watcher — tutorials and best practices](https://learn.microsoft.com/azure/network-watcher/network-watcher-monitoring-overview)