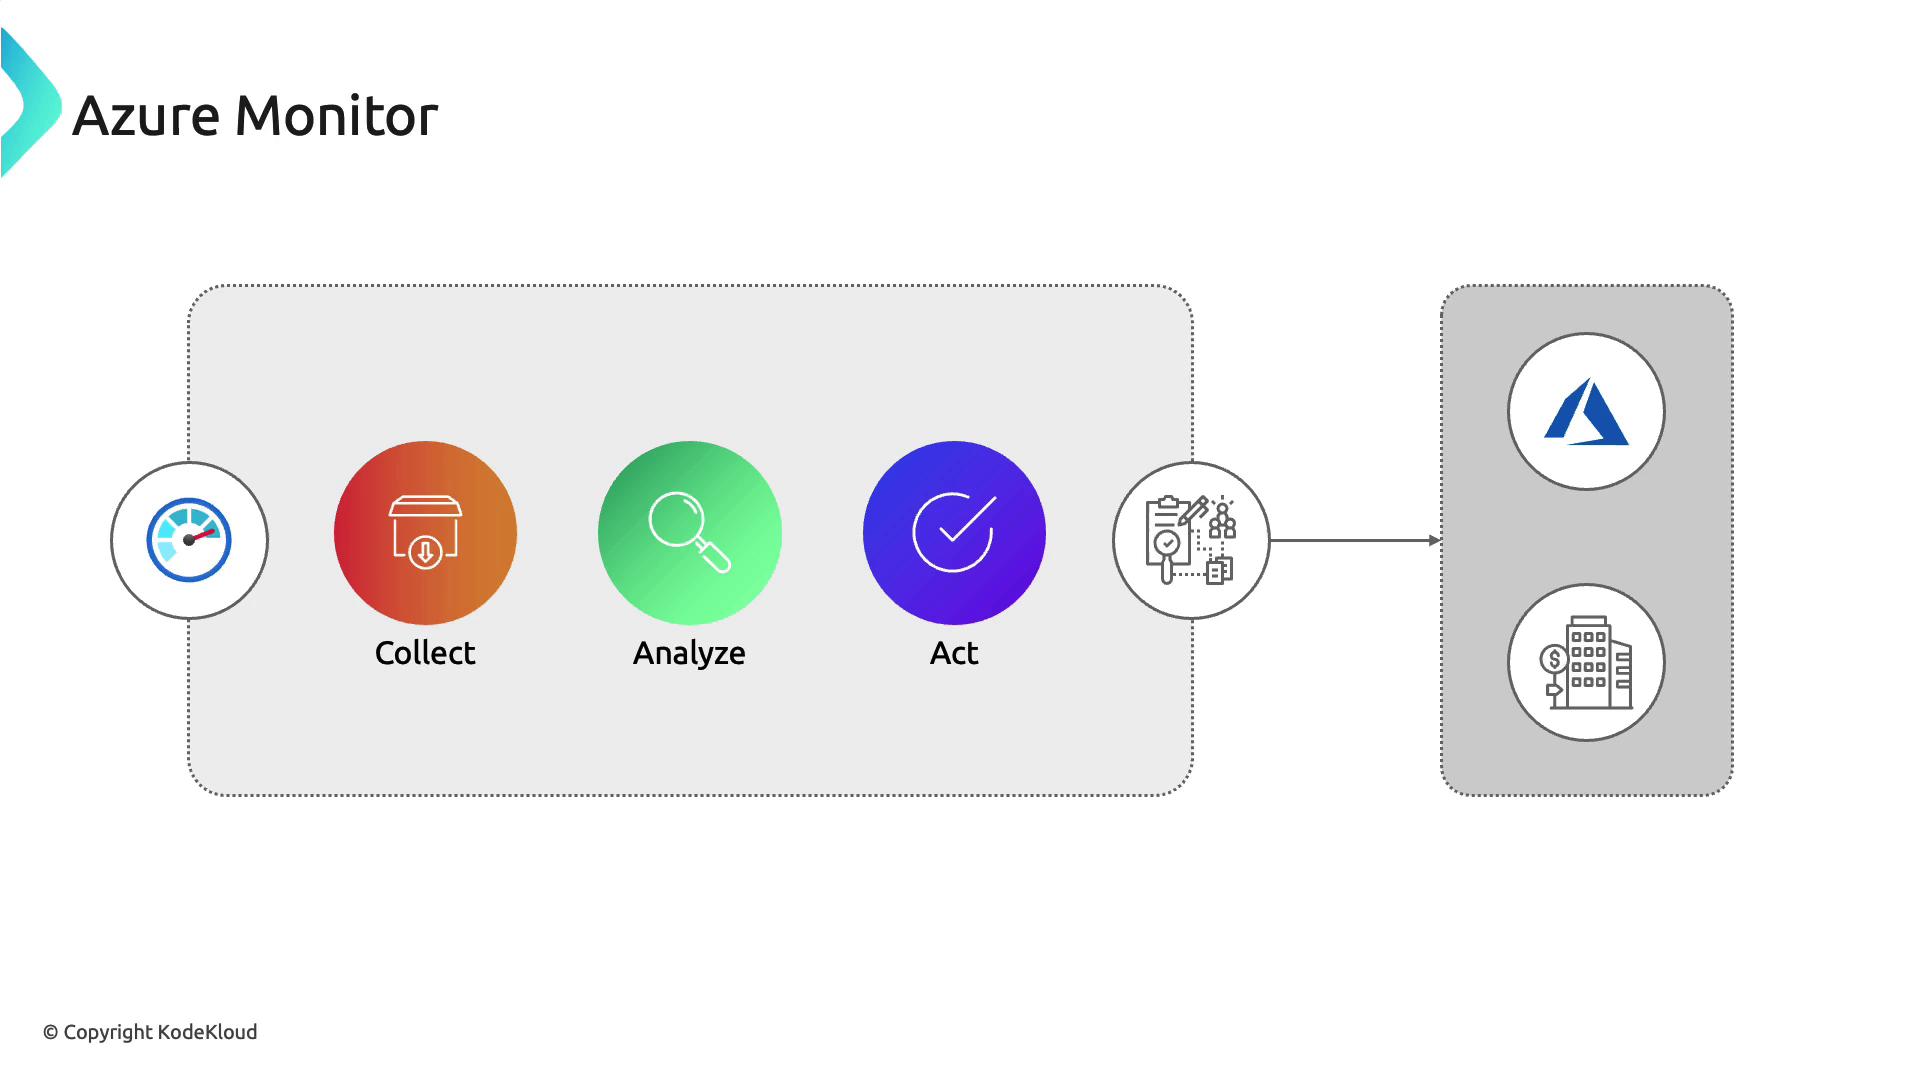
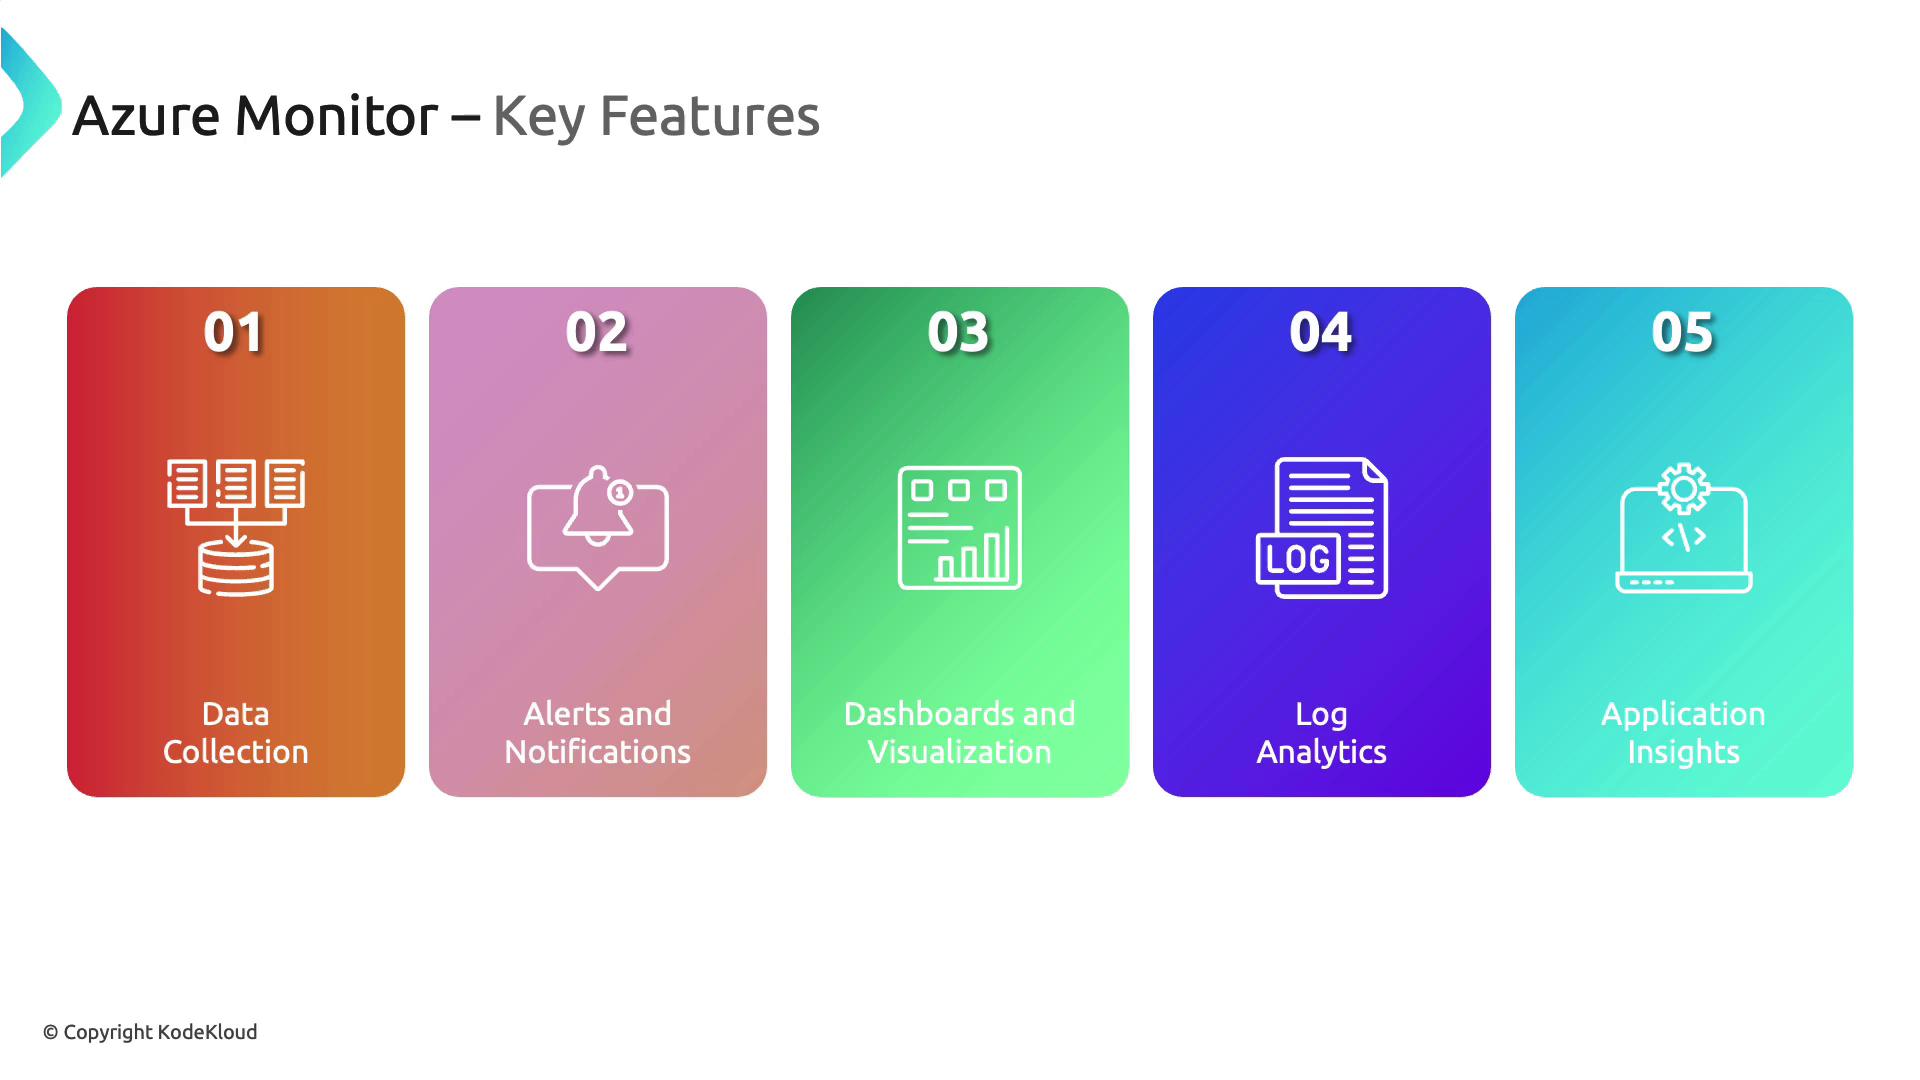
- Data Collection: Aggregates performance and operational telemetry from various Azure resources, on-premises systems, and even other cloud providers, offering a comprehensive view of your environment.
- Alerts and Notifications: Enables proactive alert configuration so you can respond quickly to critical events.
- Dashboards and Visualization: Allows you to create custom dashboards, making it easy to visualize complex data and monitor resource metrics efficiently.
- Log Analytics: An integral component that stores and analyzes logs, enabling you to query data for troubleshooting and in-depth analysis.
- Application Insights: Delivers real-time performance insights for live applications, helping ensure an optimal user experience.
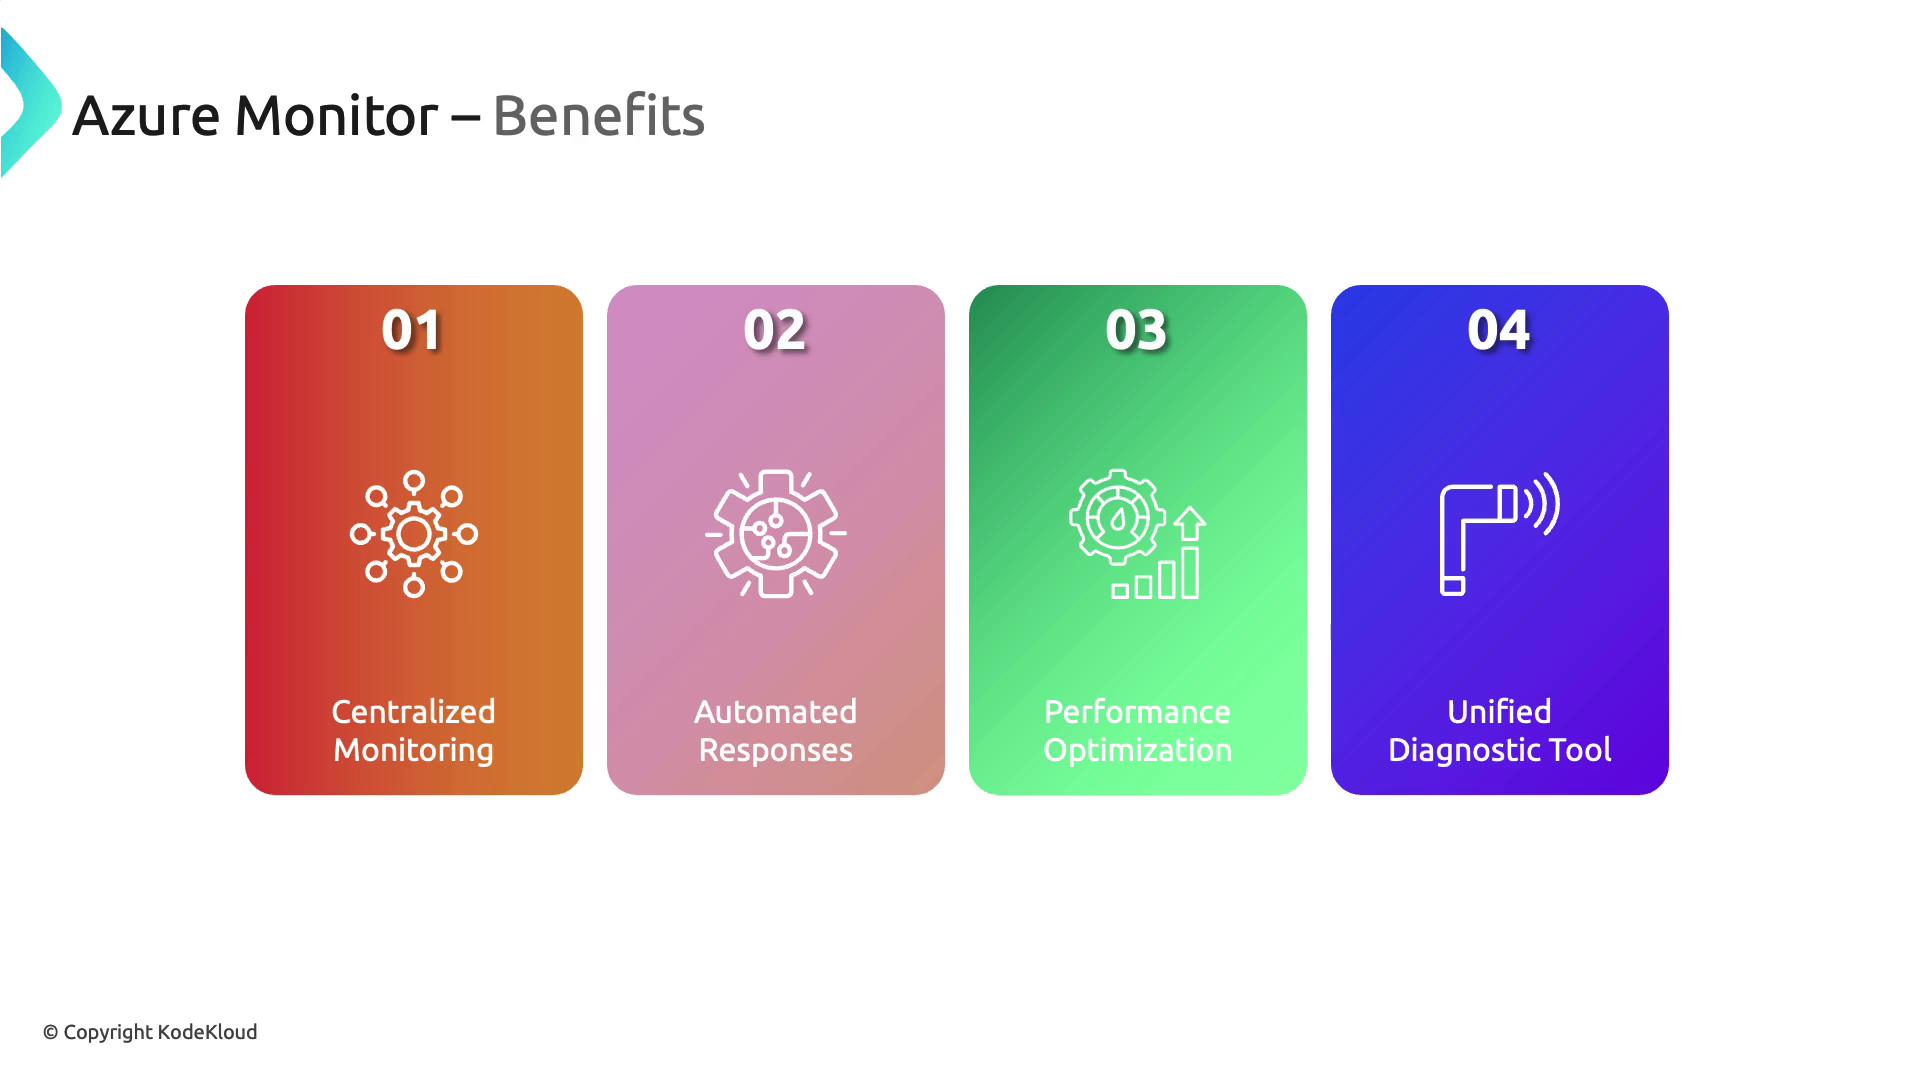
Benefits of Azure Monitor
Azure Monitor offers several significant benefits, making it an essential tool for modern IT operations:- Centralized Monitoring: Access a unified interface that aggregates data from all your Azure and on-premises resources. For instance, servers onboarded using Azure Arc can send both metrics and logs directly to Azure Monitor.
- Automated Response: Set up automated actions that trigger in response to specific events, facilitating rapid issue resolution.
- Performance Optimization: Quickly identify performance bottlenecks and pinpoint areas for enhancement, ensuring your applications remain efficient.
- Unified Diagnostic Tool: Simplify troubleshooting by obtaining integrated views of network, application, and infrastructure diagnostics.
Navigating Azure Monitor in the Azure Portal
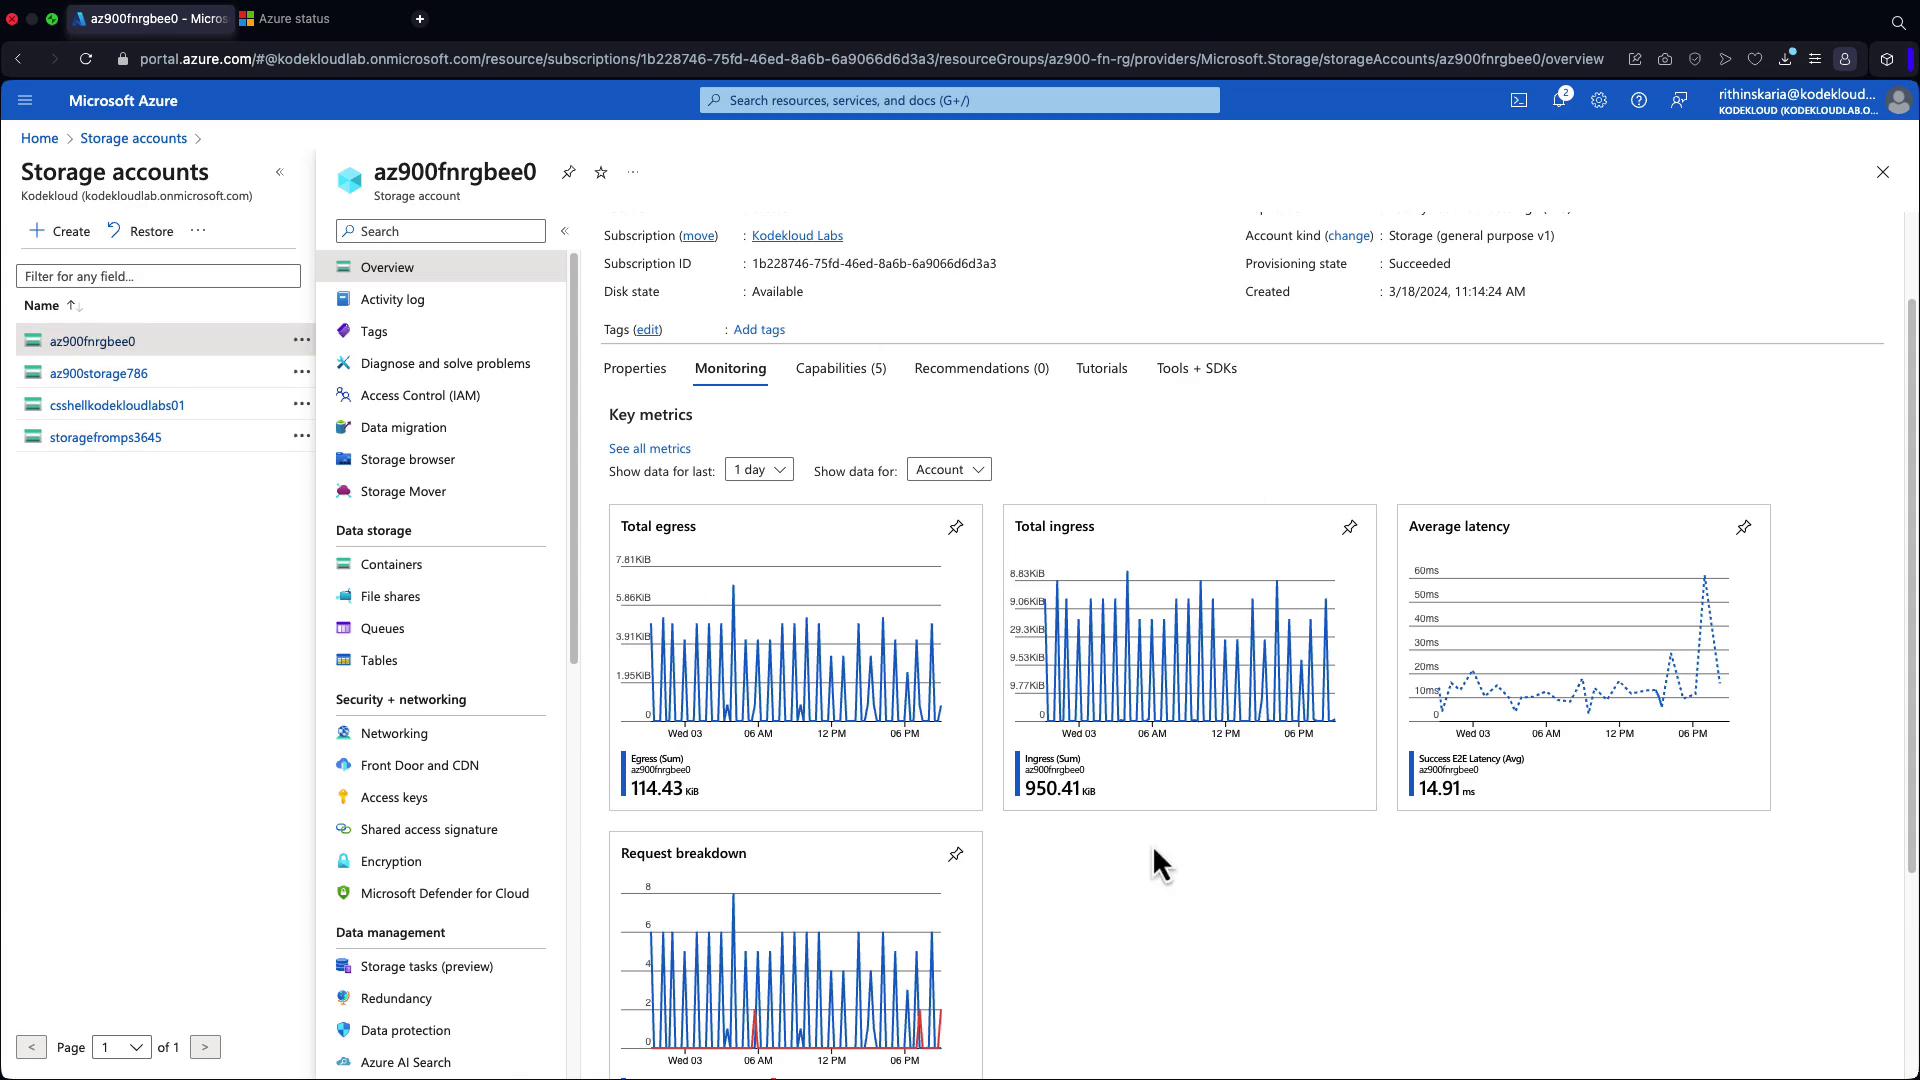
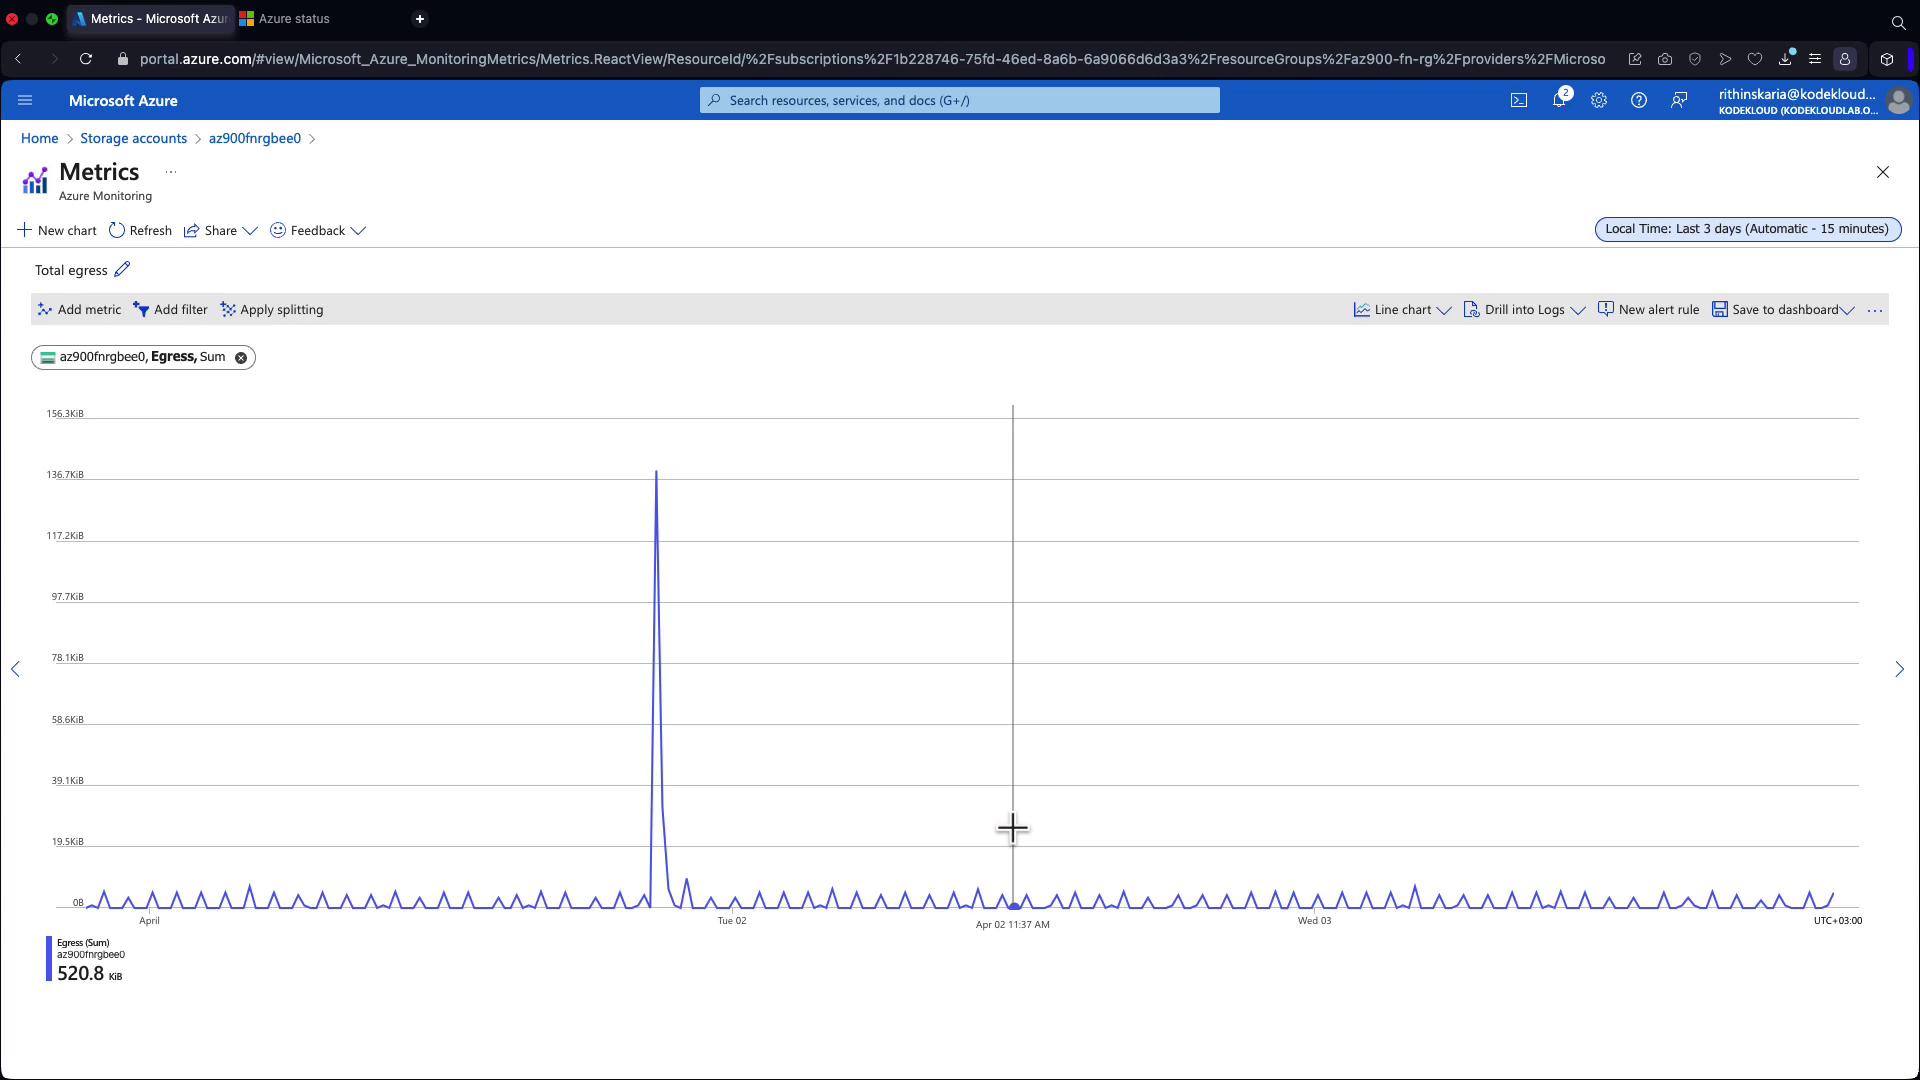
When you sign in to the Azure Portal, navigating to Azure Monitor is straightforward. After logging in, select Azure Monitor from the main menu to view the array of monitoring services available. For example, if you select a storage account and navigate to its “Monitoring” section, you’ll see key metrics such as:- Total egress and ingress
- Latency
- Request breakdown
When analyzing logs for in-depth insights, remember that extended data retention and advanced queries may incur extra charges.