> ## Documentation Index
> Fetch the complete documentation index at: https://notes.kodekloud.com/llms.txt
> Use this file to discover all available pages before exploring further.
# Forward Audit Logs to External Server
> How to forward Jenkins Audit Trail log files from a controller to Elastic Cloud using Elastic Agent, configure elastic-agent.yml, restart agent, and verify logs in Kibana
This guide shows how to forward Jenkins Audit Trail logs (already written to a file on the Jenkins controller) to Elastic Cloud (hosted Elasticsearch) using the Elastic Agent. The high-level flow:
1. Use Elastic Cloud Observability onboarding to get the Elastic Agent installation command and API key.
2. Install the Elastic Agent on the Jenkins controller.
3. Update the Elastic Agent configuration at `/opt/Elastic/Agent/elastic-agent.yml` to stream the Audit Trail files.
4. Verify logs in Kibana / Elastic Cloud Observability.
Recommended reading:
* [Elastic Cloud](https://www.elastic.co/cloud/)
* [Kibana](https://www.elastic.co/kibana/)
## 1. Create an Elastic Cloud trial and get onboarding details
In Elastic Cloud, open the Observability tab → Collect and analyze logs → choose the resource type to monitor (for a Jenkins controller, choose host system logs or stream log files). Elastic Cloud will produce an onboarding one-liner that downloads and installs the Elastic Agent and enrolls it with your cluster.
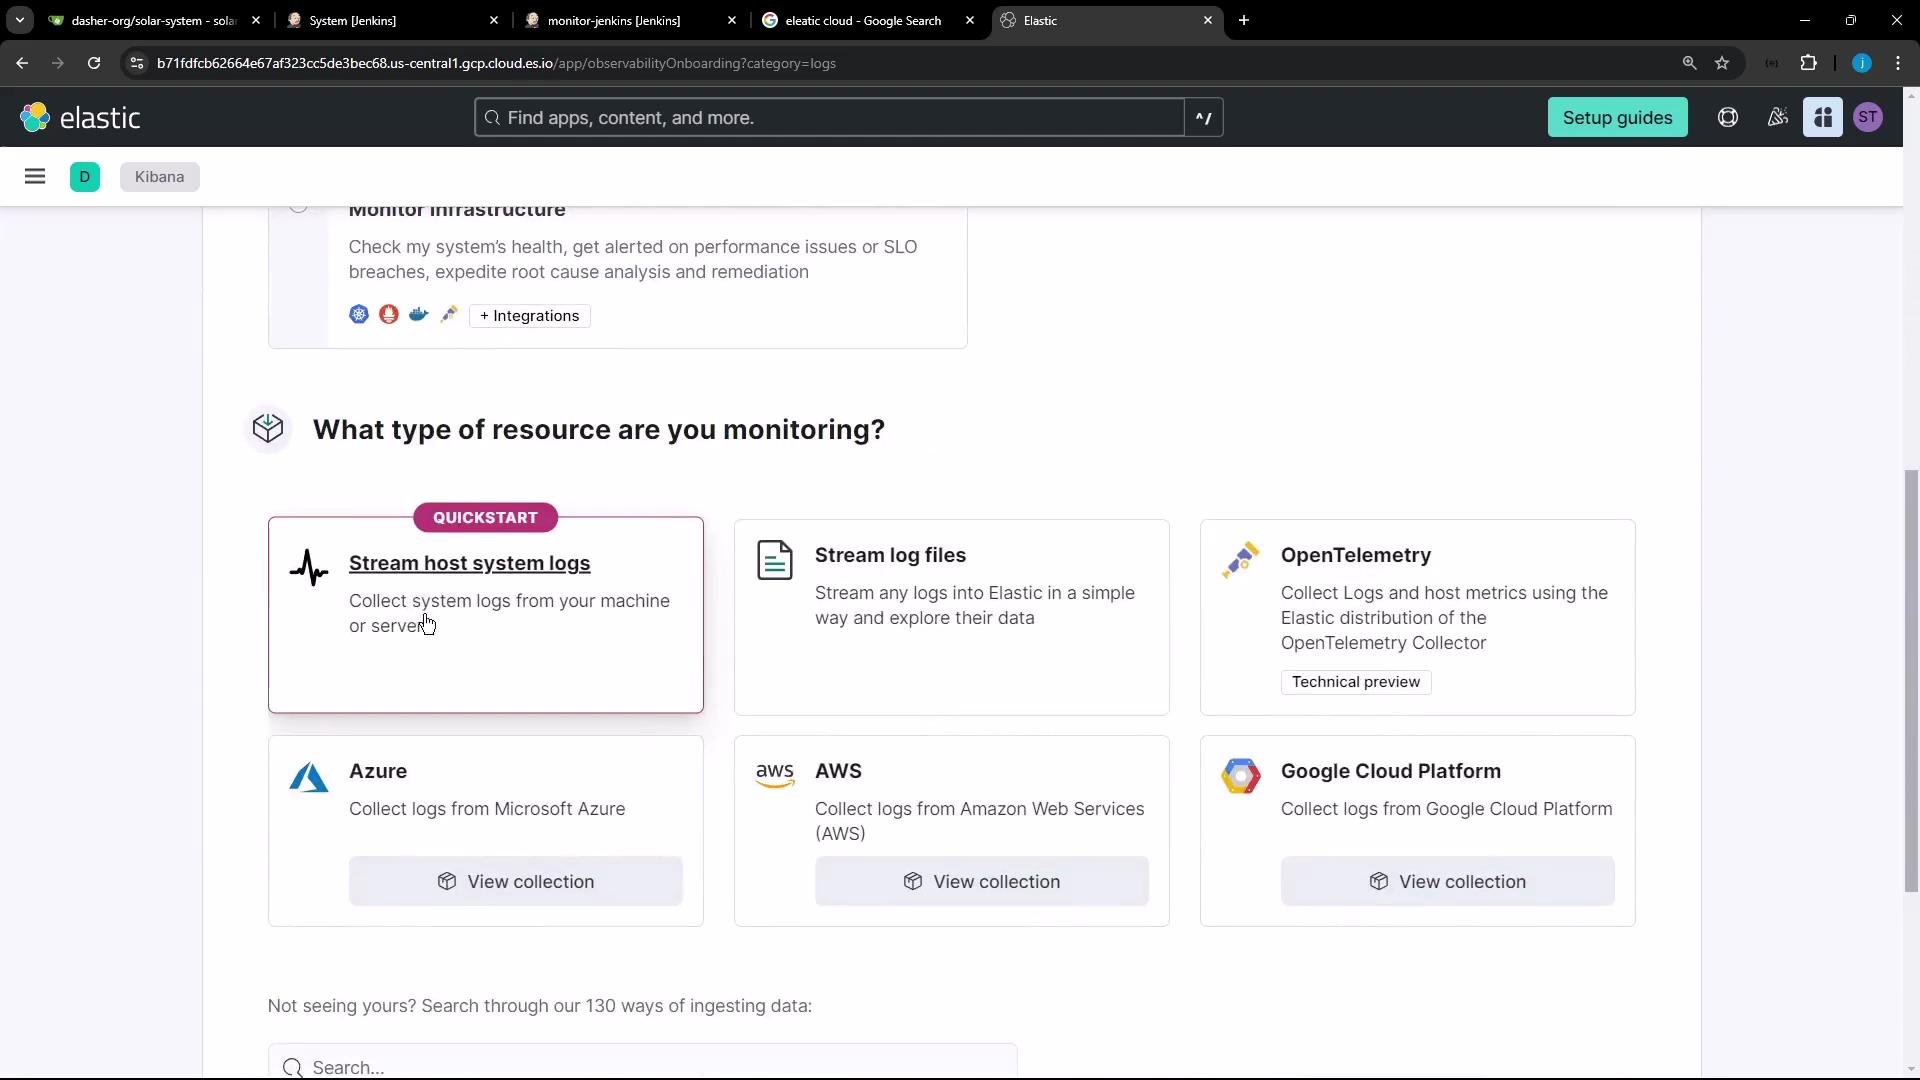 Example onboarding command (replace the API key and onboarding URL with the values provided):
```bash theme={null}
curl https://artifacts.elastic.co/downloads/beats/elastic-agent/standalone_agent_setup.sh -o standalone_agent_setup.sh \
&& sudo bash standalone_agent_setup.sh '' 'https://' 8.15.3 ''
```
Keep your onboarding API key secret. Do not check it into source control or share it publicly. Use the exact API key and onboarding endpoint provided by your Elastic Cloud Observability onboarding page.
When you run the script it will download and install the Elastic Agent, enroll it with your Elastic Cloud instance, and write a base configuration file to `/opt/Elastic/Agent/elastic-agent.yml`.
Typical condensed output:
```text theme={null}
Downloading Elastic Agent archive...
Elastic Agent successfully installed, starting enrollment.
Checking Elastic Agent status
Elastic Agent running (id: 45023cea-1f89-4b06-b5e6-32a749038edd)
Download and save configuration to /opt/Elastic/Agent/elastic-agent.yml
Done with standalone Elastic Agent setup. Make sure to add your configuration to /opt/Elastic/Agent/elastic-agent.yml, then look for streaming logs to arrive in Kibana
```
## 2. Confirm Jenkins Audit Trail files exist
Before configuring the agent, confirm the Audit Trail plugin writes logs somewhere accessible to the agent. Common location:
```bash theme={null}
ls -l /var/log/jenkins
```
Example output:
```text theme={null}
total 12
drwxr-xr-x 2 jenkins jenkins 4096 Nov 10 14:30 ./
drwxrwxr-x 10 root syslog 4096 Nov 10 00:00 ../
-rw-r--r-- 1 jenkins jenkins 526 Nov 10 14:30 custom-audit-0.log-2024-11-10
-rw-r--r-- 1 jenkins jenkins 0 Nov 10 14:30 custom-audit-0.log-2024-11-10.lck
```
Sample audit log lines:
```text theme={null}
Nov 10, 2024 2:29:30,662 PM/job/monitor-jenkins/configSubmit by siddharth from 124.123.186.17
Nov 10, 2024 2:29:34,672 PM job/monitor-jenkins/#29 Started by user siddharth, Parameters:[]
Nov 10, 2024 2:29:39,049 PM monitor-jenkins #29 Started by user siddharth, Parameters:[] on node #unknown# started at 2024-11-10T14:29:34Z completed in 4361ms completed: SUCCESS
Nov 10, 2024 2:30:45,042 PM /manage/configSubmit by siddharth from 124.123.186.17
```
## 3. Review the onboarding configuration
The onboarding script writes a base `elastic-agent.yml`. Important sections:
* `outputs` — where the agent sends data (Elasticsearch cluster and API key).
* `inputs` — what log files to collect.
Representative snippet (from onboarding):
```yaml theme={null}
outputs:
default:
type: elasticsearch
hosts:
- 'https://your-cluster.us-central1.gcp.cloud.es.io:443'
api_key: 'REPLACE_WITH_YOUR_API_KEY'
inputs:
- id: system-logs-...
type: logfile
data_stream:
namespace: default
streams:
- id: logfile-system.auth-...
data_stream:
dataset: system.auth
type: logs
paths:
- /var/log/auth.log*
- /var/log/secure*
exclude_files:
- .gz$
multiline:
pattern: '^\\s'
match: after
tags:
- system-auth
```
You will add a logfile input for the Jenkins Audit Trail files under the `inputs:` list.
## 4. Add a logfile input for Jenkins Audit Trail
Edit `/opt/Elastic/Agent/elastic-agent.yml` and add a logfile input that targets the Audit Trail files. Use wildcards to capture rotated files and include `multiline` only if entries span multiple lines.
Minimal example to add under `inputs:`:
```yaml theme={null}
- id: jenkins-audit-logs
type: logfile
data_stream:
namespace: default
streams:
- id: logfile-jenkins-audit
data_stream:
dataset: jenkins.audit
type: logs
paths:
- /var/log/jenkins/custom*.log*
exclude_files:
- .gz$
multiline:
# If your logs include continuation lines, match lines starting with whitespace as a continuation
pattern: '^\\s'
match: after
tags:
- jenkins-audit
```
Key considerations:
* Use `paths` with a wildcard (`custom*.log*`) to include rotated logs.
* Only enable `multiline` if log entries span multiple lines; the `pattern: '^\\s'` + `match: after` treats indented lines as continuations.
* Select a clear `dataset` (e.g., `jenkins.audit`) so logs are organized correctly in Elastic.
## 5. Restart the Elastic Agent
After saving `elastic-agent.yml`, restart the agent so it applies the new configuration:
```bash theme={null}
sudo systemctl restart elastic-agent
sudo systemctl status elastic-agent --no-pager
```
Or, if the CLI is available:
```bash theme={null}
sudo elastic-agent status
```
Give it a minute to start shipping logs.
## 6. Verify logs in Kibana / Elastic Cloud
Open Kibana → Observability → Logs (or Discover). Look for events with the dataset you configured (for example `jenkins.audit`) and inspect parsed fields.
If parsing or ingest issues occur, check:
* Agent logs on host: `/var/log/elastic-agent/` or `journalctl -u elastic-agent`.
* That the `paths:` you configured match actual files and permissions allow the agent to read them.
* The ingest pipeline used by Elastic for your dataset; default pipelines may expect a different timestamp/format.
## Troubleshooting
| Symptom | Likely cause | Action |
| ----------------------------------------------------- | ------------------------------------------------------: | -------------------------------------------------------------------------------------------------- |
| No logs appear in Kibana | Agent not reading the correct files or lacks permission | Check `paths` and file permissions; inspect agent logs (`/var/log/elastic-agent/` or `journalctl`) |
| Grok/ingest parsing errors | Default ingest pipeline doesn't match log format | Adjust ingest pipeline in Elastic or add processors in `elastic-agent.yml` to pre-process lines |
| Only current file is collected (rotated logs missing) | `paths` did not include rotated filenames | Use wildcards like `custom*.log*` to include rotated files |
Example parsing error you might see:
```text theme={null}
Provided Grok expressions do not match field value: [Nov 10, 2024 3:33:43,556 PM]job/monitor-jenkins/ #35 Started by user siddharth, Parameters:[]
```
This indicates the pipeline expects a different timestamp or layout. Either modify the ingest pipeline or add a `grok` processor in the agent configuration to normalize the fields.
Make sure to use the exact API key and onboarding endpoint provided by your Elastic Cloud Observability onboarding page. After editing `elastic-agent.yml`, always restart the Elastic Agent so it reloads the configuration.
## Summary checklist
| Step | Command / Path | Notes |
| ------------------------ | ----------------------------------------------------------------------- | ------------------------------------------------------------- |
| Get onboarding command | N/A (Elastic Cloud UI) | Use the Observability → Collect and analyze logs flow |
| Install agent | `bash standalone_agent_setup.sh '' 'https://' ...` | Use the exact API key/onboarding URL from the UI |
| Confirm audit logs exist | `ls -l /var/log/jenkins` | Confirm file names and rotation pattern |
| Configure agent | Edit `/opt/Elastic/Agent/elastic-agent.yml` | Add logfile input pointing to `/var/log/jenkins/custom*.log*` |
| Restart agent | `sudo systemctl restart elastic-agent` | Check status and agent logs |
| Verify in Kibana | Kibana → Observability → Logs | Look for `dataset: jenkins.audit` or your chosen dataset |
That’s it — once the agent is reading the audit files and sending events to your Elastic Cloud cluster, you can build Discover queries, dashboards, or alerts based on the `jenkins.audit` dataset.
Example onboarding command (replace the API key and onboarding URL with the values provided):
```bash theme={null}
curl https://artifacts.elastic.co/downloads/beats/elastic-agent/standalone_agent_setup.sh -o standalone_agent_setup.sh \
&& sudo bash standalone_agent_setup.sh '' 'https://' 8.15.3 ''
```
Keep your onboarding API key secret. Do not check it into source control or share it publicly. Use the exact API key and onboarding endpoint provided by your Elastic Cloud Observability onboarding page.
When you run the script it will download and install the Elastic Agent, enroll it with your Elastic Cloud instance, and write a base configuration file to `/opt/Elastic/Agent/elastic-agent.yml`.
Typical condensed output:
```text theme={null}
Downloading Elastic Agent archive...
Elastic Agent successfully installed, starting enrollment.
Checking Elastic Agent status
Elastic Agent running (id: 45023cea-1f89-4b06-b5e6-32a749038edd)
Download and save configuration to /opt/Elastic/Agent/elastic-agent.yml
Done with standalone Elastic Agent setup. Make sure to add your configuration to /opt/Elastic/Agent/elastic-agent.yml, then look for streaming logs to arrive in Kibana
```
## 2. Confirm Jenkins Audit Trail files exist
Before configuring the agent, confirm the Audit Trail plugin writes logs somewhere accessible to the agent. Common location:
```bash theme={null}
ls -l /var/log/jenkins
```
Example output:
```text theme={null}
total 12
drwxr-xr-x 2 jenkins jenkins 4096 Nov 10 14:30 ./
drwxrwxr-x 10 root syslog 4096 Nov 10 00:00 ../
-rw-r--r-- 1 jenkins jenkins 526 Nov 10 14:30 custom-audit-0.log-2024-11-10
-rw-r--r-- 1 jenkins jenkins 0 Nov 10 14:30 custom-audit-0.log-2024-11-10.lck
```
Sample audit log lines:
```text theme={null}
Nov 10, 2024 2:29:30,662 PM/job/monitor-jenkins/configSubmit by siddharth from 124.123.186.17
Nov 10, 2024 2:29:34,672 PM job/monitor-jenkins/#29 Started by user siddharth, Parameters:[]
Nov 10, 2024 2:29:39,049 PM monitor-jenkins #29 Started by user siddharth, Parameters:[] on node #unknown# started at 2024-11-10T14:29:34Z completed in 4361ms completed: SUCCESS
Nov 10, 2024 2:30:45,042 PM /manage/configSubmit by siddharth from 124.123.186.17
```
## 3. Review the onboarding configuration
The onboarding script writes a base `elastic-agent.yml`. Important sections:
* `outputs` — where the agent sends data (Elasticsearch cluster and API key).
* `inputs` — what log files to collect.
Representative snippet (from onboarding):
```yaml theme={null}
outputs:
default:
type: elasticsearch
hosts:
- 'https://your-cluster.us-central1.gcp.cloud.es.io:443'
api_key: 'REPLACE_WITH_YOUR_API_KEY'
inputs:
- id: system-logs-...
type: logfile
data_stream:
namespace: default
streams:
- id: logfile-system.auth-...
data_stream:
dataset: system.auth
type: logs
paths:
- /var/log/auth.log*
- /var/log/secure*
exclude_files:
- .gz$
multiline:
pattern: '^\\s'
match: after
tags:
- system-auth
```
You will add a logfile input for the Jenkins Audit Trail files under the `inputs:` list.
## 4. Add a logfile input for Jenkins Audit Trail
Edit `/opt/Elastic/Agent/elastic-agent.yml` and add a logfile input that targets the Audit Trail files. Use wildcards to capture rotated files and include `multiline` only if entries span multiple lines.
Minimal example to add under `inputs:`:
```yaml theme={null}
- id: jenkins-audit-logs
type: logfile
data_stream:
namespace: default
streams:
- id: logfile-jenkins-audit
data_stream:
dataset: jenkins.audit
type: logs
paths:
- /var/log/jenkins/custom*.log*
exclude_files:
- .gz$
multiline:
# If your logs include continuation lines, match lines starting with whitespace as a continuation
pattern: '^\\s'
match: after
tags:
- jenkins-audit
```
Key considerations:
* Use `paths` with a wildcard (`custom*.log*`) to include rotated logs.
* Only enable `multiline` if log entries span multiple lines; the `pattern: '^\\s'` + `match: after` treats indented lines as continuations.
* Select a clear `dataset` (e.g., `jenkins.audit`) so logs are organized correctly in Elastic.
## 5. Restart the Elastic Agent
After saving `elastic-agent.yml`, restart the agent so it applies the new configuration:
```bash theme={null}
sudo systemctl restart elastic-agent
sudo systemctl status elastic-agent --no-pager
```
Or, if the CLI is available:
```bash theme={null}
sudo elastic-agent status
```
Give it a minute to start shipping logs.
## 6. Verify logs in Kibana / Elastic Cloud
Open Kibana → Observability → Logs (or Discover). Look for events with the dataset you configured (for example `jenkins.audit`) and inspect parsed fields.
If parsing or ingest issues occur, check:
* Agent logs on host: `/var/log/elastic-agent/` or `journalctl -u elastic-agent`.
* That the `paths:` you configured match actual files and permissions allow the agent to read them.
* The ingest pipeline used by Elastic for your dataset; default pipelines may expect a different timestamp/format.
## Troubleshooting
| Symptom | Likely cause | Action |
| ----------------------------------------------------- | ------------------------------------------------------: | -------------------------------------------------------------------------------------------------- |
| No logs appear in Kibana | Agent not reading the correct files or lacks permission | Check `paths` and file permissions; inspect agent logs (`/var/log/elastic-agent/` or `journalctl`) |
| Grok/ingest parsing errors | Default ingest pipeline doesn't match log format | Adjust ingest pipeline in Elastic or add processors in `elastic-agent.yml` to pre-process lines |
| Only current file is collected (rotated logs missing) | `paths` did not include rotated filenames | Use wildcards like `custom*.log*` to include rotated files |
Example parsing error you might see:
```text theme={null}
Provided Grok expressions do not match field value: [Nov 10, 2024 3:33:43,556 PM]job/monitor-jenkins/ #35 Started by user siddharth, Parameters:[]
```
This indicates the pipeline expects a different timestamp or layout. Either modify the ingest pipeline or add a `grok` processor in the agent configuration to normalize the fields.
Make sure to use the exact API key and onboarding endpoint provided by your Elastic Cloud Observability onboarding page. After editing `elastic-agent.yml`, always restart the Elastic Agent so it reloads the configuration.
## Summary checklist
| Step | Command / Path | Notes |
| ------------------------ | ----------------------------------------------------------------------- | ------------------------------------------------------------- |
| Get onboarding command | N/A (Elastic Cloud UI) | Use the Observability → Collect and analyze logs flow |
| Install agent | `bash standalone_agent_setup.sh '' 'https://' ...` | Use the exact API key/onboarding URL from the UI |
| Confirm audit logs exist | `ls -l /var/log/jenkins` | Confirm file names and rotation pattern |
| Configure agent | Edit `/opt/Elastic/Agent/elastic-agent.yml` | Add logfile input pointing to `/var/log/jenkins/custom*.log*` |
| Restart agent | `sudo systemctl restart elastic-agent` | Check status and agent logs |
| Verify in Kibana | Kibana → Observability → Logs | Look for `dataset: jenkins.audit` or your chosen dataset |
That’s it — once the agent is reading the audit files and sending events to your Elastic Cloud cluster, you can build Discover queries, dashboards, or alerts based on the `jenkins.audit` dataset.