> ## Documentation Index
> Fetch the complete documentation index at: https://notes.kodekloud.com/llms.txt
> Use this file to discover all available pages before exploring further.
# Install and Configure Audit Trail
> How to install and configure Jenkins Audit Trail plugin to record administrative and job actions, logging to files, syslog, or Elasticsearch with rotation and verification steps
This guide explains how to install and configure the Audit Trail plugin for Jenkins to capture an auditable record of administrative and job-related actions (for example, job configuration changes, system configuration updates, or job executions). Audit Trail can write logs to a local file (with rotation), send them to syslog, print to the Jenkins console, or forward events to an external [Elasticsearch](https://www.elastic.co/elasticsearch/) server.
Use Audit Trail to maintain an auditable record of administrative and job-related actions. Choose the logging destination that fits your operational and compliance requirements (local file, syslog, or [Elasticsearch](https://www.elastic.co/elasticsearch/)).
## Install the plugin
1. In Jenkins go to Manage Jenkins → Manage Plugins.
2. Install from the Available tab (or check Installed if you already have it).
3. After installation, open Manage Jenkins → Configure System and scroll to the Audit Trail section.
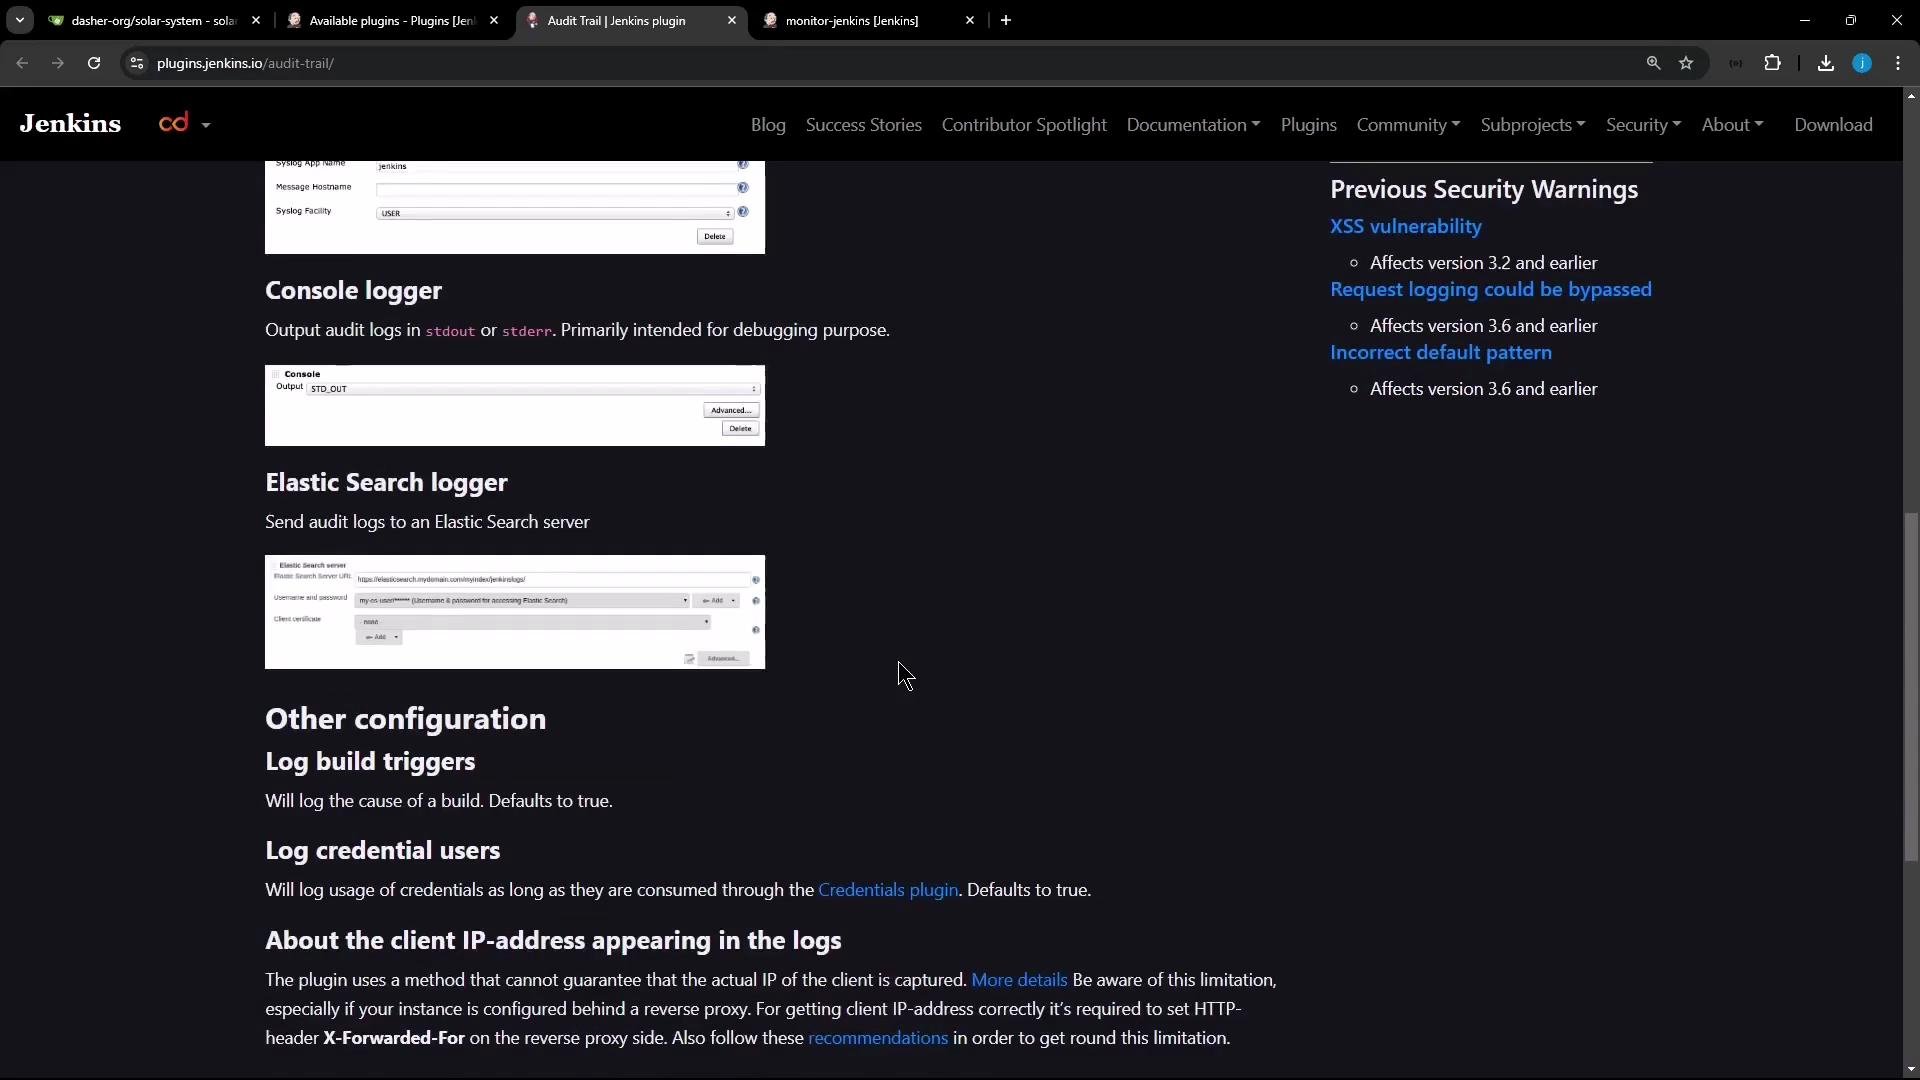
The plugin provides the following logger options:
| Logger type | Use case | Example / Notes |
| ------------------------- | ---------------------------------------------- | ------------------------------------------------ |
| Console logger | Quick debugging and local visibility | Prints events to the Jenkins log/console |
| Elasticsearch logger | Centralized indexing, search and visualization | Forward audit events to an Elasticsearch cluster |
| Syslog logger | Centralized system log collection | Send events to syslog for aggregation |
| Log file (daily rotation) | Local file retention with rotation | Use file pattern and rotation count |
 ## Configure Audit Trail (example: Log file with daily rotation)
This example configures Audit Trail to write rotated daily logs to `/var/log/jenkins/custom-audit-%g.log`.
1. Open Manage Jenkins → Configure System → Audit Trail.
2. Enable **Log file (daily rotation)**.
3. Set the log file name pattern. Use `%g` for rotated file numbering, for example:
```bash theme={null}
/var/log/jenkins/custom-audit-%g.log
```
4. Optionally set the number of rotated files to keep (`file count`).
5. Provide a regular expression to match Jenkins endpoints/actions you want to capture. Example:
```text theme={null}
.*/(?:configSubmit|doDelete|postBuildResult|enable|disable|cancelQueue|stop|toggleLogKeep|doWipeOutWorkspace|createItem|createView|toggleOffline|cancelQuietDown|quietDown|restart|exit)
```
The pattern above captures common administrative and job actions such as configuration submissions, deletes, enabling/disabling items, stopping builds, creating jobs/views, and restarting or shutting down Jenkins.
After saving, Audit Trail will begin writing events to the configured file(s), using the rotation and retention settings you specified.
Ensure the Jenkins process has write permissions to the configured log directory (for example `/var/log/jenkins`). On systems with SELinux or custom permissions, you may need to adjust policies or folder ownership (`chown jenkins:jenkins /var/log/jenkins`) to allow logging.
## Test and verify logging
To verify the configuration:
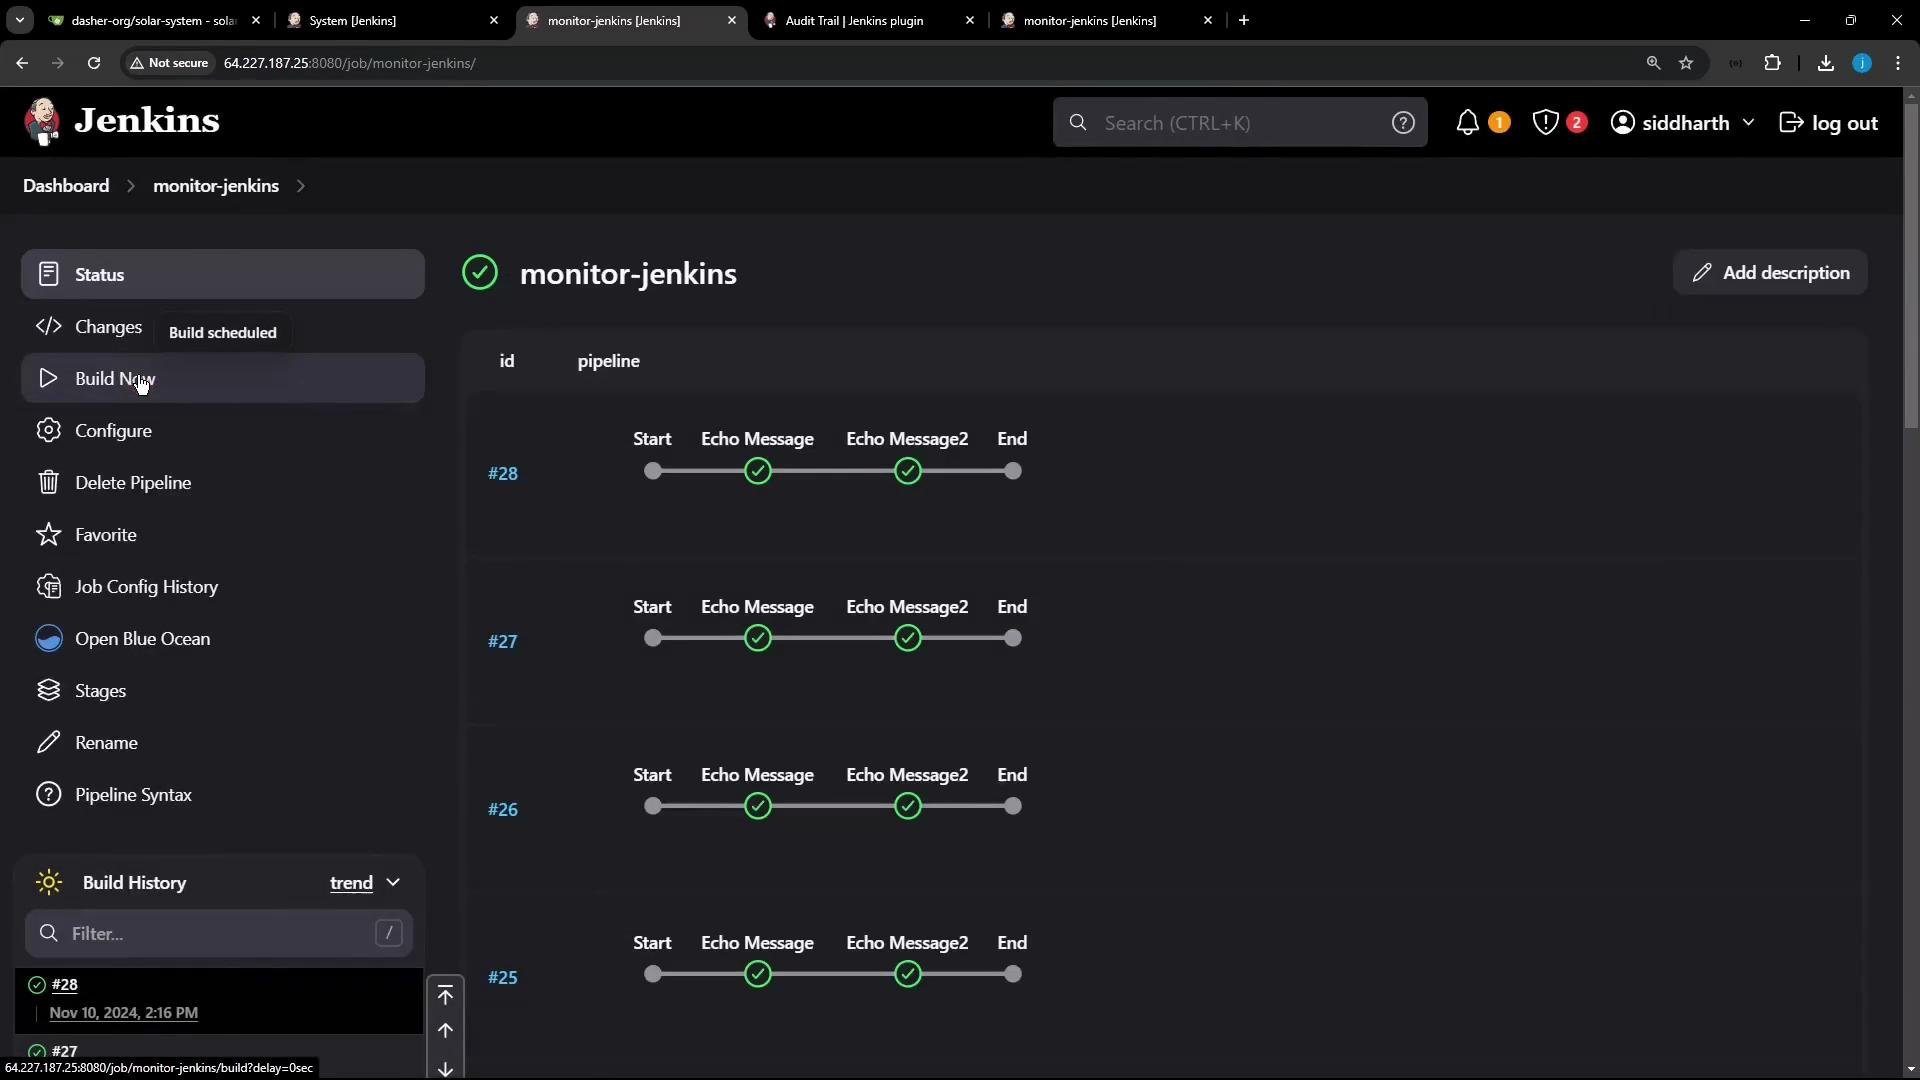
1. Make a small change to a job (for example, update a step that echoes messages).
2. Trigger a build for that job.
3. Check the log directory for the rotated audit files.
Example: a pipeline job named `monitor-jenkins` is modified and a build is triggered.
## Configure Audit Trail (example: Log file with daily rotation)
This example configures Audit Trail to write rotated daily logs to `/var/log/jenkins/custom-audit-%g.log`.
1. Open Manage Jenkins → Configure System → Audit Trail.
2. Enable **Log file (daily rotation)**.
3. Set the log file name pattern. Use `%g` for rotated file numbering, for example:
```bash theme={null}
/var/log/jenkins/custom-audit-%g.log
```
4. Optionally set the number of rotated files to keep (`file count`).
5. Provide a regular expression to match Jenkins endpoints/actions you want to capture. Example:
```text theme={null}
.*/(?:configSubmit|doDelete|postBuildResult|enable|disable|cancelQueue|stop|toggleLogKeep|doWipeOutWorkspace|createItem|createView|toggleOffline|cancelQuietDown|quietDown|restart|exit)
```
The pattern above captures common administrative and job actions such as configuration submissions, deletes, enabling/disabling items, stopping builds, creating jobs/views, and restarting or shutting down Jenkins.
After saving, Audit Trail will begin writing events to the configured file(s), using the rotation and retention settings you specified.
Ensure the Jenkins process has write permissions to the configured log directory (for example `/var/log/jenkins`). On systems with SELinux or custom permissions, you may need to adjust policies or folder ownership (`chown jenkins:jenkins /var/log/jenkins`) to allow logging.
## Test and verify logging
To verify the configuration:
1. Make a small change to a job (for example, update a step that echoes messages).
2. Trigger a build for that job.
3. Check the log directory for the rotated audit files.
Example: a pipeline job named `monitor-jenkins` is modified and a build is triggered.
 Example shell session showing the log files and recent logged events:
```bash theme={null}
root@jenkins-controller-1:/var/log/jenkins# ls -l
total 12
drwxr-xr-x 2 jenkins jenkins 4096 Nov 10 14:30 ./
drwxrwxr-x 10 root syslog 4096 Nov 10 00:00 ../
-rw-r--r-- 1 jenkins jenkins 526 Nov 10 14:30 custom-audit-0.log-2024-11-10
-rw-r--r-- 1 jenkins jenkins 0 Nov 10 14:30 custom-audit-0.log-2024-11-10.lck
```
Inspect the contents of the audit log:
```bash theme={null}
root@jenkins-controller-1:/var/log/jenkins# cat custom-audit-0.log-2024-11-10
Nov 10, 2024 2:29:30,662 PM /job/monitor-jenkins/configSubmit by siddharth from 124.123.186.17
Nov 10, 2024 2:29:34,672 PM /job/monitor-jenkins/ #29 Started by user siddharth, Parameters:[]
Nov 10, 2024 2:29:39,049 PM /job/monitor-jenkins/ #29 Completed by user siddharth on node #unknown# started at 2024-11-10T14:29:34Z completed in 4361ms completed: SUCCESS
Nov 10, 2024 2:30:45,042 PM /manage/configSubmit by siddharth from 124.123.186.17
Nov 10, 2024 2:30:50,232 PM /manage/configSubmit by siddharth from 124.123.186.17
```
Interpretation of these log entries:
* The first line shows a configuration submission for the job `monitor-jenkins` by user `siddharth` from IP `124.123.186.17`.
* The next lines show job #29 being started and then completed successfully, with timestamps and node information.
* Subsequent entries show Manage Jenkins configuration changes.
## Adapting Audit Trail to your environment
* Syslog: Forward events to your centralized syslog collector for aggregation and retention.
* Elasticsearch: Send events to an Elasticsearch cluster for indexing, search, and visualization (useful with Kibana).
* Local files: Use rotated files for local retention and offline audits.
Useful links and references:
* [Audit Trail Plugin (Jenkins)](https://plugins.jenkins.io/audit-trail/)
* [Elasticsearch](https://www.elastic.co/elasticsearch/)
* [Jenkins Configuration as Code](https://www.jenkins.io/projects/jcasc/) — consider automating Audit Trail configuration
You have now installed the Audit Trail plugin, configured it for daily log rotation to `/var/log/jenkins/custom-audit-%g.log`, and verified that configuration changes and job executions are recorded.
Example shell session showing the log files and recent logged events:
```bash theme={null}
root@jenkins-controller-1:/var/log/jenkins# ls -l
total 12
drwxr-xr-x 2 jenkins jenkins 4096 Nov 10 14:30 ./
drwxrwxr-x 10 root syslog 4096 Nov 10 00:00 ../
-rw-r--r-- 1 jenkins jenkins 526 Nov 10 14:30 custom-audit-0.log-2024-11-10
-rw-r--r-- 1 jenkins jenkins 0 Nov 10 14:30 custom-audit-0.log-2024-11-10.lck
```
Inspect the contents of the audit log:
```bash theme={null}
root@jenkins-controller-1:/var/log/jenkins# cat custom-audit-0.log-2024-11-10
Nov 10, 2024 2:29:30,662 PM /job/monitor-jenkins/configSubmit by siddharth from 124.123.186.17
Nov 10, 2024 2:29:34,672 PM /job/monitor-jenkins/ #29 Started by user siddharth, Parameters:[]
Nov 10, 2024 2:29:39,049 PM /job/monitor-jenkins/ #29 Completed by user siddharth on node #unknown# started at 2024-11-10T14:29:34Z completed in 4361ms completed: SUCCESS
Nov 10, 2024 2:30:45,042 PM /manage/configSubmit by siddharth from 124.123.186.17
Nov 10, 2024 2:30:50,232 PM /manage/configSubmit by siddharth from 124.123.186.17
```
Interpretation of these log entries:
* The first line shows a configuration submission for the job `monitor-jenkins` by user `siddharth` from IP `124.123.186.17`.
* The next lines show job #29 being started and then completed successfully, with timestamps and node information.
* Subsequent entries show Manage Jenkins configuration changes.
## Adapting Audit Trail to your environment
* Syslog: Forward events to your centralized syslog collector for aggregation and retention.
* Elasticsearch: Send events to an Elasticsearch cluster for indexing, search, and visualization (useful with Kibana).
* Local files: Use rotated files for local retention and offline audits.
Useful links and references:
* [Audit Trail Plugin (Jenkins)](https://plugins.jenkins.io/audit-trail/)
* [Elasticsearch](https://www.elastic.co/elasticsearch/)
* [Jenkins Configuration as Code](https://www.jenkins.io/projects/jcasc/) — consider automating Audit Trail configuration
You have now installed the Audit Trail plugin, configured it for daily log rotation to `/var/log/jenkins/custom-audit-%g.log`, and verified that configuration changes and job executions are recorded.