> ## Documentation Index
> Fetch the complete documentation index at: https://notes.kodekloud.com/llms.txt
> Use this file to discover all available pages before exploring further.
# Jenkins Supervision
> Guide to supervising Jenkins using centralized logs, performance monitoring, and auditing to maintain CI CD pipeline reliability, capacity, and secure configuration change tracking
Effective Jenkins supervision is essential for reliable CI/CD. Proactive monitoring of Jenkins helps you detect system errors, plugin failures, and pipeline issues before they disrupt builds or deployments. This guide explains how to collect and analyze Jenkins logs, monitor performance and capacity, and audit configuration and user activity to keep your delivery pipeline healthy and secure.
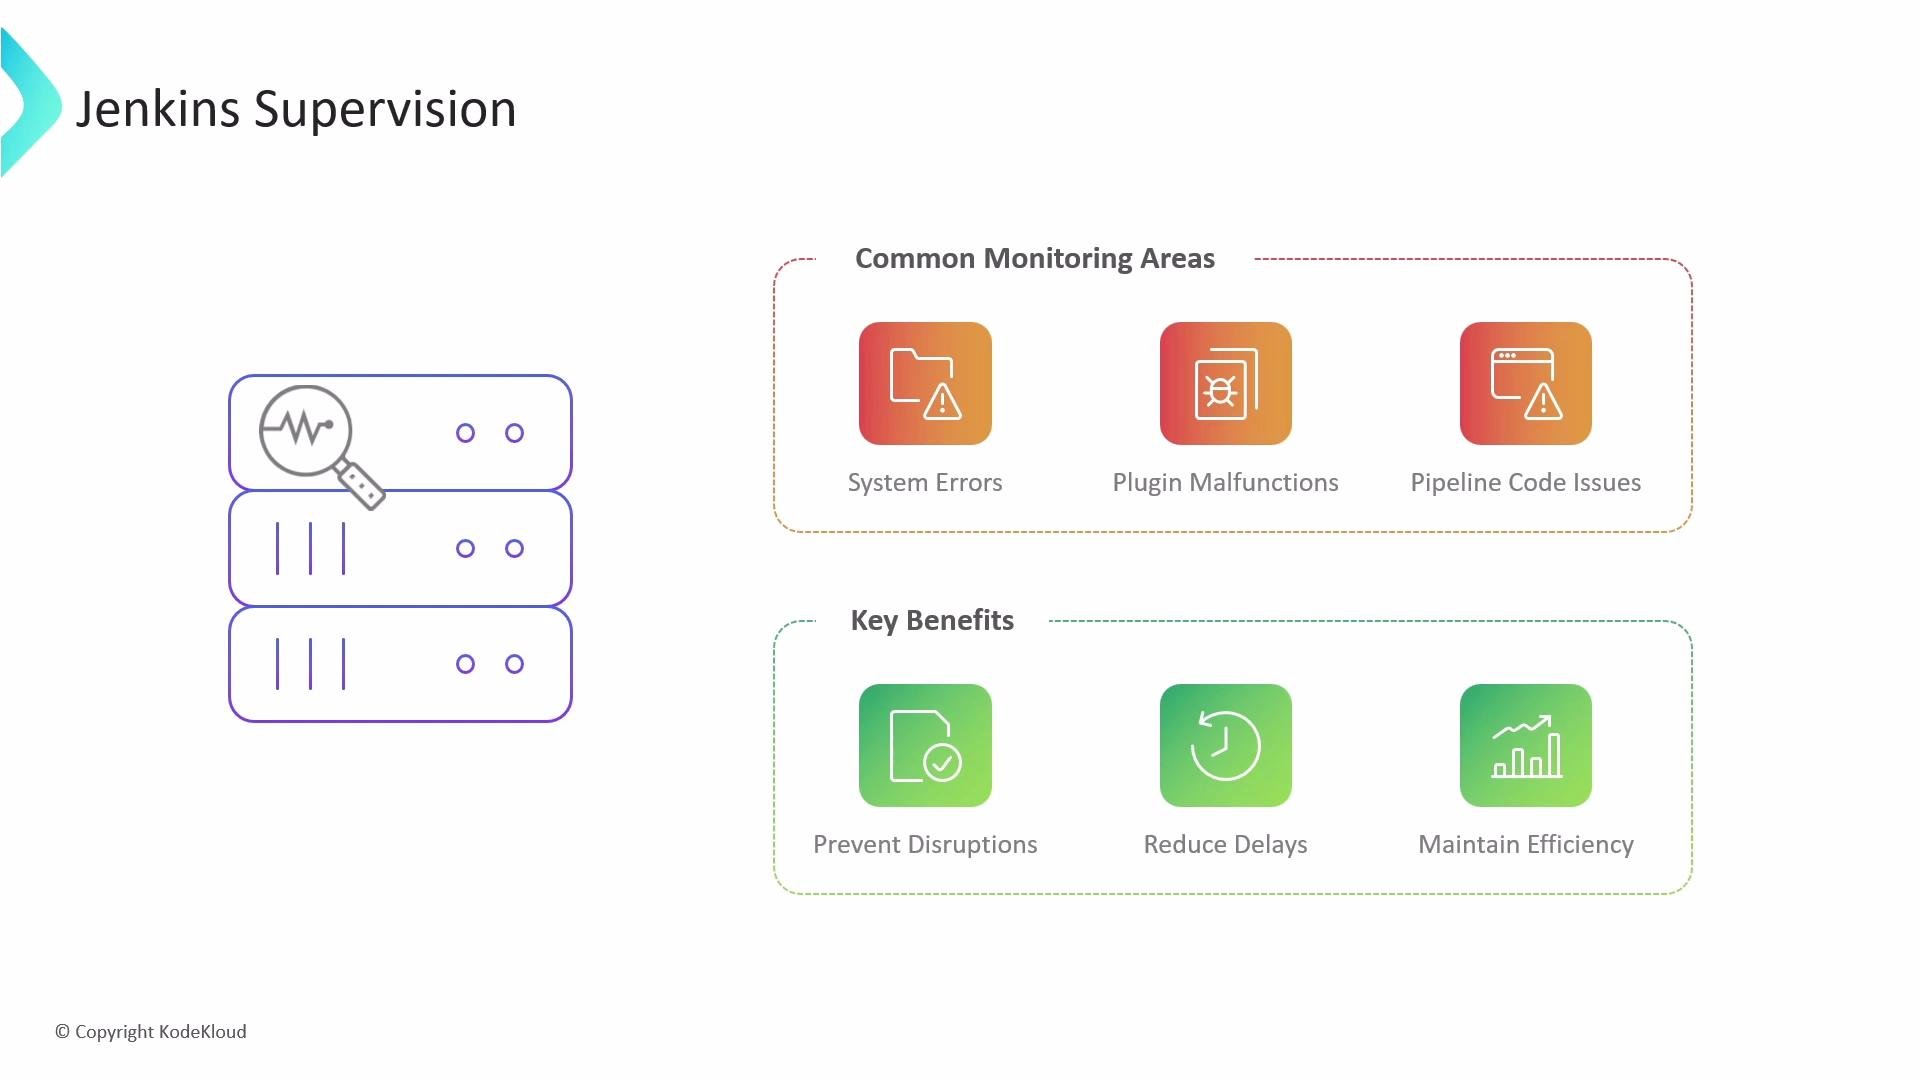 In this article we cover three practical areas of Jenkins supervision:
* How logs provide visibility into Jenkins activity.
* Tools and techniques to monitor Jenkins performance and resource usage.
* Methods for auditing user activity and tracking configuration changes.
## Logs: the primary telemetry
Logs are the first place to investigate when troubleshooting Jenkins. They reveal build failures, plugin stack traces, JVM errors, and operational events. Where and how you collect logs depends on how Jenkins is deployed.
Common log locations and commands:
* Running the WAR directly:
```bash theme={null}
java -jar jenkins.war
```
Logs are written to the process stdout by default.
* Package installs (Linux):
* Debian/Ubuntu: logs typically live in `/var/log/jenkins` (for example `/var/log/jenkins/jenkins.log`). Configure startup options in `/etc/default/jenkins`.
* RHEL/CentOS: check `/var/log/jenkins` and `/etc/sysconfig/jenkins` for environment overrides.
* Windows service installs:
* Logs often live under `%JENKINS_HOME%` or are configured in the `jenkins.xml` service wrapper.
* Docker containers:
```bash theme={null}
docker logs
```
* In-UI access:
* Manage Jenkins → System Log provides quick, browser-based log inspection: [https://www.jenkins.io/doc/book/managing/system-log/](https://www.jenkins.io/doc/book/managing/system-log/)
Tips for log collection:
* Centralize logs to enable search, retention, and correlation (syslog, ELK/Elasticsearch, Datadog).
* Capture both Jenkins system logs and agent/node logs (executors, workspaces).
* Include JVM metrics (GC logs, heap usage) alongside application logs for root-cause analysis.
## Monitoring Jenkins health and load
Jenkins exposes built-in views (Load Statistics, Manage Jenkins dashboards) to measure capacity and queue behavior. Track these primary metrics:
* Available executors — idle capacity to run builds.
* Busy executors — currently running builds.
* Queue length — jobs waiting to start.
* Node health and JVM resource usage — CPU, memory, disk I/O.
Key plugins and integrations for observability:
| Plugin / Integration | Purpose | Link |
| ---------------------------------- | ------------------------------------------------------------------ | -------------------------------------------------------------------------------------------------------- |
| Monitoring plugin (JavaMelody) | JVM and application metrics (CPU, memory, response times, GC) | [https://plugins.jenkins.io/monitoring/](https://plugins.jenkins.io/monitoring/) |
| Disk Usage plugin | Analyze workspace and job storage usage and trends | [https://plugins.jenkins.io/disk-usage/](https://plugins.jenkins.io/disk-usage/) |
| Build Monitor (Build Monitor View) | Dashboard view highlighting job statuses and failures | [https://plugins.jenkins.io/build-monitor-plugin/](https://plugins.jenkins.io/build-monitor-plugin/) |
| Prometheus plugin | Exposes metrics in Prometheus format for scraping | [https://plugins.jenkins.io/prometheus/](https://plugins.jenkins.io/prometheus/) |
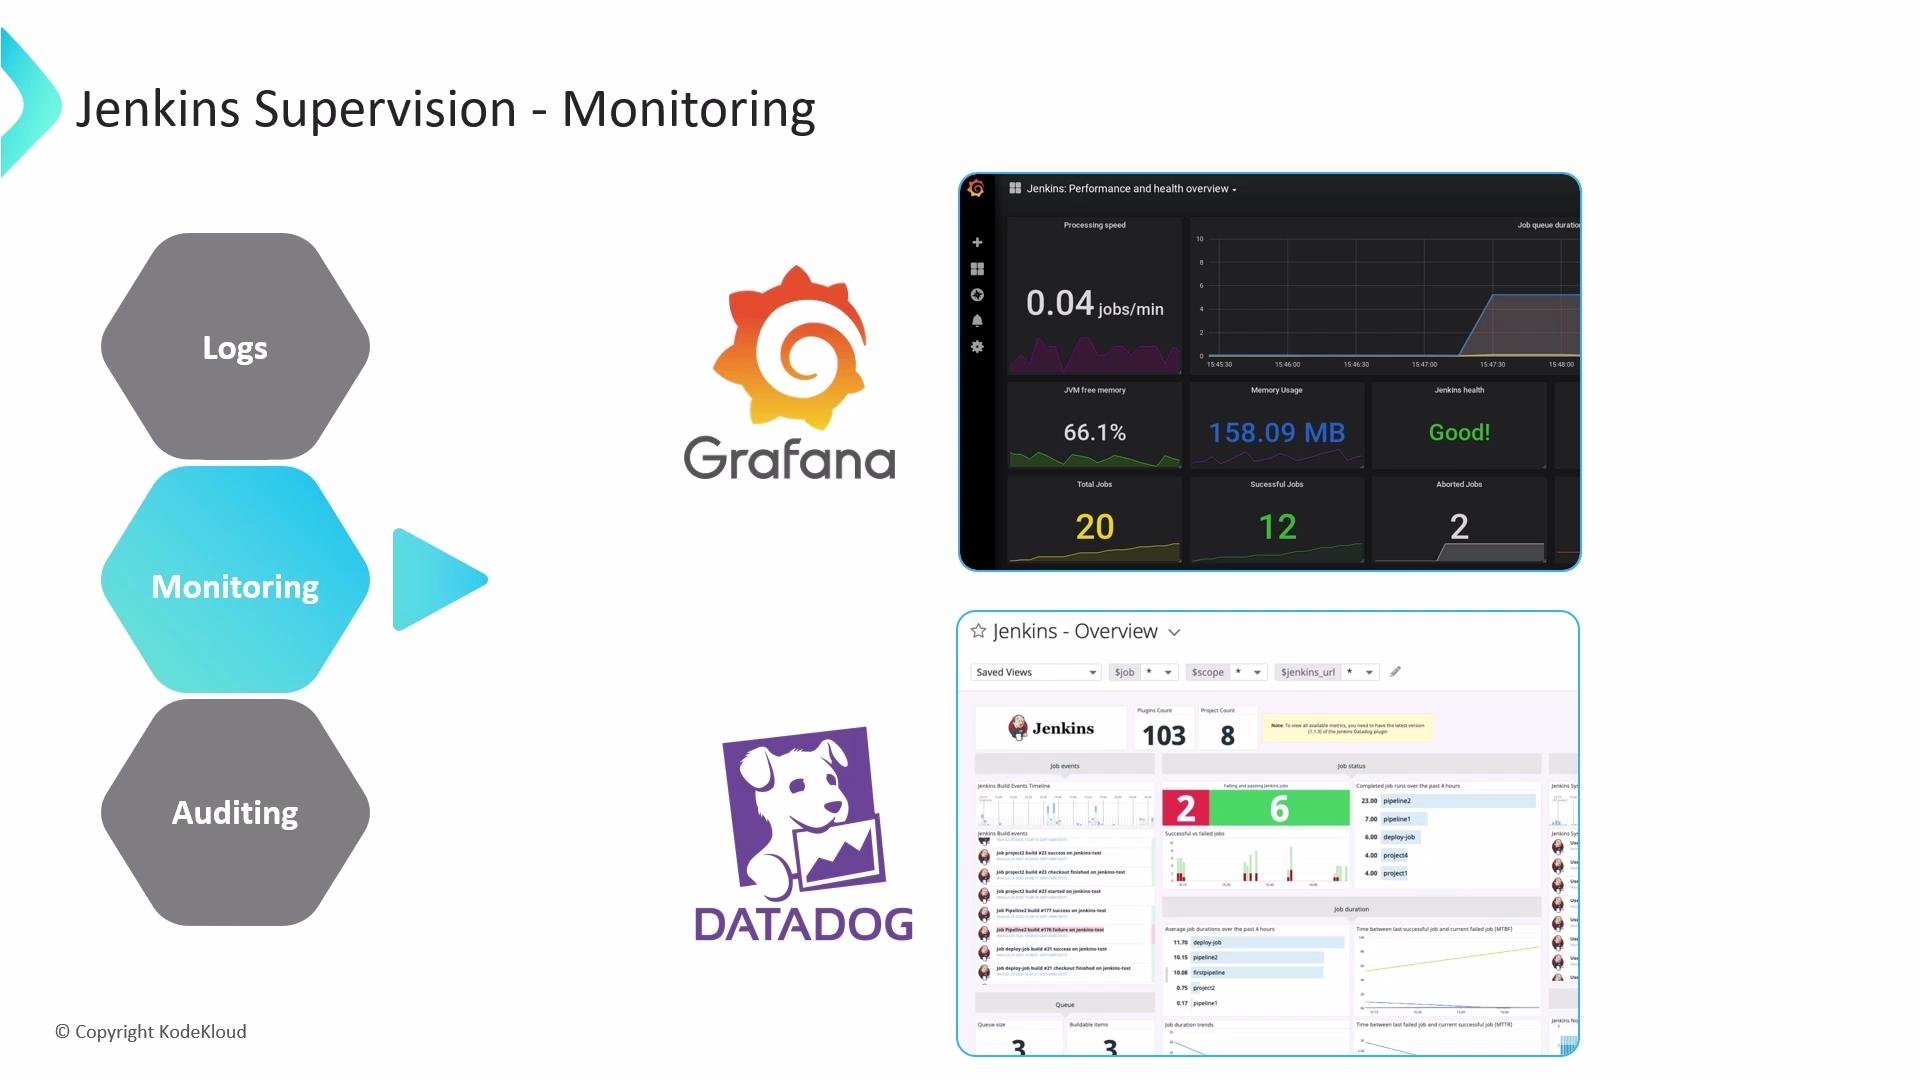
| Grafana | Visualize Prometheus metrics with custom dashboards | [https://grafana.com/](https://grafana.com/) |
| Datadog, New Relic | Forward metrics and traces to external APM/observability platforms | [https://www.datadoghq.com/](https://www.datadoghq.com/), [https://newrelic.com/](https://newrelic.com/) |
These integrations let you plug Jenkins into an existing observability stack for alerting, long-term retention, and team dashboards.
In this article we cover three practical areas of Jenkins supervision:
* How logs provide visibility into Jenkins activity.
* Tools and techniques to monitor Jenkins performance and resource usage.
* Methods for auditing user activity and tracking configuration changes.
## Logs: the primary telemetry
Logs are the first place to investigate when troubleshooting Jenkins. They reveal build failures, plugin stack traces, JVM errors, and operational events. Where and how you collect logs depends on how Jenkins is deployed.
Common log locations and commands:
* Running the WAR directly:
```bash theme={null}
java -jar jenkins.war
```
Logs are written to the process stdout by default.
* Package installs (Linux):
* Debian/Ubuntu: logs typically live in `/var/log/jenkins` (for example `/var/log/jenkins/jenkins.log`). Configure startup options in `/etc/default/jenkins`.
* RHEL/CentOS: check `/var/log/jenkins` and `/etc/sysconfig/jenkins` for environment overrides.
* Windows service installs:
* Logs often live under `%JENKINS_HOME%` or are configured in the `jenkins.xml` service wrapper.
* Docker containers:
```bash theme={null}
docker logs
```
* In-UI access:
* Manage Jenkins → System Log provides quick, browser-based log inspection: [https://www.jenkins.io/doc/book/managing/system-log/](https://www.jenkins.io/doc/book/managing/system-log/)
Tips for log collection:
* Centralize logs to enable search, retention, and correlation (syslog, ELK/Elasticsearch, Datadog).
* Capture both Jenkins system logs and agent/node logs (executors, workspaces).
* Include JVM metrics (GC logs, heap usage) alongside application logs for root-cause analysis.
## Monitoring Jenkins health and load
Jenkins exposes built-in views (Load Statistics, Manage Jenkins dashboards) to measure capacity and queue behavior. Track these primary metrics:
* Available executors — idle capacity to run builds.
* Busy executors — currently running builds.
* Queue length — jobs waiting to start.
* Node health and JVM resource usage — CPU, memory, disk I/O.
Key plugins and integrations for observability:
| Plugin / Integration | Purpose | Link |
| ---------------------------------- | ------------------------------------------------------------------ | -------------------------------------------------------------------------------------------------------- |
| Monitoring plugin (JavaMelody) | JVM and application metrics (CPU, memory, response times, GC) | [https://plugins.jenkins.io/monitoring/](https://plugins.jenkins.io/monitoring/) |
| Disk Usage plugin | Analyze workspace and job storage usage and trends | [https://plugins.jenkins.io/disk-usage/](https://plugins.jenkins.io/disk-usage/) |
| Build Monitor (Build Monitor View) | Dashboard view highlighting job statuses and failures | [https://plugins.jenkins.io/build-monitor-plugin/](https://plugins.jenkins.io/build-monitor-plugin/) |
| Prometheus plugin | Exposes metrics in Prometheus format for scraping | [https://plugins.jenkins.io/prometheus/](https://plugins.jenkins.io/prometheus/) |
| Grafana | Visualize Prometheus metrics with custom dashboards | [https://grafana.com/](https://grafana.com/) |
| Datadog, New Relic | Forward metrics and traces to external APM/observability platforms | [https://www.datadoghq.com/](https://www.datadoghq.com/), [https://newrelic.com/](https://newrelic.com/) |
These integrations let you plug Jenkins into an existing observability stack for alerting, long-term retention, and team dashboards.
 ## Auditing: who changed what, when
Auditing is critical for security and compliance. Jenkins admins typically need to answer: who changed a job or configuration, when, and what changed. Two complementary open-source plugins address these needs.
Audit Trail plugin
* Captures user actions and administrative events and writes audit records to configurable backends.
* Logger backends:
* File logger — rotating audit files on disk (default).
* Syslog logger — forwards events to a syslog server for centralization.
* Console logger — streams events to stdout (useful for debugging; not recommended in production).
* Elasticsearch / central-store integration — forward logs to Elasticsearch or other stores using collectors (Filebeat, Fluentd).
* Use the Audit Trail to build an immutable record of user actions and tie operational events to specific users.
## Auditing: who changed what, when
Auditing is critical for security and compliance. Jenkins admins typically need to answer: who changed a job or configuration, when, and what changed. Two complementary open-source plugins address these needs.
Audit Trail plugin
* Captures user actions and administrative events and writes audit records to configurable backends.
* Logger backends:
* File logger — rotating audit files on disk (default).
* Syslog logger — forwards events to a syslog server for centralization.
* Console logger — streams events to stdout (useful for debugging; not recommended in production).
* Elasticsearch / central-store integration — forward logs to Elasticsearch or other stores using collectors (Filebeat, Fluentd).
* Use the Audit Trail to build an immutable record of user actions and tie operational events to specific users.
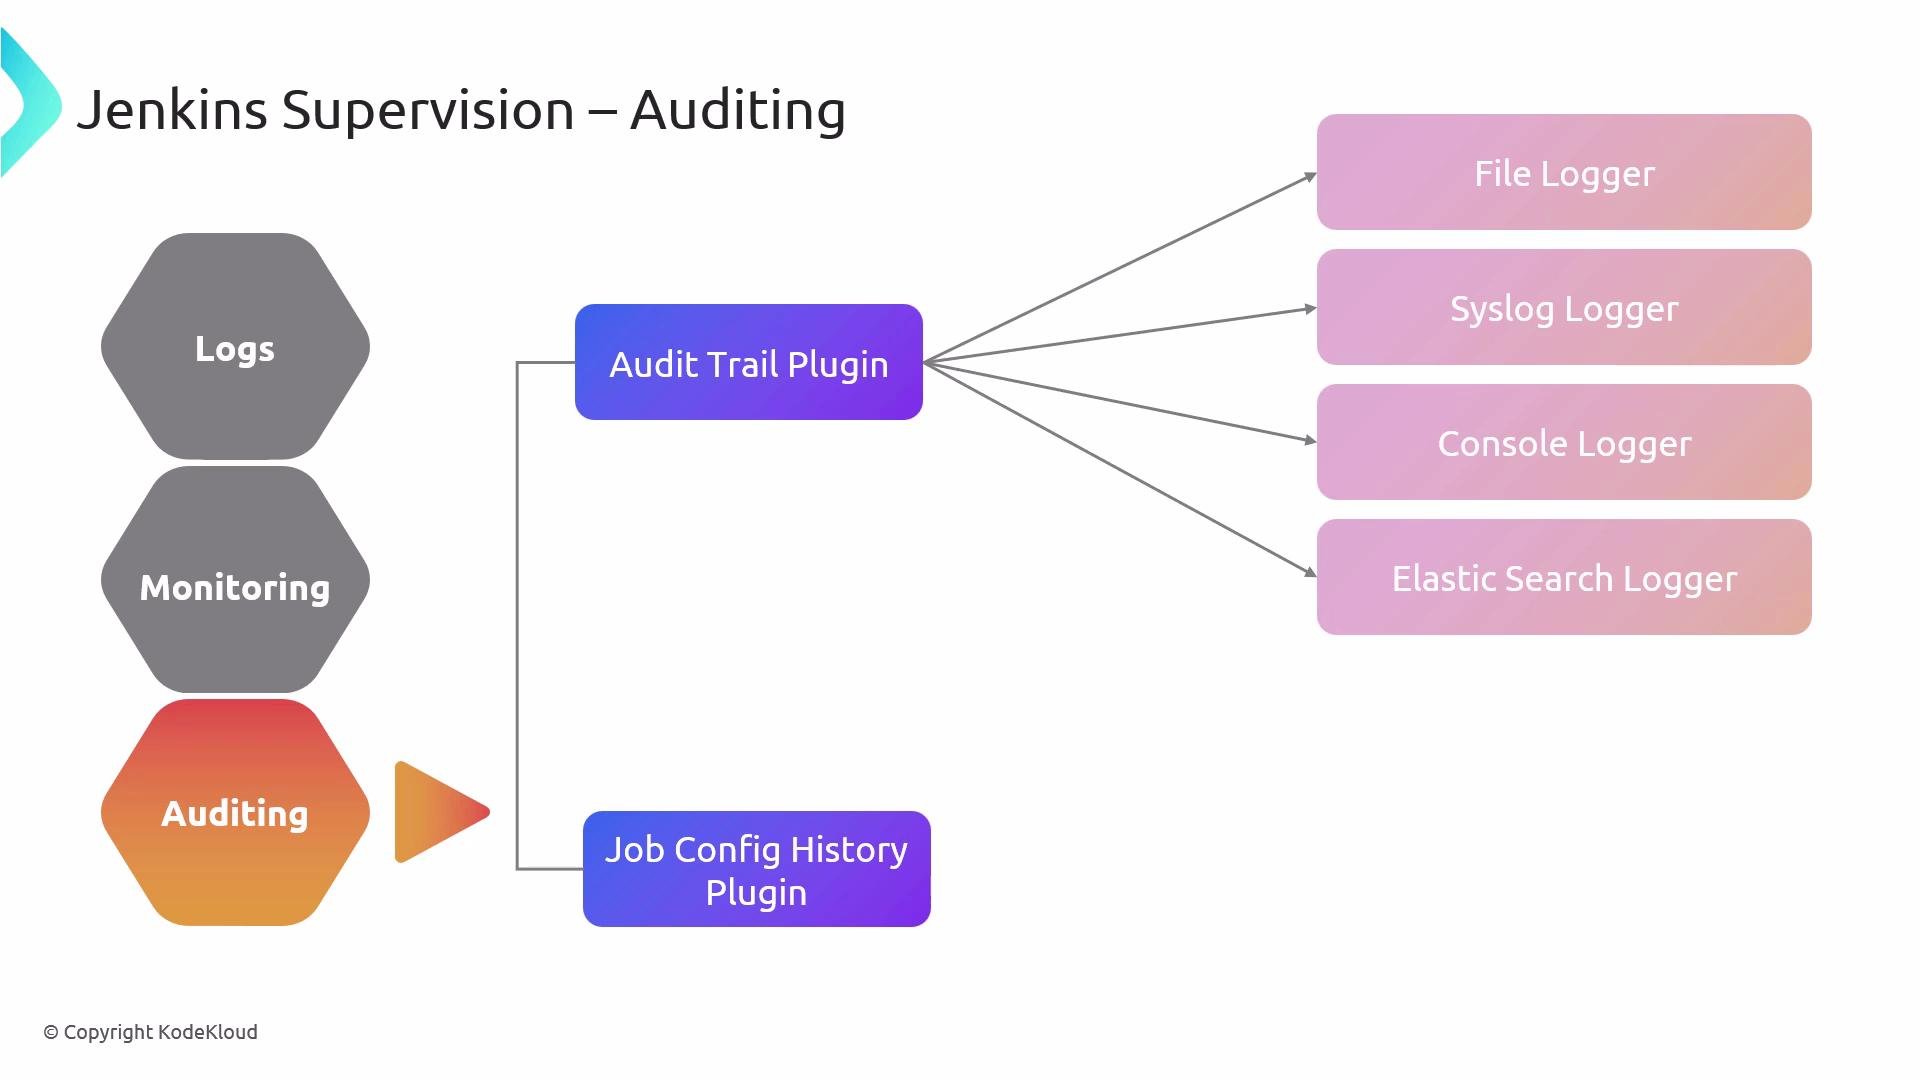 Job Config History plugin
* Acts as a configuration version control for Jenkins.
* Records changes to job, folder, and global `config.xml` files.
* Enables viewing historical versions, diffing changes, and restoring prior configs.
* Note: captures configuration edits but not job execution events.
Comparison: Audit Trail vs Job Config History
| Capability | Audit Trail plugin | Job Config History plugin |
| --------------------------------------------: | :--------------------------: | :-----------------------: |
| Records user actions (who, when) | ✓ | ✗ |
| Stores configuration diffs and allows restore | ✗ | ✓ |
| Streams to external logging systems | ✓ (via syslog/Filebeat/etc.) | ✗ (local history) |
| Useful for compliance reporting | ✓ | ✓ (for config integrity) |
Combining both plugins gives full coverage: use Audit Trail to answer "who did it?" and Job Config History to answer "what changed?" and recover previous configurations.
For production environments, prefer centralized logging (syslog, Elasticsearch, or a dedicated logging/metrics system) over console logging. Centralized logs make it easier to search, correlate events, and retain history for compliance and troubleshooting.
Best practices summary
* Centralize logs and metrics:
* Use `syslog`, ELK (Elasticsearch + Logstash/Beats + Kibana), Datadog, or another centralized platform for log retention and search.
* Expose Jenkins metrics with the Prometheus plugin and visualize with Grafana.
* Monitor capacity signals:
* Alert on sustained high queue length, high executor utilization, or nodes with low free memory/disk.
* Track configuration and user activity:
* Install Job Config History for configuration versioning.
* Install Audit Trail and forward audit records to a central store for long-term retention.
* Avoid console-only logging for audits in production; forward to files/syslog/Elasticsearch using collectors (e.g., Filebeat, Fluentd).
* Implement retention policies aligned with compliance; keep audit trails and metrics for the required period.
Quick operational checklist (copy to your runbook):
| Area | Recommended action |
| -------- | -------------------------------------------------------------------------------------- |
| Logs | Centralize Jenkins logs to ELK/Datadog; retain per compliance. |
| Metrics | Export Prometheus metrics; create Grafana dashboards for executor, queue, JVM. |
| Storage | Use Disk Usage plugin; clean up old workspaces and artifacts. |
| Auditing | Enable Audit Trail and forward to a central store; enable Job Config History. |
| Alerts | Create alerts for queue length, executor saturation, high GC pause, and disk pressure. |
By combining logs, performance metrics, and audit trails you build a comprehensive observability posture for Jenkins — enabling faster detection, clearer root-cause analysis, and confident recovery from configuration mistakes. For further reading, see:
* Jenkins official monitoring docs: [https://www.jenkins.io/doc/book/managing/system-log/](https://www.jenkins.io/doc/book/managing/system-log/)
* Prometheus: [https://prometheus.io/](https://prometheus.io/)
* Grafana: [https://grafana.com/](https://grafana.com/)
Job Config History plugin
* Acts as a configuration version control for Jenkins.
* Records changes to job, folder, and global `config.xml` files.
* Enables viewing historical versions, diffing changes, and restoring prior configs.
* Note: captures configuration edits but not job execution events.
Comparison: Audit Trail vs Job Config History
| Capability | Audit Trail plugin | Job Config History plugin |
| --------------------------------------------: | :--------------------------: | :-----------------------: |
| Records user actions (who, when) | ✓ | ✗ |
| Stores configuration diffs and allows restore | ✗ | ✓ |
| Streams to external logging systems | ✓ (via syslog/Filebeat/etc.) | ✗ (local history) |
| Useful for compliance reporting | ✓ | ✓ (for config integrity) |
Combining both plugins gives full coverage: use Audit Trail to answer "who did it?" and Job Config History to answer "what changed?" and recover previous configurations.
For production environments, prefer centralized logging (syslog, Elasticsearch, or a dedicated logging/metrics system) over console logging. Centralized logs make it easier to search, correlate events, and retain history for compliance and troubleshooting.
Best practices summary
* Centralize logs and metrics:
* Use `syslog`, ELK (Elasticsearch + Logstash/Beats + Kibana), Datadog, or another centralized platform for log retention and search.
* Expose Jenkins metrics with the Prometheus plugin and visualize with Grafana.
* Monitor capacity signals:
* Alert on sustained high queue length, high executor utilization, or nodes with low free memory/disk.
* Track configuration and user activity:
* Install Job Config History for configuration versioning.
* Install Audit Trail and forward audit records to a central store for long-term retention.
* Avoid console-only logging for audits in production; forward to files/syslog/Elasticsearch using collectors (e.g., Filebeat, Fluentd).
* Implement retention policies aligned with compliance; keep audit trails and metrics for the required period.
Quick operational checklist (copy to your runbook):
| Area | Recommended action |
| -------- | -------------------------------------------------------------------------------------- |
| Logs | Centralize Jenkins logs to ELK/Datadog; retain per compliance. |
| Metrics | Export Prometheus metrics; create Grafana dashboards for executor, queue, JVM. |
| Storage | Use Disk Usage plugin; clean up old workspaces and artifacts. |
| Auditing | Enable Audit Trail and forward to a central store; enable Job Config History. |
| Alerts | Create alerts for queue length, executor saturation, high GC pause, and disk pressure. |
By combining logs, performance metrics, and audit trails you build a comprehensive observability posture for Jenkins — enabling faster detection, clearer root-cause analysis, and confident recovery from configuration mistakes. For further reading, see:
* Jenkins official monitoring docs: [https://www.jenkins.io/doc/book/managing/system-log/](https://www.jenkins.io/doc/book/managing/system-log/)
* Prometheus: [https://prometheus.io/](https://prometheus.io/)
* Grafana: [https://grafana.com/](https://grafana.com/)