> ## Documentation Index
> Fetch the complete documentation index at: https://notes.kodekloud.com/llms.txt
> Use this file to discover all available pages before exploring further.
# Log Recorder
> Explains how to configure Jenkins log recorders and other methods to enable temporary verbose logging for troubleshooting plugins, Kubernetes, and persistent setups while warning about performance impact
How do I create a logger for troubleshooting and debugging purposes in Jenkins?
Jenkins provides multiple ways to collect more detailed logs when troubleshooting. Be careful: raising log levels for packages can produce large volumes of output and impact controller performance (increased I/O). Enable verbose logging only temporarily while diagnosing an issue, then restore or remove the logger.
Increasing log verbosity (e.g., to FINE, FINER, FINEST or ALL) can significantly impact Jenkins controller performance. Enable verbose logging only to diagnose issues, then restore the original level or delete the recorder.
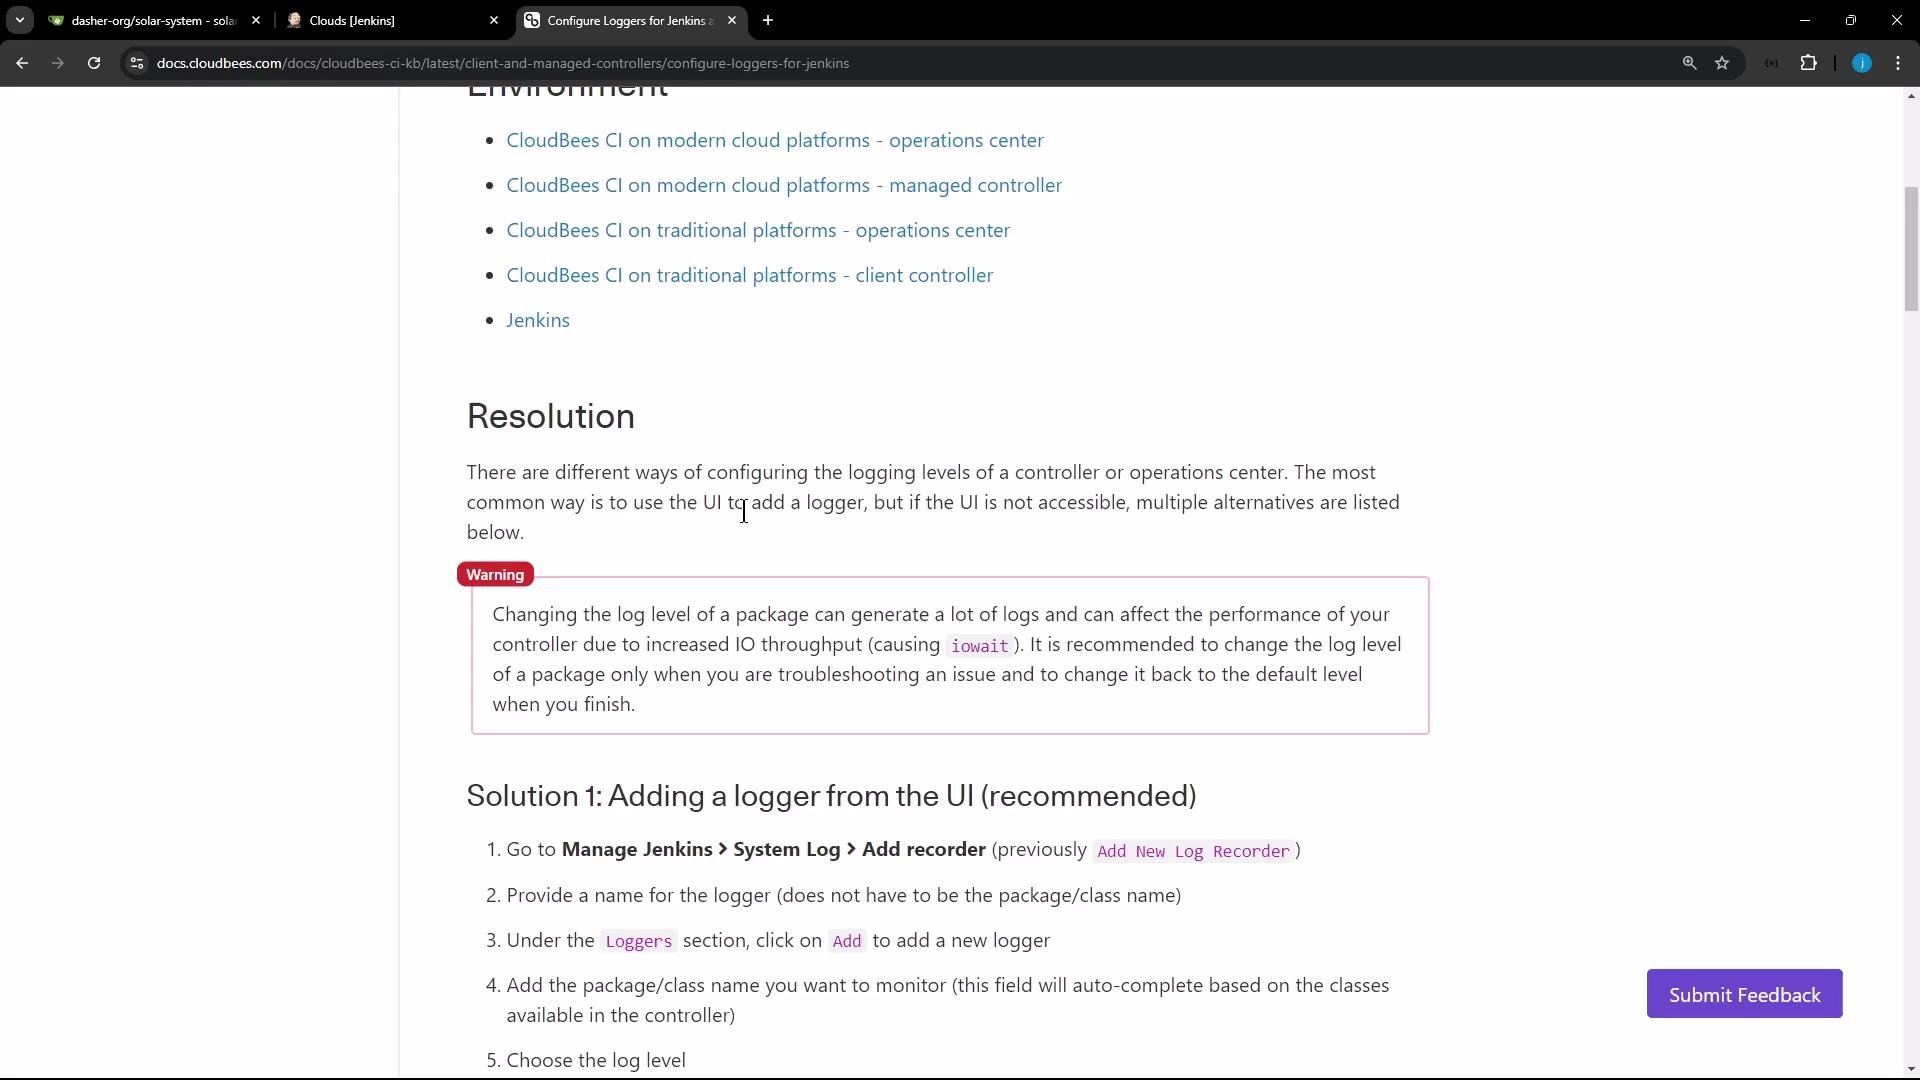 Overview of options
* Add a log recorder from the Jenkins UI — recommended for short-lived debugging.
* Run a Groovy init script to set logger levels at startup.
* Provide a Java logging properties file on the filesystem (`$JENKINS_HOME/logging.properties`).
* Add a persistent log recorder definition XML under Jenkins home (survives restarts).
* Configure default levels from the UI (note: UI changes may not persist across restarts).
Use the method that best fits your environment and operational constraints.
Options summary
| Method | When to use | Notes / Example |
| ----------------------- | ------------------------------------------ | ------------------------------------------- |
| UI log recorder | Ad-hoc, temporary debugging | Manage Jenkins → System Log → Add recorder |
| Groovy init script | Containerized or automated installs | Place `.groovy` files in `init.groovy.d/` |
| Logging properties file | Persisted logging config loaded at startup | Put `logging.properties` in `$JENKINS_HOME` |
| Persistent XML recorder | Keep custom recorders across restarts | Add XML under `JENKINS_HOME/log/` |
| UI default-level | Quick changes via UI | May not survive Jenkins restart |
Detailed examples
Groovy init script
* Add a Groovy script to the Jenkins initialization scripts (for example, in `init.groovy.d/`) to set logger levels programmatically. This is useful for automated deployments or containers where you control the image contents.
```groovy theme={null}
// init.groovy.d/set-logger-levels.groovy
import java.util.logging.Level
import java.util.logging.Logger
Logger.getLogger("hudson.plugins.git.GitStatus").setLevel(Level.SEVERE)
Logger.getLogger("hudson.security.csrf.CrumbFilter").setLevel(Level.SEVERE)
```
Logging properties (via filesystem)
* You can also set logging via a Java logging properties file placed under `$JENKINS_HOME/logging.properties` and have Jenkins load it during startup:
```properties theme={null}
.level = INFO
handlers = java.util.logging.ConsoleHandler
java.util.logging.ConsoleHandler.level = INFO
java.util.logging.ConsoleHandler.formatter = java.util.logging.SimpleFormatter
hudson.security.csrf.CrumbFilter.level = SEVERE
hudson.plugins.git.GitStatus.level = SEVERE
```
Filesystem layout example
* Example layout for a custom log recorder and its output file placed inside `JENKINS_HOME/log/`:
```bash theme={null}
$JENKINS_HOME (root)
+- log
| +- kb-article.xml # Custom log recorder definition
+- logs
+- custom
+- kb-article.log # Custom log recorder file
```
Persistent log recorder XML
* To persist a named recorder across restarts, create an XML file under the Jenkins home logs directory. A minimal example (truncated):
```xml theme={null}
kb-article
org.jenkinsci.plugins.saml
300
org.pac4j
300
```
UI approach (recommended for short-lived debugging)
* The simplest and most approachable method for temporary troubleshooting is using the Jenkins UI:
1. Manage Jenkins → System Log.
2. Click "Add recorder" to create a named log recorder.
3. Within the recorder, add one or more logger names (packages/classes) and set the desired level.
4. Save, run the operation you want to diagnose, then view the recorded logs.
Use-case: Kubernetes cloud plugin debugging
* Example scenario: a Kubernetes cloud configured in Jenkins fails the test connection and shows only a terse error in the UI. Creating a log recorder for the Kubernetes client packages (for example `io.fabric8.kubernetes`) reveals HTTP-level details, Authorization headers, and response bodies that the plugin UI hides.
Overview of options
* Add a log recorder from the Jenkins UI — recommended for short-lived debugging.
* Run a Groovy init script to set logger levels at startup.
* Provide a Java logging properties file on the filesystem (`$JENKINS_HOME/logging.properties`).
* Add a persistent log recorder definition XML under Jenkins home (survives restarts).
* Configure default levels from the UI (note: UI changes may not persist across restarts).
Use the method that best fits your environment and operational constraints.
Options summary
| Method | When to use | Notes / Example |
| ----------------------- | ------------------------------------------ | ------------------------------------------- |
| UI log recorder | Ad-hoc, temporary debugging | Manage Jenkins → System Log → Add recorder |
| Groovy init script | Containerized or automated installs | Place `.groovy` files in `init.groovy.d/` |
| Logging properties file | Persisted logging config loaded at startup | Put `logging.properties` in `$JENKINS_HOME` |
| Persistent XML recorder | Keep custom recorders across restarts | Add XML under `JENKINS_HOME/log/` |
| UI default-level | Quick changes via UI | May not survive Jenkins restart |
Detailed examples
Groovy init script
* Add a Groovy script to the Jenkins initialization scripts (for example, in `init.groovy.d/`) to set logger levels programmatically. This is useful for automated deployments or containers where you control the image contents.
```groovy theme={null}
// init.groovy.d/set-logger-levels.groovy
import java.util.logging.Level
import java.util.logging.Logger
Logger.getLogger("hudson.plugins.git.GitStatus").setLevel(Level.SEVERE)
Logger.getLogger("hudson.security.csrf.CrumbFilter").setLevel(Level.SEVERE)
```
Logging properties (via filesystem)
* You can also set logging via a Java logging properties file placed under `$JENKINS_HOME/logging.properties` and have Jenkins load it during startup:
```properties theme={null}
.level = INFO
handlers = java.util.logging.ConsoleHandler
java.util.logging.ConsoleHandler.level = INFO
java.util.logging.ConsoleHandler.formatter = java.util.logging.SimpleFormatter
hudson.security.csrf.CrumbFilter.level = SEVERE
hudson.plugins.git.GitStatus.level = SEVERE
```
Filesystem layout example
* Example layout for a custom log recorder and its output file placed inside `JENKINS_HOME/log/`:
```bash theme={null}
$JENKINS_HOME (root)
+- log
| +- kb-article.xml # Custom log recorder definition
+- logs
+- custom
+- kb-article.log # Custom log recorder file
```
Persistent log recorder XML
* To persist a named recorder across restarts, create an XML file under the Jenkins home logs directory. A minimal example (truncated):
```xml theme={null}
kb-article
org.jenkinsci.plugins.saml
300
org.pac4j
300
```
UI approach (recommended for short-lived debugging)
* The simplest and most approachable method for temporary troubleshooting is using the Jenkins UI:
1. Manage Jenkins → System Log.
2. Click "Add recorder" to create a named log recorder.
3. Within the recorder, add one or more logger names (packages/classes) and set the desired level.
4. Save, run the operation you want to diagnose, then view the recorded logs.
Use-case: Kubernetes cloud plugin debugging
* Example scenario: a Kubernetes cloud configured in Jenkins fails the test connection and shows only a terse error in the UI. Creating a log recorder for the Kubernetes client packages (for example `io.fabric8.kubernetes`) reveals HTTP-level details, Authorization headers, and response bodies that the plugin UI hides.
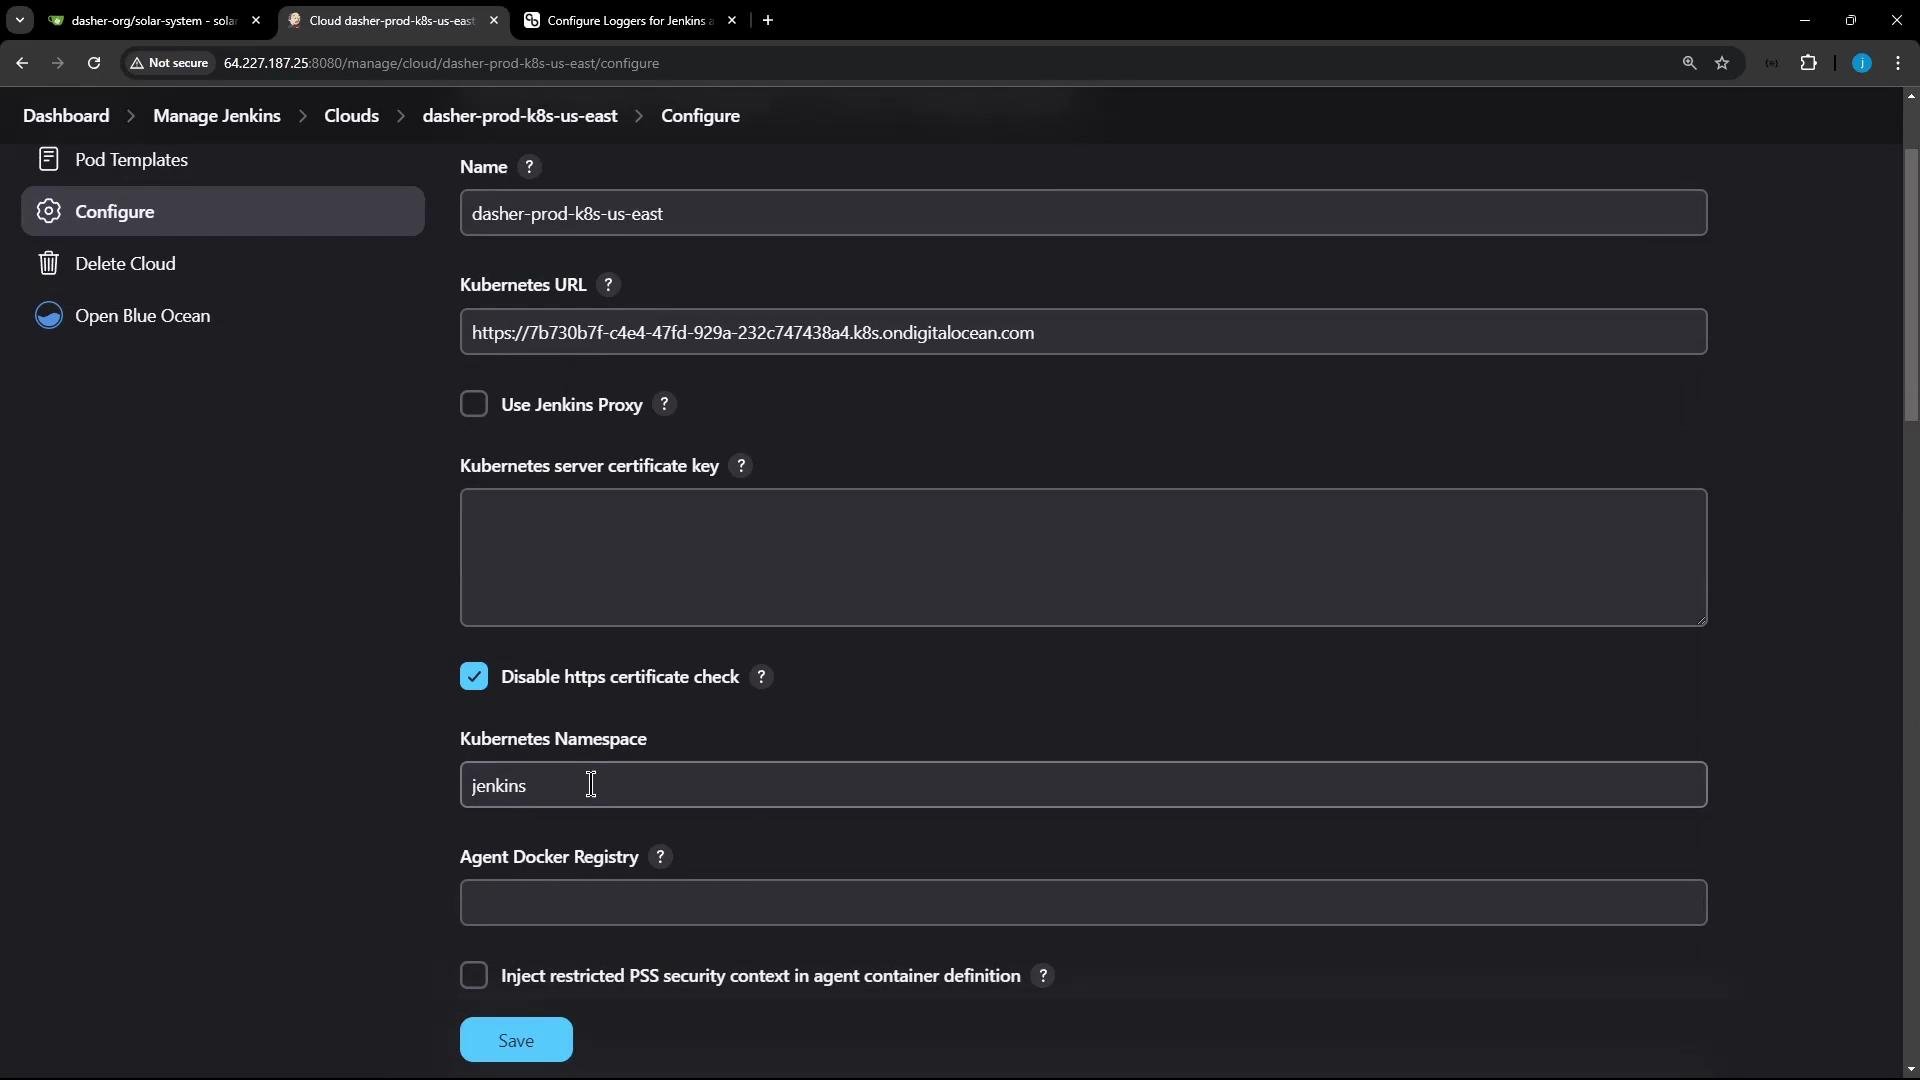 If the test connection fails, the UI might show a high-level error such as:
```text theme={null}
Error testing connection https://7b730b7f-c4ed-47fd-929a-232c747438a4.k8s.ondigitalocean.com
io.fabric8.kubernetes.client.KubernetesClientException: Failure executing: GET at: https://7b730b7f-c4ed-47fd-929a-232c747438a4.k8s.ondigitalocean.com/api/v1/namespaces/jenkins-123/pods. Message: pods is forbidden! User "system:serviceaccount:jenkins:jenkins-service-account" cannot list resource "pods" in API group "" in the namespace "jenkins-123".
```
To capture HTTP request/response and more detailed client logs:
1. Manage Jenkins → System Log → Add recorder.
2. Name it (for example `k8s-logs`).
3. Add loggers such as `io.fabric8.kubernetes` and set the level to the desired verbosity (`FINE`, `FINER`, `FINEST`, or `ALL`). Use high verbosity only temporarily.
If the test connection fails, the UI might show a high-level error such as:
```text theme={null}
Error testing connection https://7b730b7f-c4ed-47fd-929a-232c747438a4.k8s.ondigitalocean.com
io.fabric8.kubernetes.client.KubernetesClientException: Failure executing: GET at: https://7b730b7f-c4ed-47fd-929a-232c747438a4.k8s.ondigitalocean.com/api/v1/namespaces/jenkins-123/pods. Message: pods is forbidden! User "system:serviceaccount:jenkins:jenkins-service-account" cannot list resource "pods" in API group "" in the namespace "jenkins-123".
```
To capture HTTP request/response and more detailed client logs:
1. Manage Jenkins → System Log → Add recorder.
2. Name it (for example `k8s-logs`).
3. Add loggers such as `io.fabric8.kubernetes` and set the level to the desired verbosity (`FINE`, `FINER`, `FINEST`, or `ALL`). Use high verbosity only temporarily.
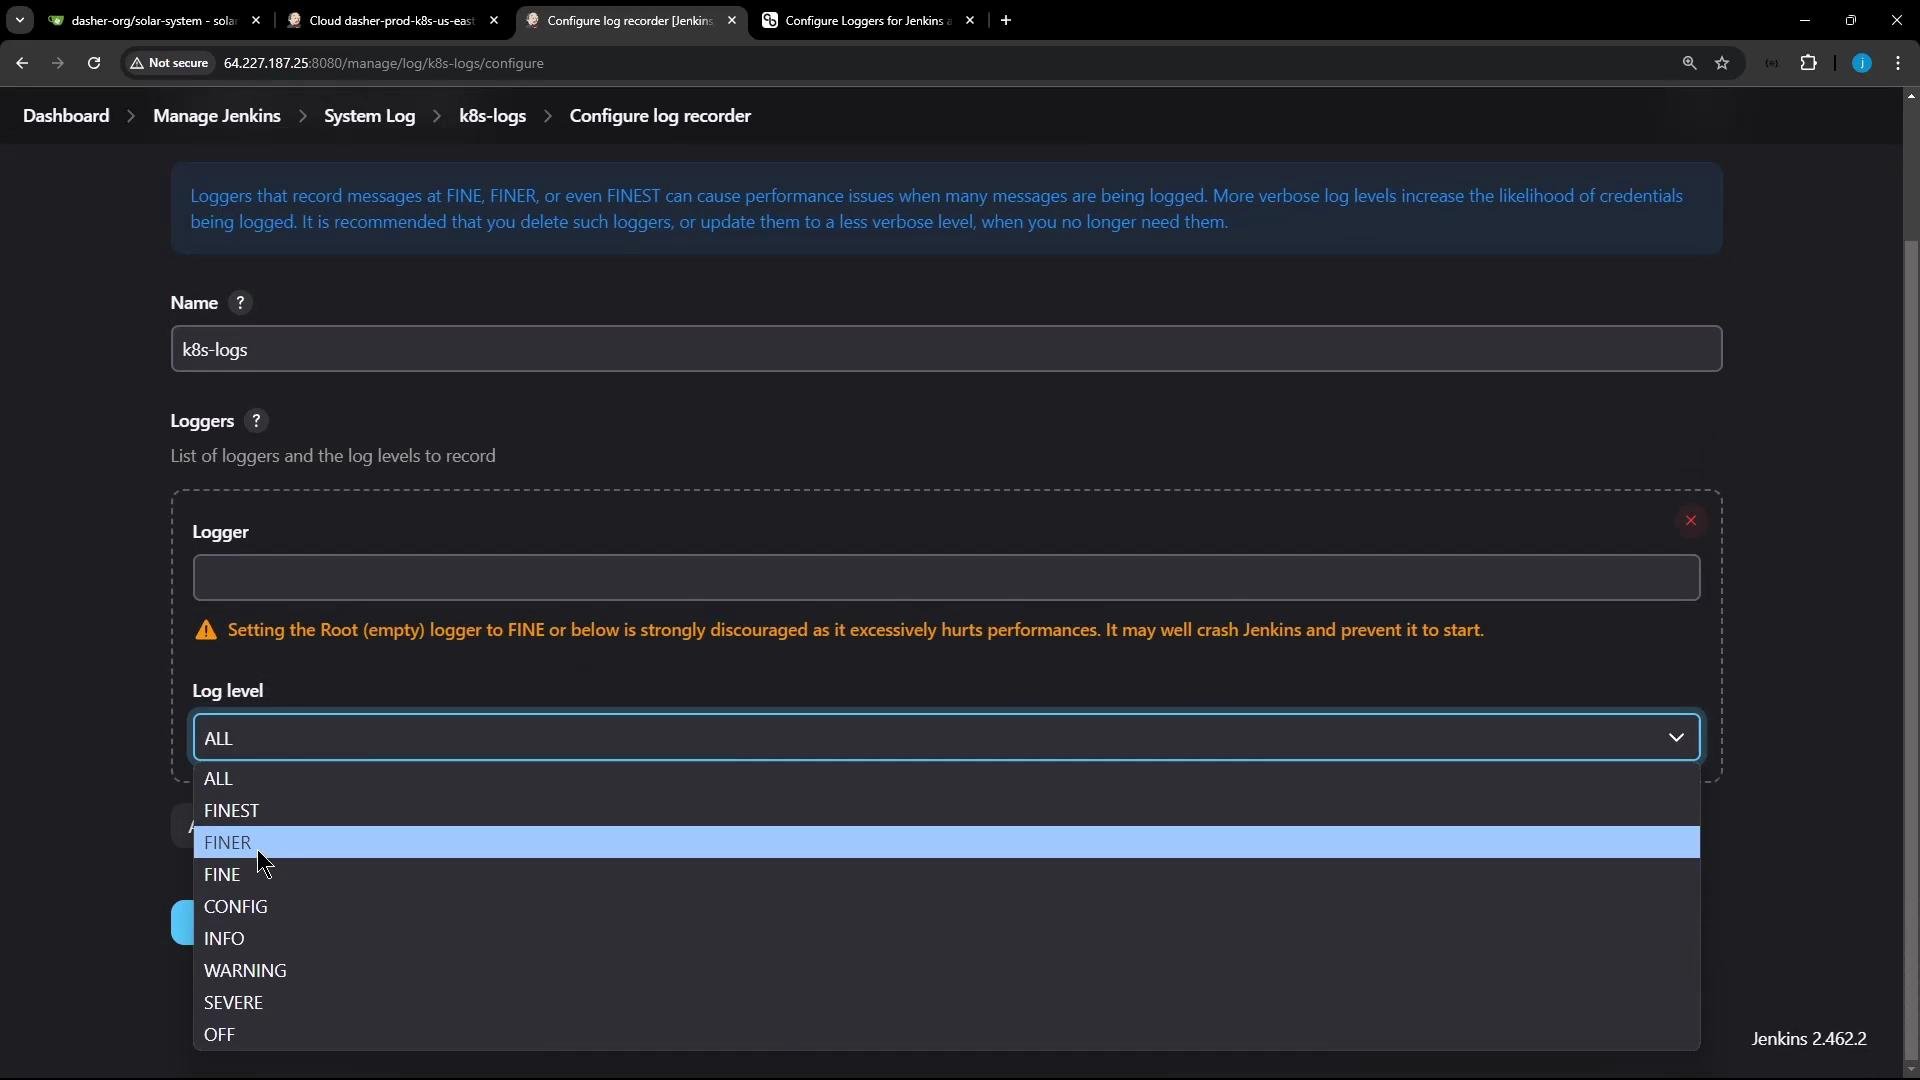 Search for the relevant package (e.g., "Kubernetes" or "io.fabric8"), select the appropriate logger and level, then Save.
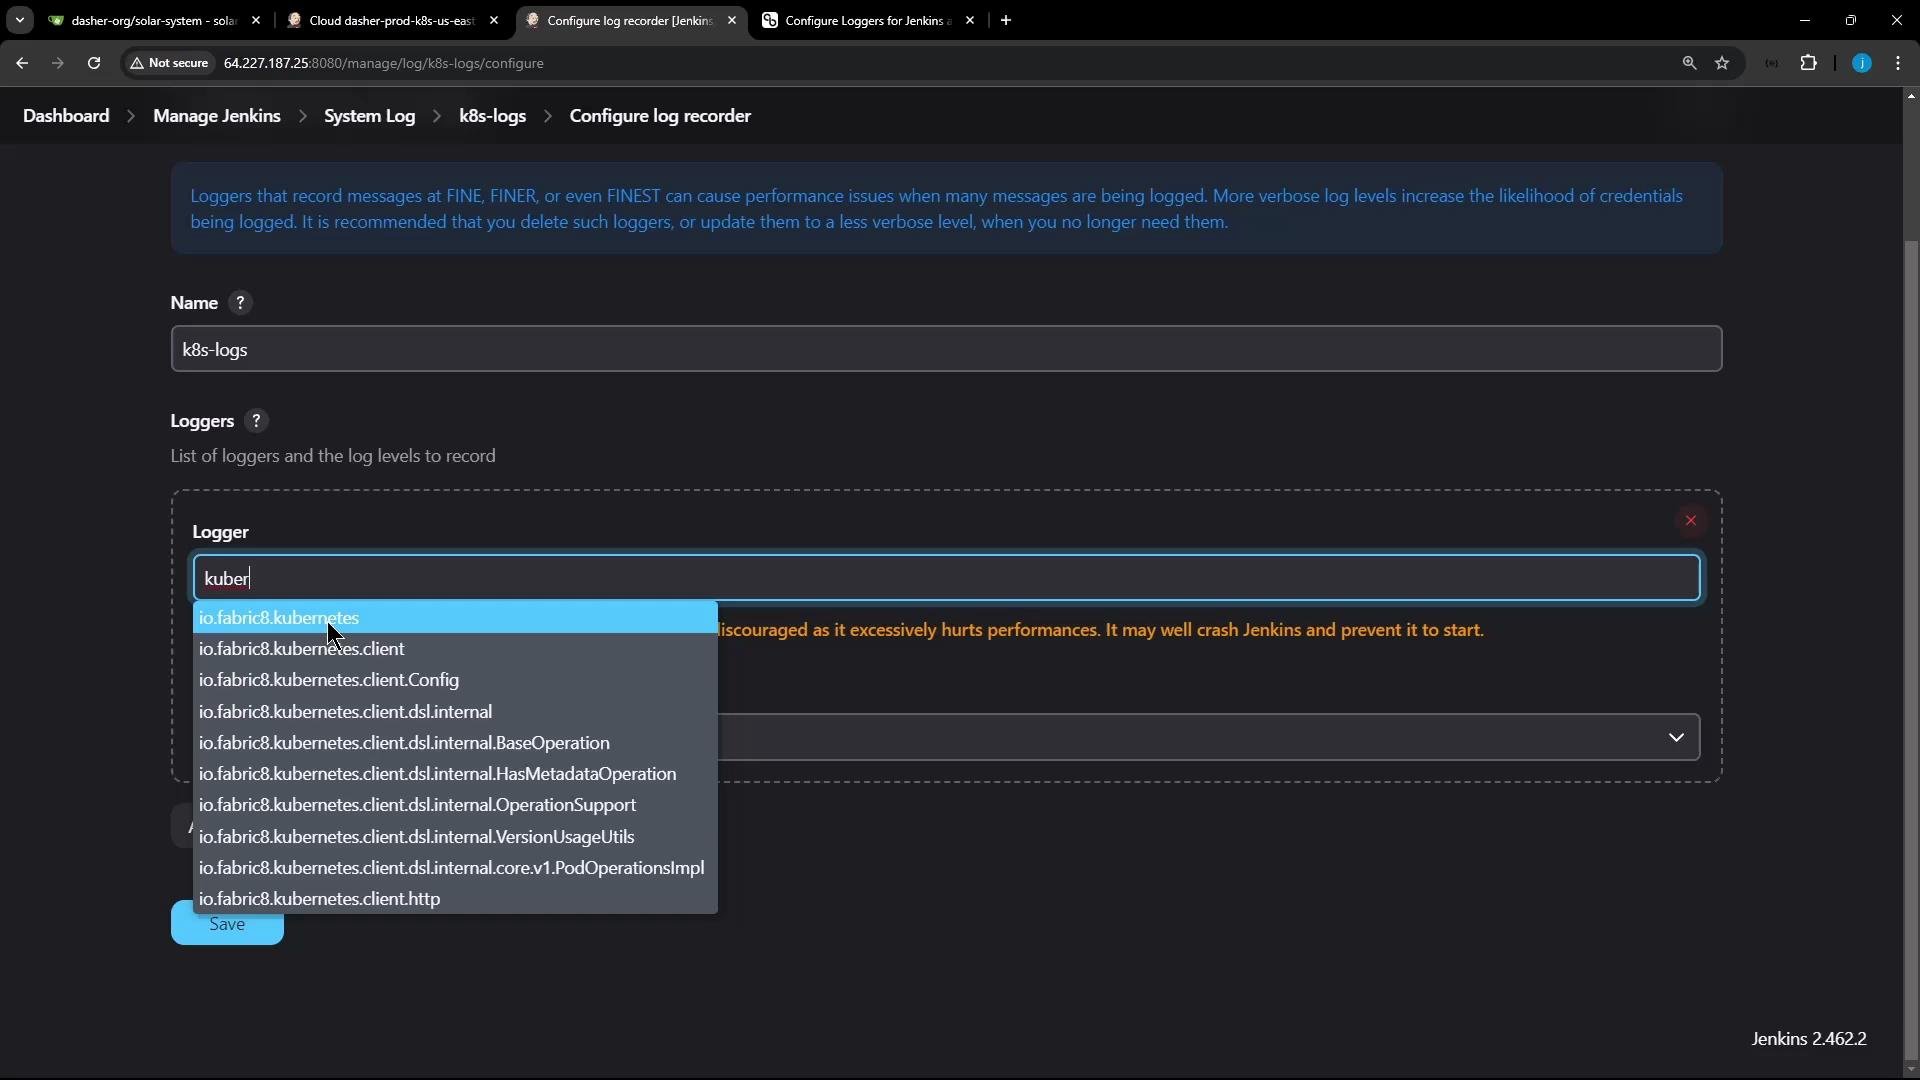 After enabling the recorder, trigger the failing operation (for example, test connection). The log recorder will show verbose HTTP request/response traces from the fabric8 Kubernetes client.
Example: 403 Forbidden (when RBAC prevents listing pods)
* With verbose logging enabled you will see the HTTP request with the Authorization header and the server response, including the JSON response body returned by Kubernetes:
```text theme={null}
Nov 10, 2024 17:34:35 FINE io.fabric8.kubernetes.client.utils.HttpClientUtils getHttpClientFactory
Using httpclient io.fabric8.kubernetes.client.okhttp.OkHttpClientFactory factory
Nov 10, 2024 17:34:35 FINEST io.fabric8.kubernetes.client.http.HttpLoggingInterceptor$HttpLogger logRequest
> GET https://7b730b7f-c4e4-47fd-929a-232c747438a4.k8s.ondigitalocean.com/api/v1/namespaces/jenkins-127/pods
Nov 10, 2024 17:34:35 FINEST io.fabric8.kubernetes.client.http.HttpLoggingInterceptor$HttpLogger logRequest
> Authorization: Bearer eyJhbGciOiJSUzI1NiIsImtpZCI6...
Nov 10, 2024 17:34:35 FINEST io.fabric8.kubernetes.client.http.HttpLoggingInterceptor$HttpLogger logResponse
< 403 Forbidden
Nov 10, 2024 17:34:35 FINEST io.fabric8.kubernetes.client.http.HttpLoggingInterceptor$HttpLogger logResponseBody
{"kind":"Status","apiVersion":"v1","metadata":{},"status":"Failure","message":"pods is forbidden: User \"system:serviceaccount:jenkins:jenkins-service-account\" cannot list resource \"pods\" in the namespace \"jenkins-123\"","reason":"Forbidden","details":{"kind":"pods"},"code":403}
```
This JSON body (`{"kind":"Status", ... }`) is the raw Kubernetes response and is not normally visible in the plugin UI; the log recorder reveals it and helps identify RBAC or credential issues.
Example: 200 OK (when credentials/permissions are correct)
* When the connection succeeds, you'll see similar HTTP-level logs followed by the Kubernetes version JSON in the response body:
```text theme={null}
Nov 10, 2024 17:35:34 FINE io.fabric8.kubernetes.client.utils.HttpClientUtils getHttpClientFactory
Using httpclient io.fabric8.kubernetes.client.okhttp.OkHttpClientFactory factory
Nov 10, 2024 17:35:34 FINEST io.fabric8.kubernetes.client.http.HttpLoggingInterceptor$HttpLogger logRequest
> GET https://7b730b7f-c4e4-47fd-929a-232c747438a4.k8s.ondigitalocean.com/api/v1/namespaces/jenkins/pods
Nov 10, 2024 17:35:34 FINEST io.fabric8.kubernetes.client.http.HttpLoggingInterceptor$HttpLogger logResponse
< 200 OK
Nov 10, 2024 17:35:34 FINEST io.fabric8.kubernetes.client.http.HttpLoggingInterceptor$HttpLogger logResponseBody
{
"major": "1",
"minor": "29",
"gitVersion": "v1.29.9",
"gitCommit": "114a1f58037bd70f90d9e630e591c5e52dd9b298",
"gitTreeState": "clean",
"buildDate": "2024-09-11T20:19:54Z",
"goVersion": "go1.22.6",
"compiler": "gc",
"platform": "linux/amd64"
}
```
Viewing and managing recorders
* You can create multiple recorders for different plugins or packages and view their output from Manage Jenkins → System Log. Use separate recorders for different subsystems (for example, `k8s-logs`, `git-logs`, `security-logs`) to keep output organized.
After enabling the recorder, trigger the failing operation (for example, test connection). The log recorder will show verbose HTTP request/response traces from the fabric8 Kubernetes client.
Example: 403 Forbidden (when RBAC prevents listing pods)
* With verbose logging enabled you will see the HTTP request with the Authorization header and the server response, including the JSON response body returned by Kubernetes:
```text theme={null}
Nov 10, 2024 17:34:35 FINE io.fabric8.kubernetes.client.utils.HttpClientUtils getHttpClientFactory
Using httpclient io.fabric8.kubernetes.client.okhttp.OkHttpClientFactory factory
Nov 10, 2024 17:34:35 FINEST io.fabric8.kubernetes.client.http.HttpLoggingInterceptor$HttpLogger logRequest
> GET https://7b730b7f-c4e4-47fd-929a-232c747438a4.k8s.ondigitalocean.com/api/v1/namespaces/jenkins-127/pods
Nov 10, 2024 17:34:35 FINEST io.fabric8.kubernetes.client.http.HttpLoggingInterceptor$HttpLogger logRequest
> Authorization: Bearer eyJhbGciOiJSUzI1NiIsImtpZCI6...
Nov 10, 2024 17:34:35 FINEST io.fabric8.kubernetes.client.http.HttpLoggingInterceptor$HttpLogger logResponse
< 403 Forbidden
Nov 10, 2024 17:34:35 FINEST io.fabric8.kubernetes.client.http.HttpLoggingInterceptor$HttpLogger logResponseBody
{"kind":"Status","apiVersion":"v1","metadata":{},"status":"Failure","message":"pods is forbidden: User \"system:serviceaccount:jenkins:jenkins-service-account\" cannot list resource \"pods\" in the namespace \"jenkins-123\"","reason":"Forbidden","details":{"kind":"pods"},"code":403}
```
This JSON body (`{"kind":"Status", ... }`) is the raw Kubernetes response and is not normally visible in the plugin UI; the log recorder reveals it and helps identify RBAC or credential issues.
Example: 200 OK (when credentials/permissions are correct)
* When the connection succeeds, you'll see similar HTTP-level logs followed by the Kubernetes version JSON in the response body:
```text theme={null}
Nov 10, 2024 17:35:34 FINE io.fabric8.kubernetes.client.utils.HttpClientUtils getHttpClientFactory
Using httpclient io.fabric8.kubernetes.client.okhttp.OkHttpClientFactory factory
Nov 10, 2024 17:35:34 FINEST io.fabric8.kubernetes.client.http.HttpLoggingInterceptor$HttpLogger logRequest
> GET https://7b730b7f-c4e4-47fd-929a-232c747438a4.k8s.ondigitalocean.com/api/v1/namespaces/jenkins/pods
Nov 10, 2024 17:35:34 FINEST io.fabric8.kubernetes.client.http.HttpLoggingInterceptor$HttpLogger logResponse
< 200 OK
Nov 10, 2024 17:35:34 FINEST io.fabric8.kubernetes.client.http.HttpLoggingInterceptor$HttpLogger logResponseBody
{
"major": "1",
"minor": "29",
"gitVersion": "v1.29.9",
"gitCommit": "114a1f58037bd70f90d9e630e591c5e52dd9b298",
"gitTreeState": "clean",
"buildDate": "2024-09-11T20:19:54Z",
"goVersion": "go1.22.6",
"compiler": "gc",
"platform": "linux/amd64"
}
```
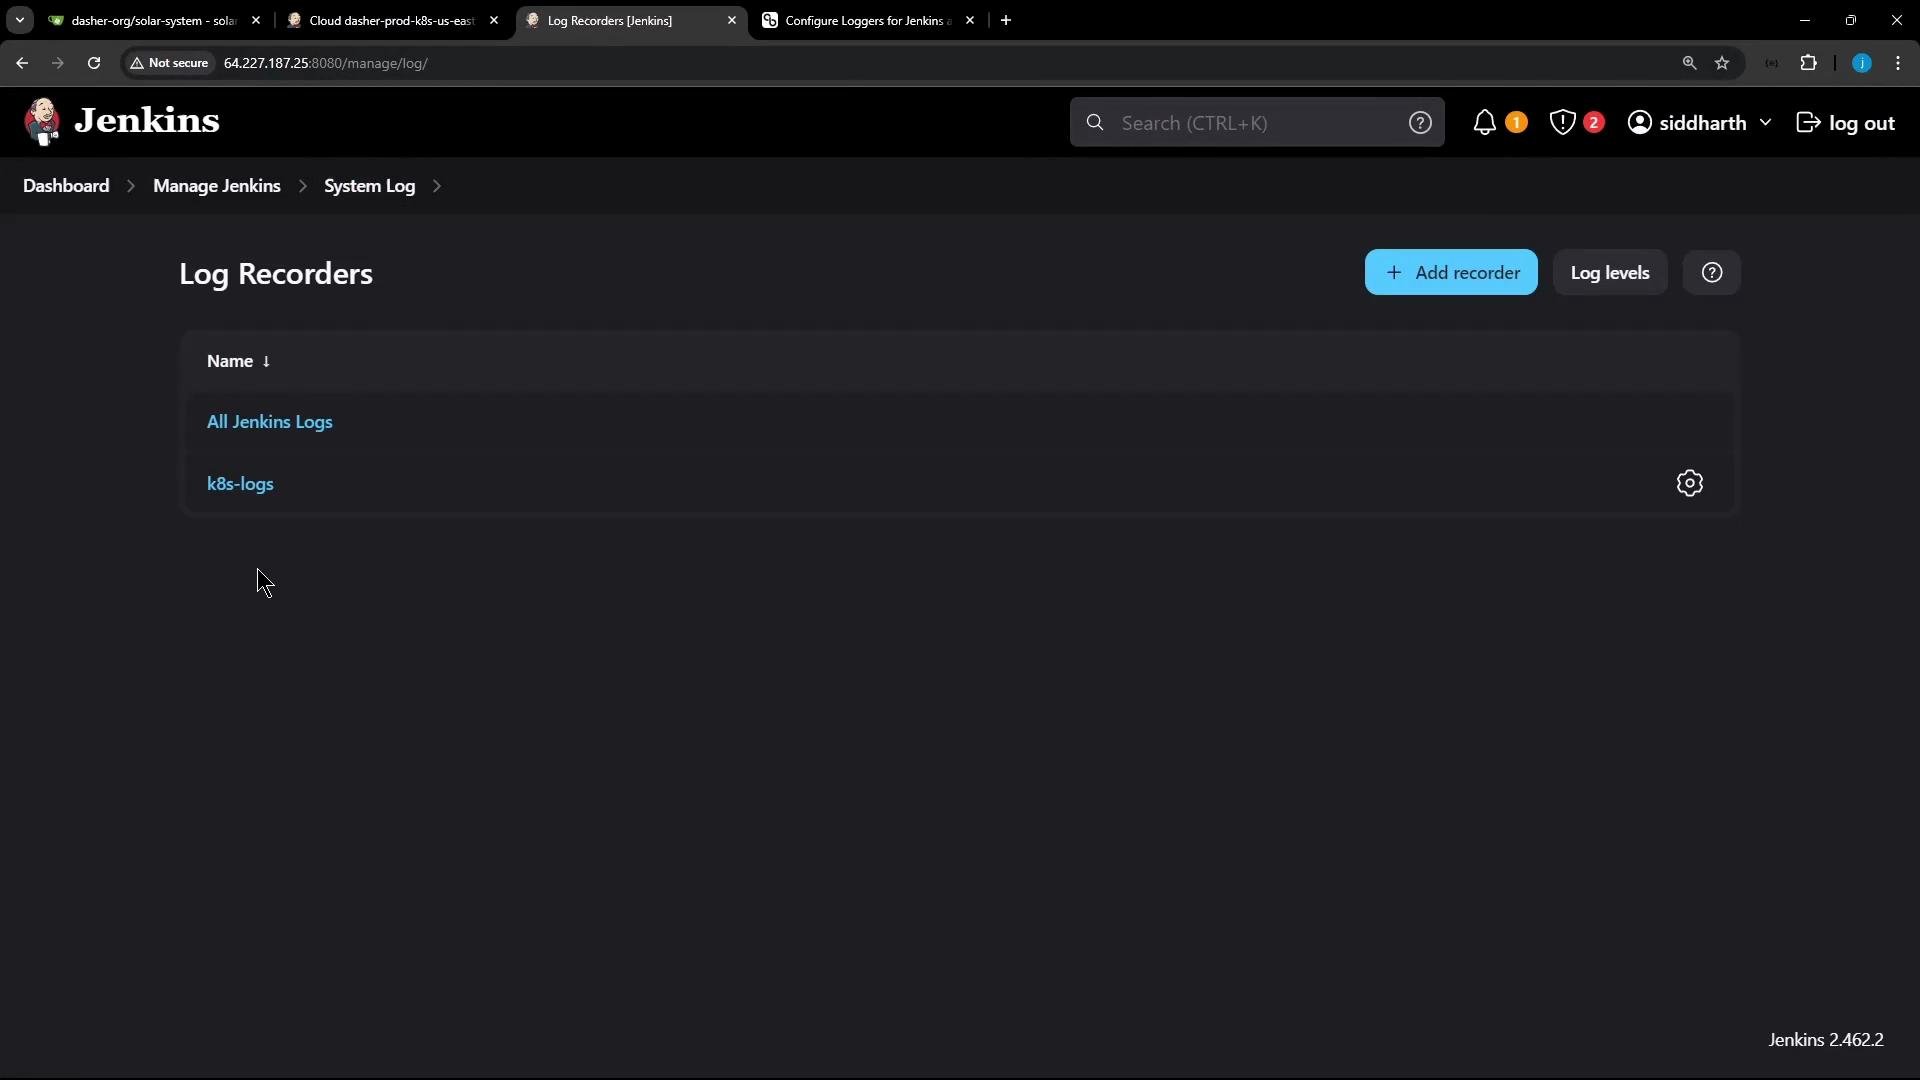
Viewing and managing recorders
* You can create multiple recorders for different plugins or packages and view their output from Manage Jenkins → System Log. Use separate recorders for different subsystems (for example, `k8s-logs`, `git-logs`, `security-logs`) to keep output organized.
 Cleanup
* After troubleshooting, clear or delete the log recorder or restore previous log levels to avoid ongoing verbose logging and the associated performance impact.
Best practice: apply verbose logging only for the narrowest scope (specific package/class names), run the failing operation to capture the needed information, then revert changes immediately. Automate cleanup where possible (e.g., delete recorder via script or remove init scripts).
Links and references
* Jenkins System Log / Log Recorders — see Manage Jenkins → System Log in your Jenkins UI.
* Jenkins logging and troubleshooting concepts: [https://www.jenkins.io/doc/](https://www.jenkins.io/doc/)
* Kubernetes API status responses: [https://kubernetes.io/docs/reference/using-api/api-concepts/#status](https://kubernetes.io/docs/reference/using-api/api-concepts/#status)
* fabric8 Kubernetes client: [https://github.com/fabric8io/kubernetes-client](https://github.com/fabric8io/kubernetes-client)
That covers configuring log recorders and other common approaches to increase logging for troubleshooting in Jenkins.
Cleanup
* After troubleshooting, clear or delete the log recorder or restore previous log levels to avoid ongoing verbose logging and the associated performance impact.
Best practice: apply verbose logging only for the narrowest scope (specific package/class names), run the failing operation to capture the needed information, then revert changes immediately. Automate cleanup where possible (e.g., delete recorder via script or remove init scripts).
Links and references
* Jenkins System Log / Log Recorders — see Manage Jenkins → System Log in your Jenkins UI.
* Jenkins logging and troubleshooting concepts: [https://www.jenkins.io/doc/](https://www.jenkins.io/doc/)
* Kubernetes API status responses: [https://kubernetes.io/docs/reference/using-api/api-concepts/#status](https://kubernetes.io/docs/reference/using-api/api-concepts/#status)
* fabric8 Kubernetes client: [https://github.com/fabric8io/kubernetes-client](https://github.com/fabric8io/kubernetes-client)
That covers configuring log recorders and other common approaches to increase logging for troubleshooting in Jenkins.