> ## Documentation Index
> Fetch the complete documentation index at: https://notes.kodekloud.com/llms.txt
> Use this file to discover all available pages before exploring further.
# Monitoring with Prometheus Grafana
> Guides installing Jenkins Prometheus plugin, exposing /prometheus metrics, configuring Prometheus and Grafana via Docker Compose, importing dashboards and validating Jenkins monitoring and metrics visualization.
In this lesson you'll learn how to monitor Jenkins by exposing Prometheus-format metrics using the Jenkins "Prometheus metrics" plugin, scraping those metrics with Prometheus, and visualizing them in Grafana. This guide includes configuration examples, a Docker Compose stack for Prometheus + Grafana, Prometheus scrape config, example Prometheus queries, and steps to import a community Jenkins dashboard into Grafana.
What you'll cover:
* Install and configure the Jenkins Prometheus plugin
* Verify the `/prometheus` metrics endpoint
* Run Prometheus and Grafana (Docker Compose)
* Configure Prometheus to scrape Jenkins
* Add Prometheus as a Grafana data source and import a Jenkins dashboard
* Create test Jenkins activity and validate dashboards
Prerequisites
* A running Jenkins instance where you can install plugins and access Manage Jenkins → Configure System
* Docker & Docker Compose (for the Prometheus + Grafana stack example) or an existing Prometheus/Grafana installation
* Network connectivity between Prometheus and Jenkins (or adjust `prometheus.yml` accordingly)
Install the Jenkins Prometheus plugin
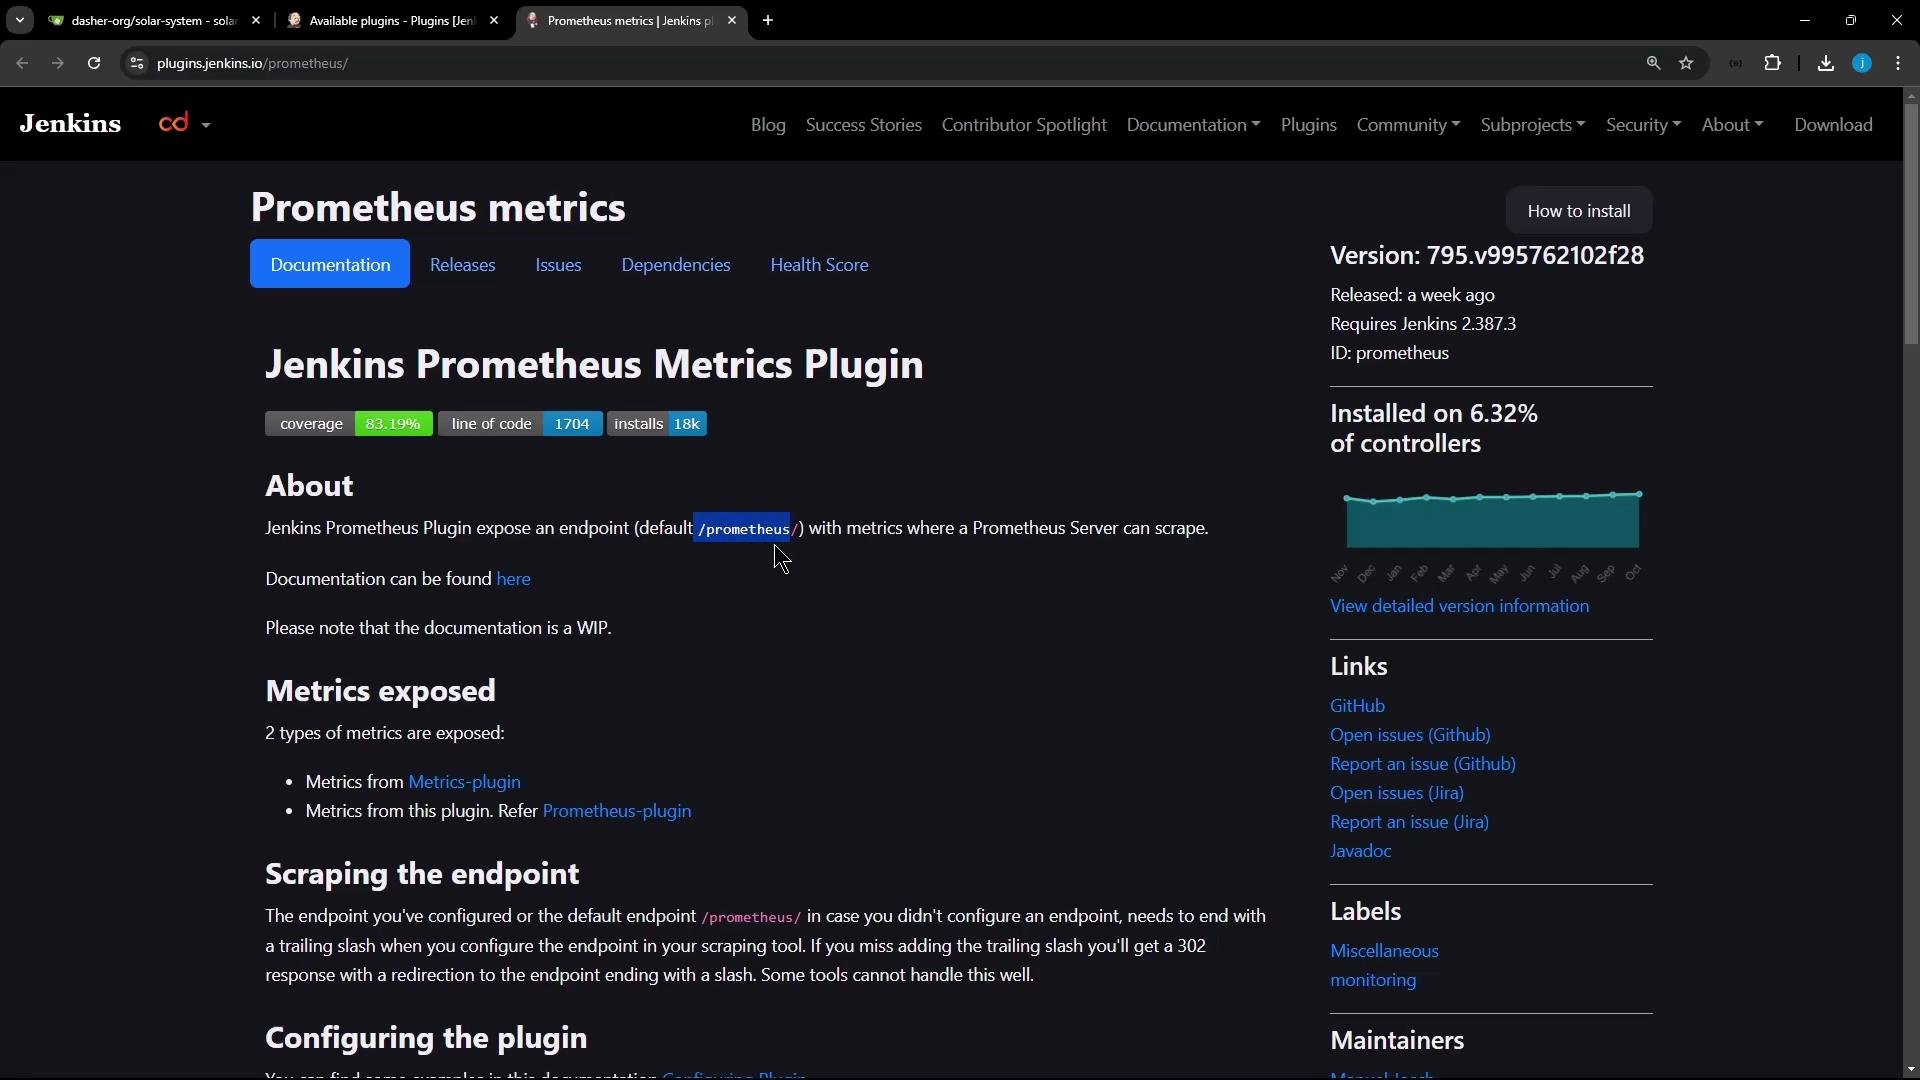
1. In Jenkins go to Manage Jenkins → Manage Plugins and install the "Prometheus metrics" plugin.
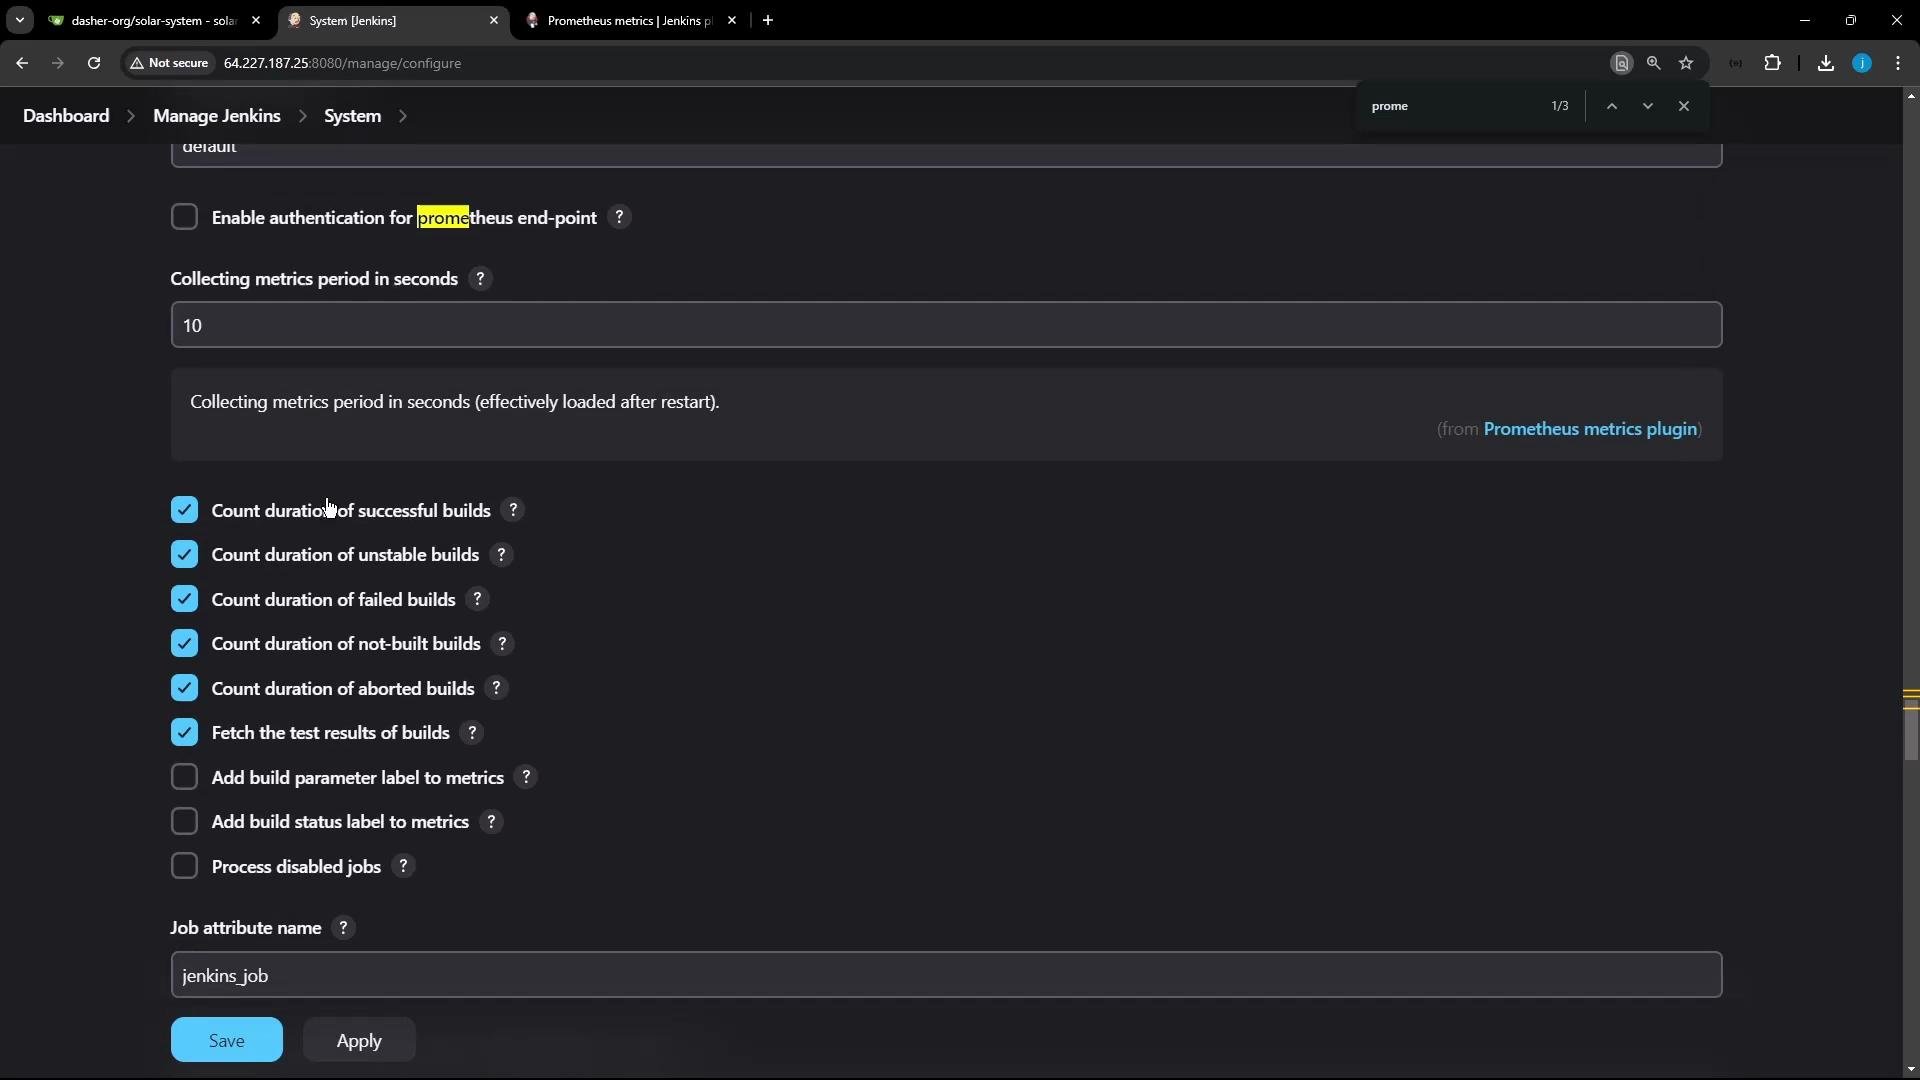
2. After installation open Manage Jenkins → Configure System to review plugin settings and enable the metric groups you need (JVM, build metrics, node status, disk usage, etc.).
 Configure the Prometheus metrics plugin
* The plugin exposes metrics at `/prometheus` by default.
* Typical settings include the collection interval (often 10s) and checkboxes to enable/disable metric groups (e.g., build durations, JVM metrics).
* Some metrics (like disk usage) may require extra permissions or supplemental plugins.
Configure the Prometheus metrics plugin
* The plugin exposes metrics at `/prometheus` by default.
* Typical settings include the collection interval (often 10s) and checkboxes to enable/disable metric groups (e.g., build durations, JVM metrics).
* Some metrics (like disk usage) may require extra permissions or supplemental plugins.
 If the Prometheus plugin requests a Jenkins restart after changing settings, restart Jenkins so the `/prometheus` endpoint is served correctly. The endpoint will be available at `http://:/prometheus`.
Verify the metrics endpoint
When active, the `/prometheus` endpoint returns plain text in Prometheus exposition format. Example (truncated):
```text theme={null}
# HELP jvm_memory_bytes_used Used bytes of a given JVM memory area.
# TYPE jvm_memory_bytes_used gauge
jvm_memory_bytes_used{area="heap",} 1.051688996E8
jvm_memory_used{area="nonheap",} 1.18338064E8
# HELP jvm_memory_pool_bytes_used Used bytes of a given JVM memory pool.
# TYPE jvm_memory_pool_bytes_used gauge
jvm_memory_pool_bytes_used{pool="Metaspace",} 8.5643168E7
jvm_memory_pool_bytes_used{pool="G1 Old Gen",} 1.02023168E8
# HELP jvm_memory_bytes_committed Committed (bytes) of a given JVM memory area.
# TYPE jvm_memory_bytes_committed gauge
jvm_memory_bytes_committed{area="heap",} 3.5651584E8
```
Run Prometheus + Grafana (example Docker Compose)
This Docker Compose example brings up Prometheus and Grafana. Grafana is configured with `admin` / `password` credentials and is reachable on host port `8081`. Prometheus reads `/etc/prometheus/prometheus.yml` from the `./prometheus` folder.
```yaml theme={null}
version: '3.8'
services:
prometheus:
image: prom/prometheus
container_name: prometheus
command:
- '--config.file=/etc/prometheus/prometheus.yml'
ports:
- 9090:9090
restart: unless-stopped
volumes:
- ./prometheus:/etc/prometheus
- prom_data:/prometheus
grafana:
image: grafana/grafana
container_name: grafana
ports:
- 8081:3000
restart: unless-stopped
environment:
- GF_SECURITY_ADMIN_USER=admin
- GF_SECURITY_ADMIN_PASSWORD=password
volumes:
- ./grafana:/etc/grafana/provisioning/datasources
volumes:
prom_data:
```
Prometheus configuration: `prometheus.yml`
Place this minimal `prometheus.yml` in `./prometheus/prometheus.yml` (update the Jenkins target to your host/IP):
```yaml theme={null}
global:
scrape_interval: 15s
scrape_configs:
- job_name: 'prometheus'
metrics_path: /metrics
static_configs:
- targets: ['localhost:9090']
- job_name: 'jenkins'
metrics_path: /prometheus
scheme: http
static_configs:
- targets: ['64.227.187.25:8080'] # replace with your Jenkins host:port
```
Start the stack
```bash theme={null}
# from the directory containing docker-compose.yml
docker compose up -d
```
Example Docker Compose output:
```text theme={null}
[+] Running 4/4
✔ Network prometheus-grafana_default Created 0.1s
✔ Volume "prometheus-grafana_prom_data" Created 0.0s
✔ Container prometheus Started 0.6s
✔ Container grafana Started 0.6s
```
Verify Prometheus is scraping Jenkins
* Open Prometheus at `http://:9090` (or `http://localhost:9090`).
* Navigate to Status → Targets and confirm the `jenkins` job target is UP and scraping the `/prometheus` path.
Exploring Jenkins metrics in Prometheus
Common metric names exposed by the plugin:
| Metric | What it measures | Example query |
| ------------------------------- | --------------------------------------- | ----------------------------------------------- |
| `jenkins_job_count_value` | Total number of jobs | `jenkins_job_count_value` |
| `jenkins_plugins_active` | Number of active plugins (gauge) | `jenkins_plugins_active` |
| `jenkins_plugins_withUpdate` | Plugins with available updates (gauge) | `jenkins_plugins_withUpdate` |
| `jenkins_job_queuing_duration` | Job queue durations (histogram/summary) | `jenkins_job_queuing_duration{quantile="0.95"}` |
| `jenkins_executor_in_use_value` | Executors currently in use | `jenkins_executor_in_use_value` |
Example Prometheus expression queries:
```text theme={null}
jenkins_job_count_value
jenkins_plugins_withUpdate
jenkins_job_queuing_duration{quantile="0.95"}
```
Prometheus sample metric lines:
```text theme={null}
jenkins_job_count_value{instance="64.227.187.25:8080", job="jenkins"} 22
jenkins_plugins_withUpdate{instance="64.227.187.25:8080", job="jenkins"} 77
```
Add Prometheus as a Grafana data source
1. Log in to Grafana at `http://:8081` using the admin credentials.
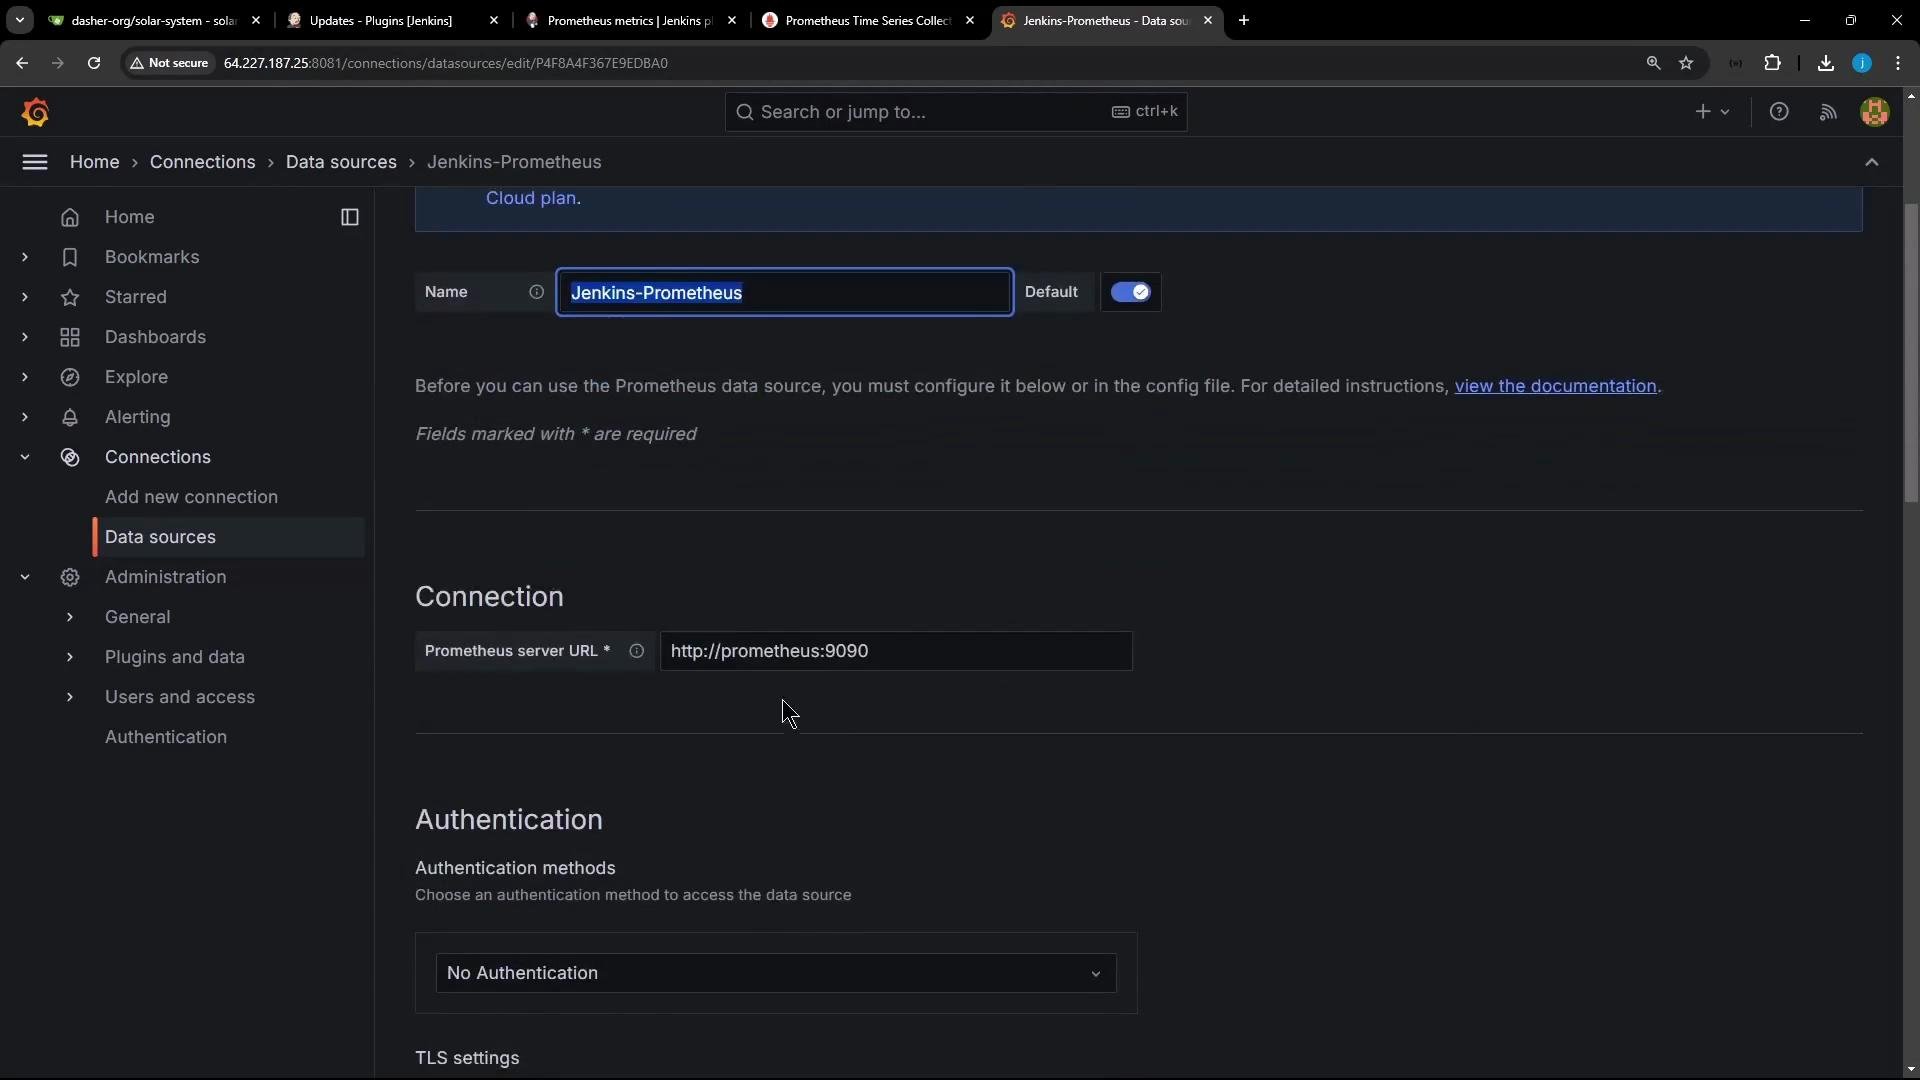
2. Add a new Prometheus data source. If Grafana and Prometheus are in the same Docker network, use `http://prometheus:9090`. If accessing externally, use `http://:9090`.
If the Prometheus plugin requests a Jenkins restart after changing settings, restart Jenkins so the `/prometheus` endpoint is served correctly. The endpoint will be available at `http://:/prometheus`.
Verify the metrics endpoint
When active, the `/prometheus` endpoint returns plain text in Prometheus exposition format. Example (truncated):
```text theme={null}
# HELP jvm_memory_bytes_used Used bytes of a given JVM memory area.
# TYPE jvm_memory_bytes_used gauge
jvm_memory_bytes_used{area="heap",} 1.051688996E8
jvm_memory_used{area="nonheap",} 1.18338064E8
# HELP jvm_memory_pool_bytes_used Used bytes of a given JVM memory pool.
# TYPE jvm_memory_pool_bytes_used gauge
jvm_memory_pool_bytes_used{pool="Metaspace",} 8.5643168E7
jvm_memory_pool_bytes_used{pool="G1 Old Gen",} 1.02023168E8
# HELP jvm_memory_bytes_committed Committed (bytes) of a given JVM memory area.
# TYPE jvm_memory_bytes_committed gauge
jvm_memory_bytes_committed{area="heap",} 3.5651584E8
```
Run Prometheus + Grafana (example Docker Compose)
This Docker Compose example brings up Prometheus and Grafana. Grafana is configured with `admin` / `password` credentials and is reachable on host port `8081`. Prometheus reads `/etc/prometheus/prometheus.yml` from the `./prometheus` folder.
```yaml theme={null}
version: '3.8'
services:
prometheus:
image: prom/prometheus
container_name: prometheus
command:
- '--config.file=/etc/prometheus/prometheus.yml'
ports:
- 9090:9090
restart: unless-stopped
volumes:
- ./prometheus:/etc/prometheus
- prom_data:/prometheus
grafana:
image: grafana/grafana
container_name: grafana
ports:
- 8081:3000
restart: unless-stopped
environment:
- GF_SECURITY_ADMIN_USER=admin
- GF_SECURITY_ADMIN_PASSWORD=password
volumes:
- ./grafana:/etc/grafana/provisioning/datasources
volumes:
prom_data:
```
Prometheus configuration: `prometheus.yml`
Place this minimal `prometheus.yml` in `./prometheus/prometheus.yml` (update the Jenkins target to your host/IP):
```yaml theme={null}
global:
scrape_interval: 15s
scrape_configs:
- job_name: 'prometheus'
metrics_path: /metrics
static_configs:
- targets: ['localhost:9090']
- job_name: 'jenkins'
metrics_path: /prometheus
scheme: http
static_configs:
- targets: ['64.227.187.25:8080'] # replace with your Jenkins host:port
```
Start the stack
```bash theme={null}
# from the directory containing docker-compose.yml
docker compose up -d
```
Example Docker Compose output:
```text theme={null}
[+] Running 4/4
✔ Network prometheus-grafana_default Created 0.1s
✔ Volume "prometheus-grafana_prom_data" Created 0.0s
✔ Container prometheus Started 0.6s
✔ Container grafana Started 0.6s
```
Verify Prometheus is scraping Jenkins
* Open Prometheus at `http://:9090` (or `http://localhost:9090`).
* Navigate to Status → Targets and confirm the `jenkins` job target is UP and scraping the `/prometheus` path.
Exploring Jenkins metrics in Prometheus
Common metric names exposed by the plugin:
| Metric | What it measures | Example query |
| ------------------------------- | --------------------------------------- | ----------------------------------------------- |
| `jenkins_job_count_value` | Total number of jobs | `jenkins_job_count_value` |
| `jenkins_plugins_active` | Number of active plugins (gauge) | `jenkins_plugins_active` |
| `jenkins_plugins_withUpdate` | Plugins with available updates (gauge) | `jenkins_plugins_withUpdate` |
| `jenkins_job_queuing_duration` | Job queue durations (histogram/summary) | `jenkins_job_queuing_duration{quantile="0.95"}` |
| `jenkins_executor_in_use_value` | Executors currently in use | `jenkins_executor_in_use_value` |
Example Prometheus expression queries:
```text theme={null}
jenkins_job_count_value
jenkins_plugins_withUpdate
jenkins_job_queuing_duration{quantile="0.95"}
```
Prometheus sample metric lines:
```text theme={null}
jenkins_job_count_value{instance="64.227.187.25:8080", job="jenkins"} 22
jenkins_plugins_withUpdate{instance="64.227.187.25:8080", job="jenkins"} 77
```
Add Prometheus as a Grafana data source
1. Log in to Grafana at `http://:8081` using the admin credentials.
2. Add a new Prometheus data source. If Grafana and Prometheus are in the same Docker network, use `http://prometheus:9090`. If accessing externally, use `http://:9090`.
 Import a Jenkins dashboard
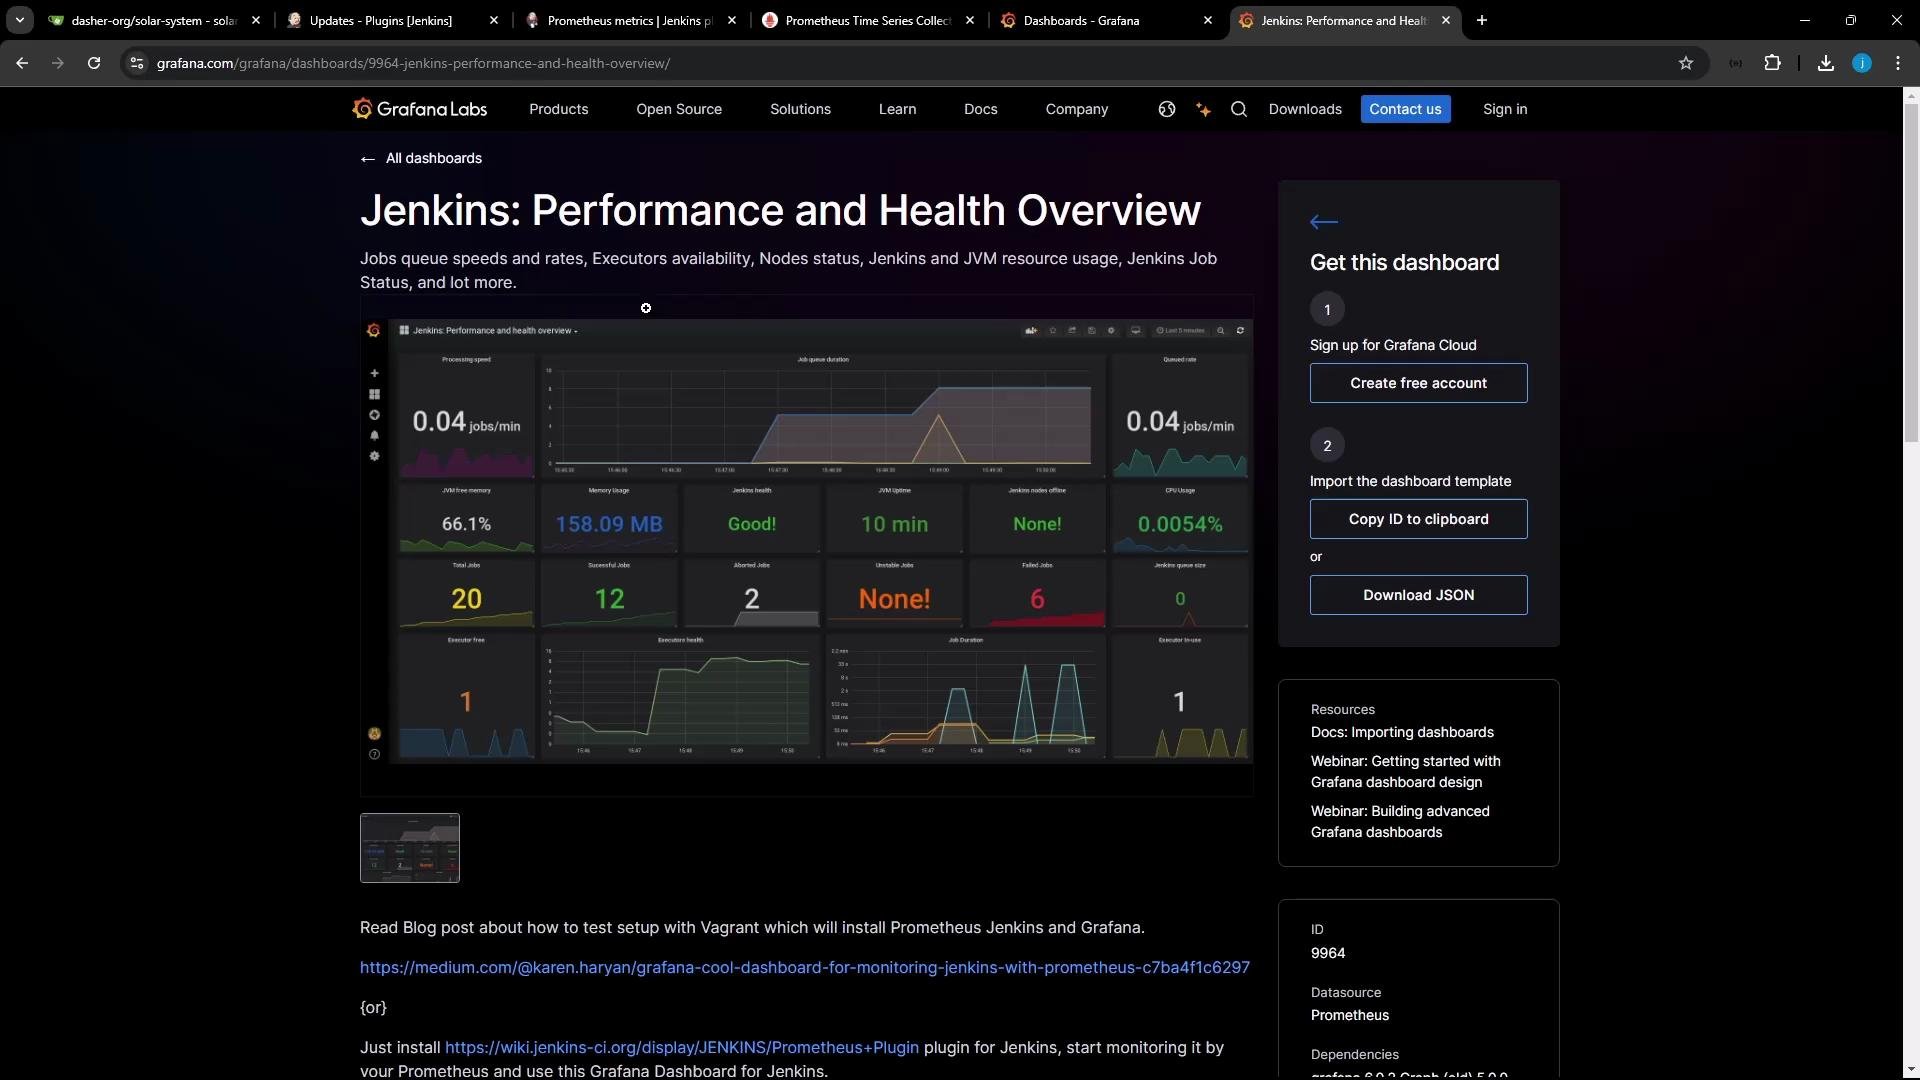
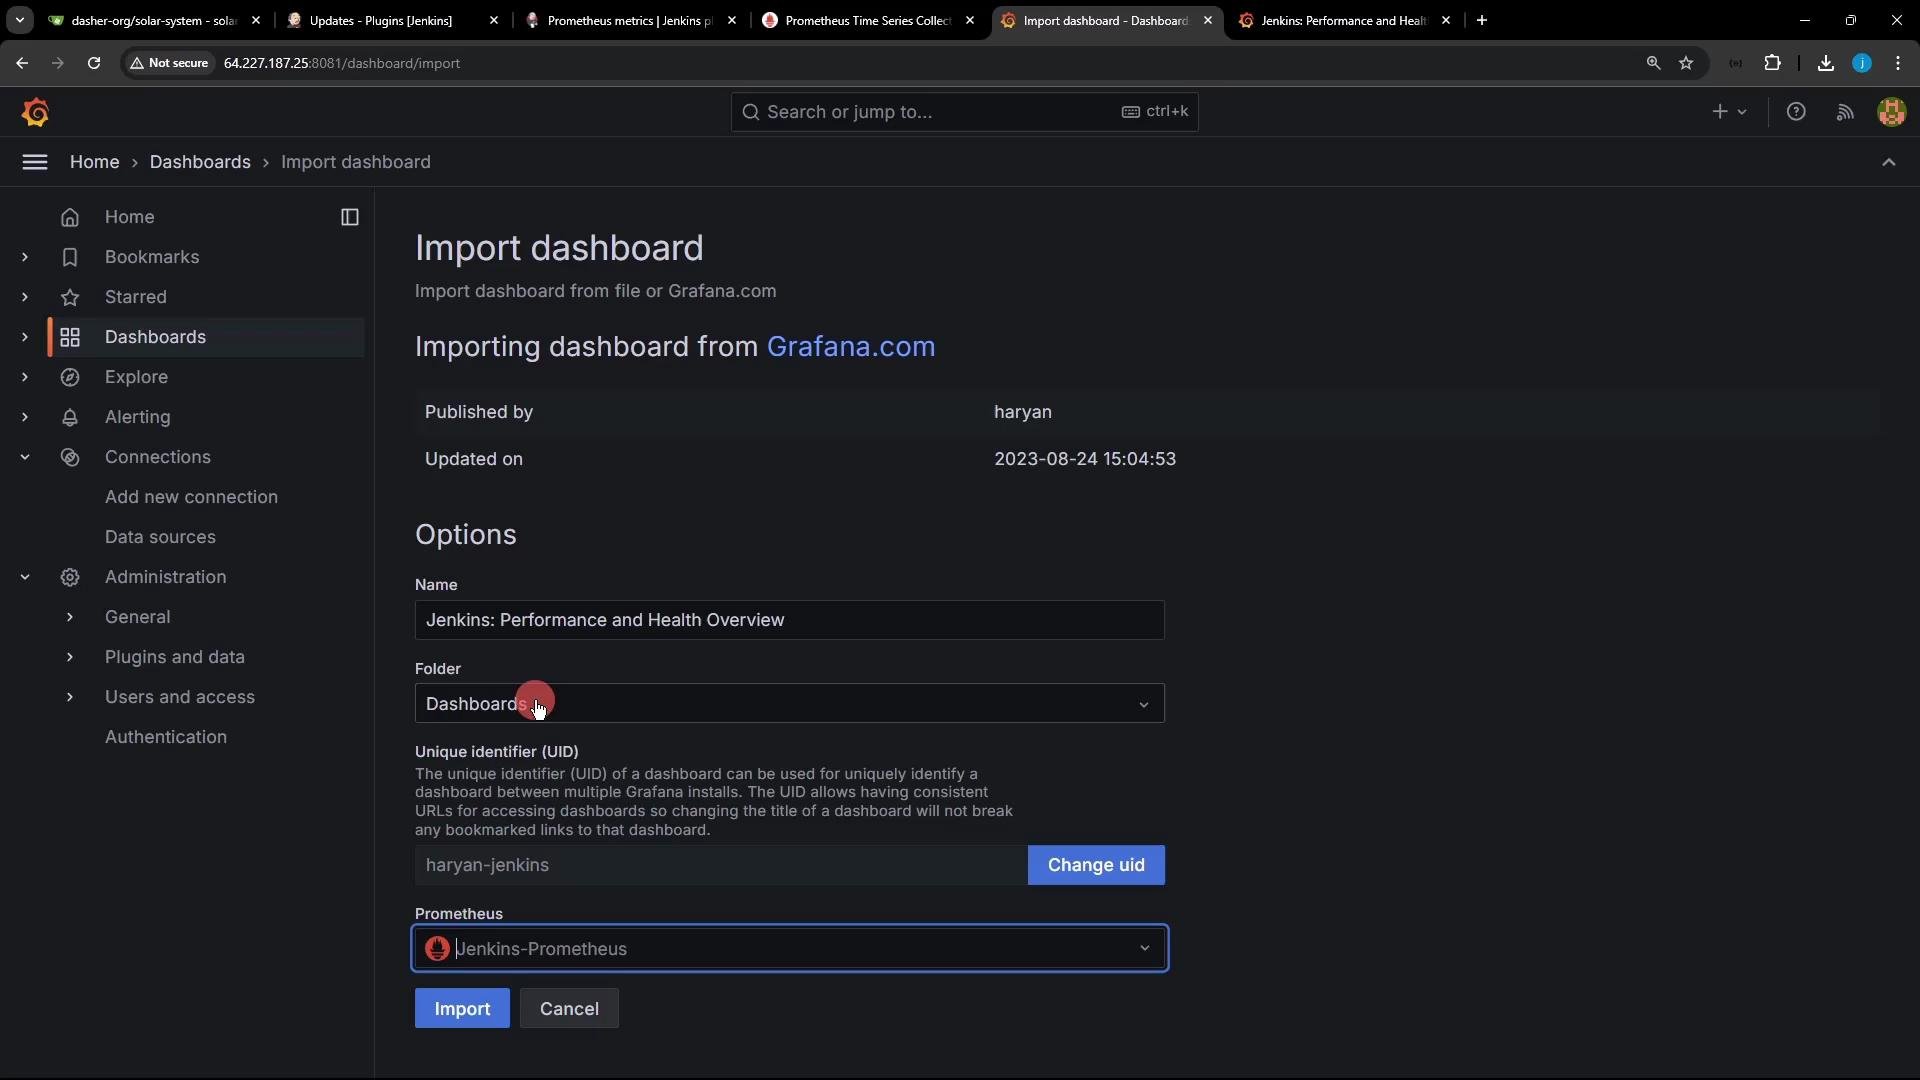
Grafana has community dashboards for Jenkins. Search Grafana Dashboards for "Jenkins" and import one that fits your needs — for example, dashboard ID 9964 ("Jenkins: Performance and Health Overview"). To import:
* In Grafana go to Dashboards → Import
* Enter dashboard ID `9964`, select a name and folder, and map the panels to your Prometheus data source
Import a Jenkins dashboard
Grafana has community dashboards for Jenkins. Search Grafana Dashboards for "Jenkins" and import one that fits your needs — for example, dashboard ID 9964 ("Jenkins: Performance and Health Overview"). To import:
* In Grafana go to Dashboards → Import
* Enter dashboard ID `9964`, select a name and folder, and map the panels to your Prometheus data source
 Generate test metric activity in Jenkins
To see activity in dashboards, create a simple Jenkins Pipeline job and run it repeatedly:
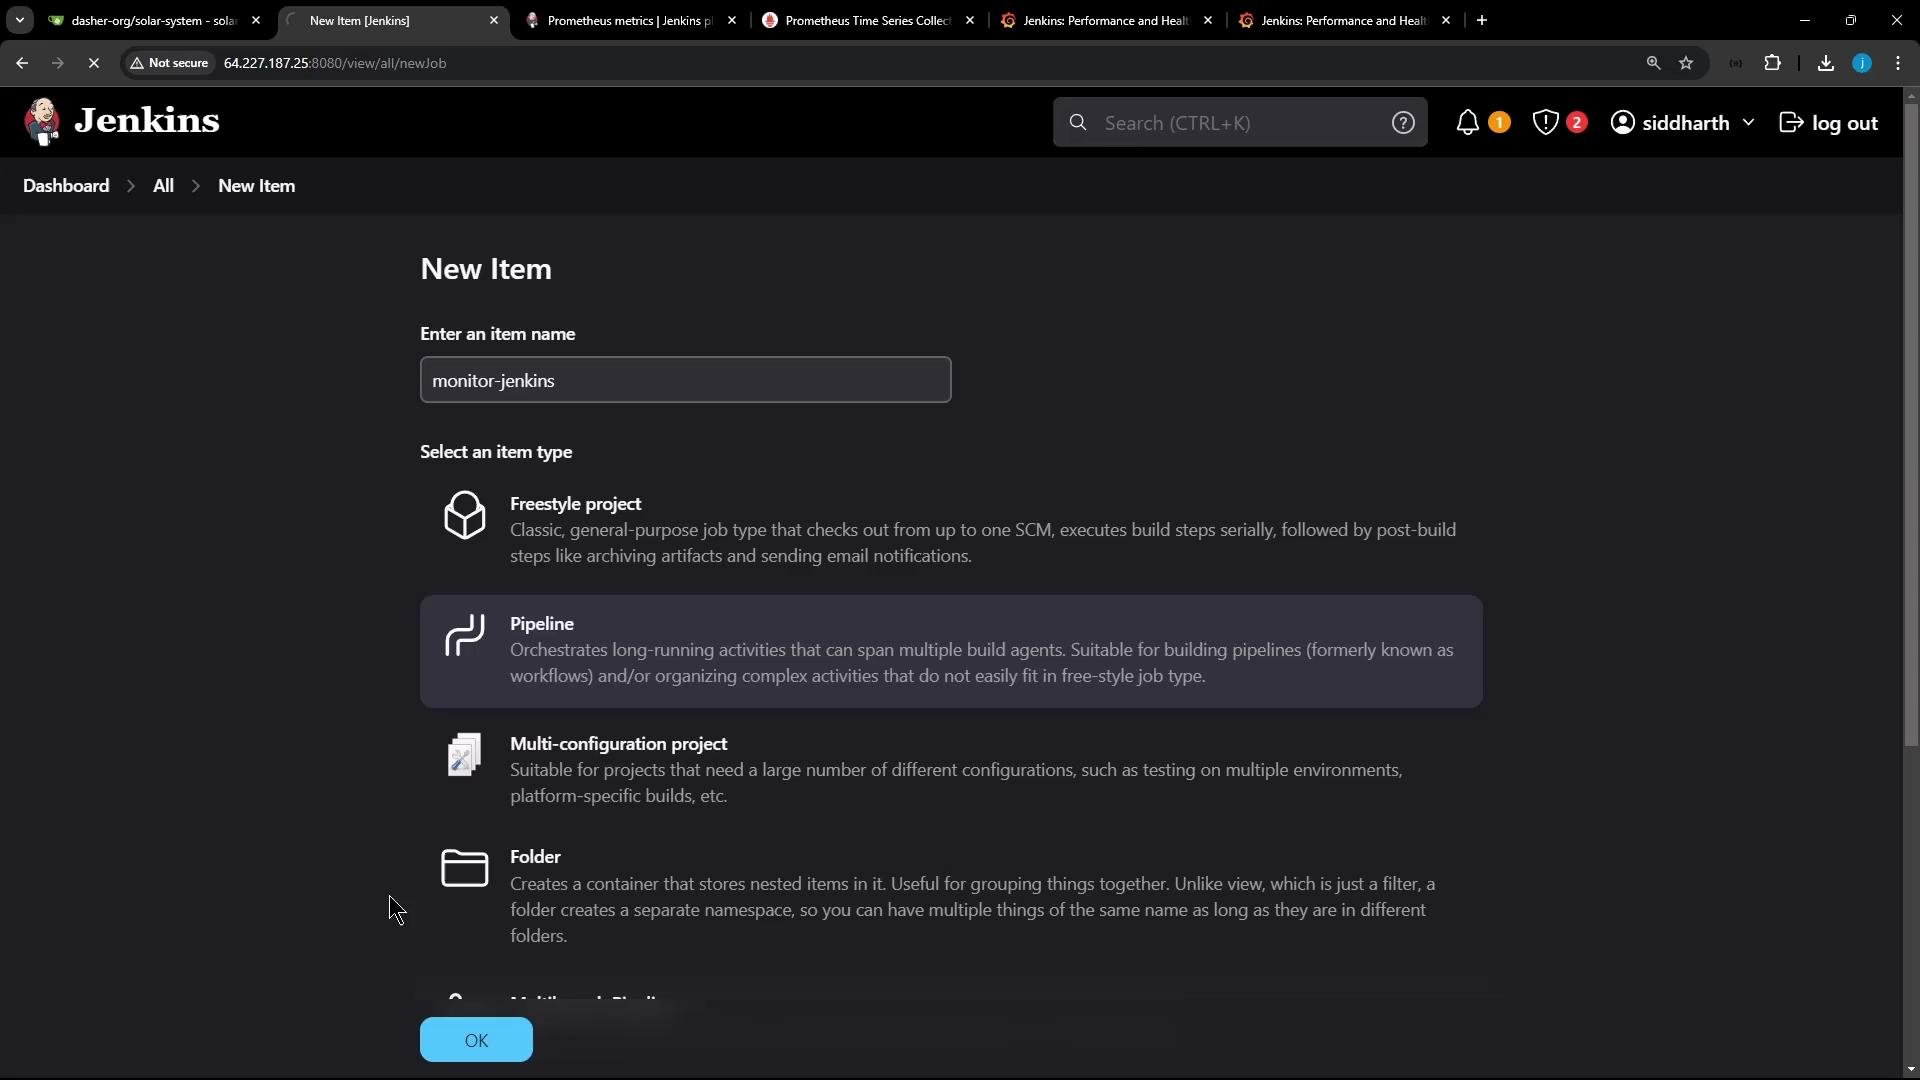
1. Create a new Pipeline job (e.g., `monitor-jenkins`).
2. Use an inline Pipeline script like:
```groovy theme={null}
node {
stage('Sleep') {
sh 'sleep 2'
}
}
node('ubuntu-docker-jdk17-node20') {
stage('Echo') {
sh 'echo "1s"'
}
}
```
Generate test metric activity in Jenkins
To see activity in dashboards, create a simple Jenkins Pipeline job and run it repeatedly:
1. Create a new Pipeline job (e.g., `monitor-jenkins`).
2. Use an inline Pipeline script like:
```groovy theme={null}
node {
stage('Sleep') {
sh 'sleep 2'
}
}
node('ubuntu-docker-jdk17-node20') {
stage('Echo') {
sh 'echo "1s"'
}
}
```
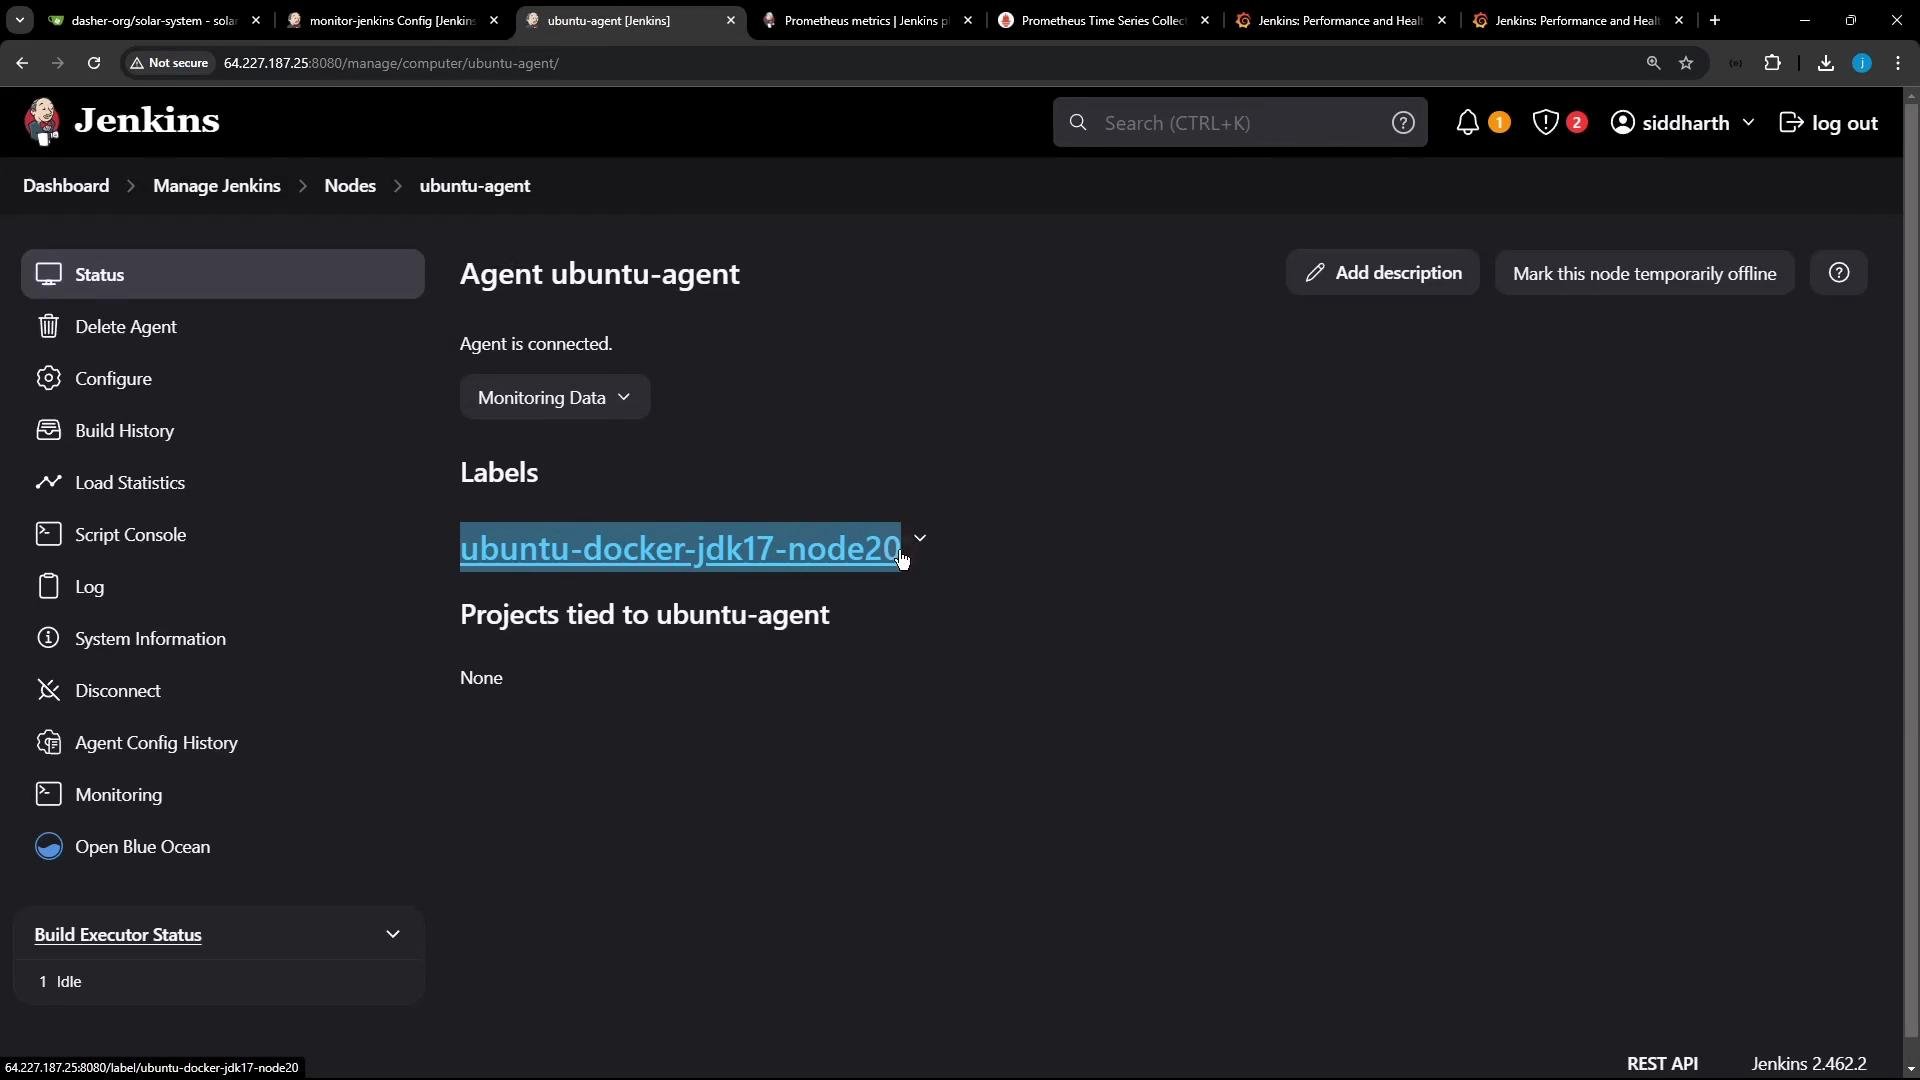
 Make sure the node label you reference exists and matches an available agent. The agent label can be verified on the agent details page:
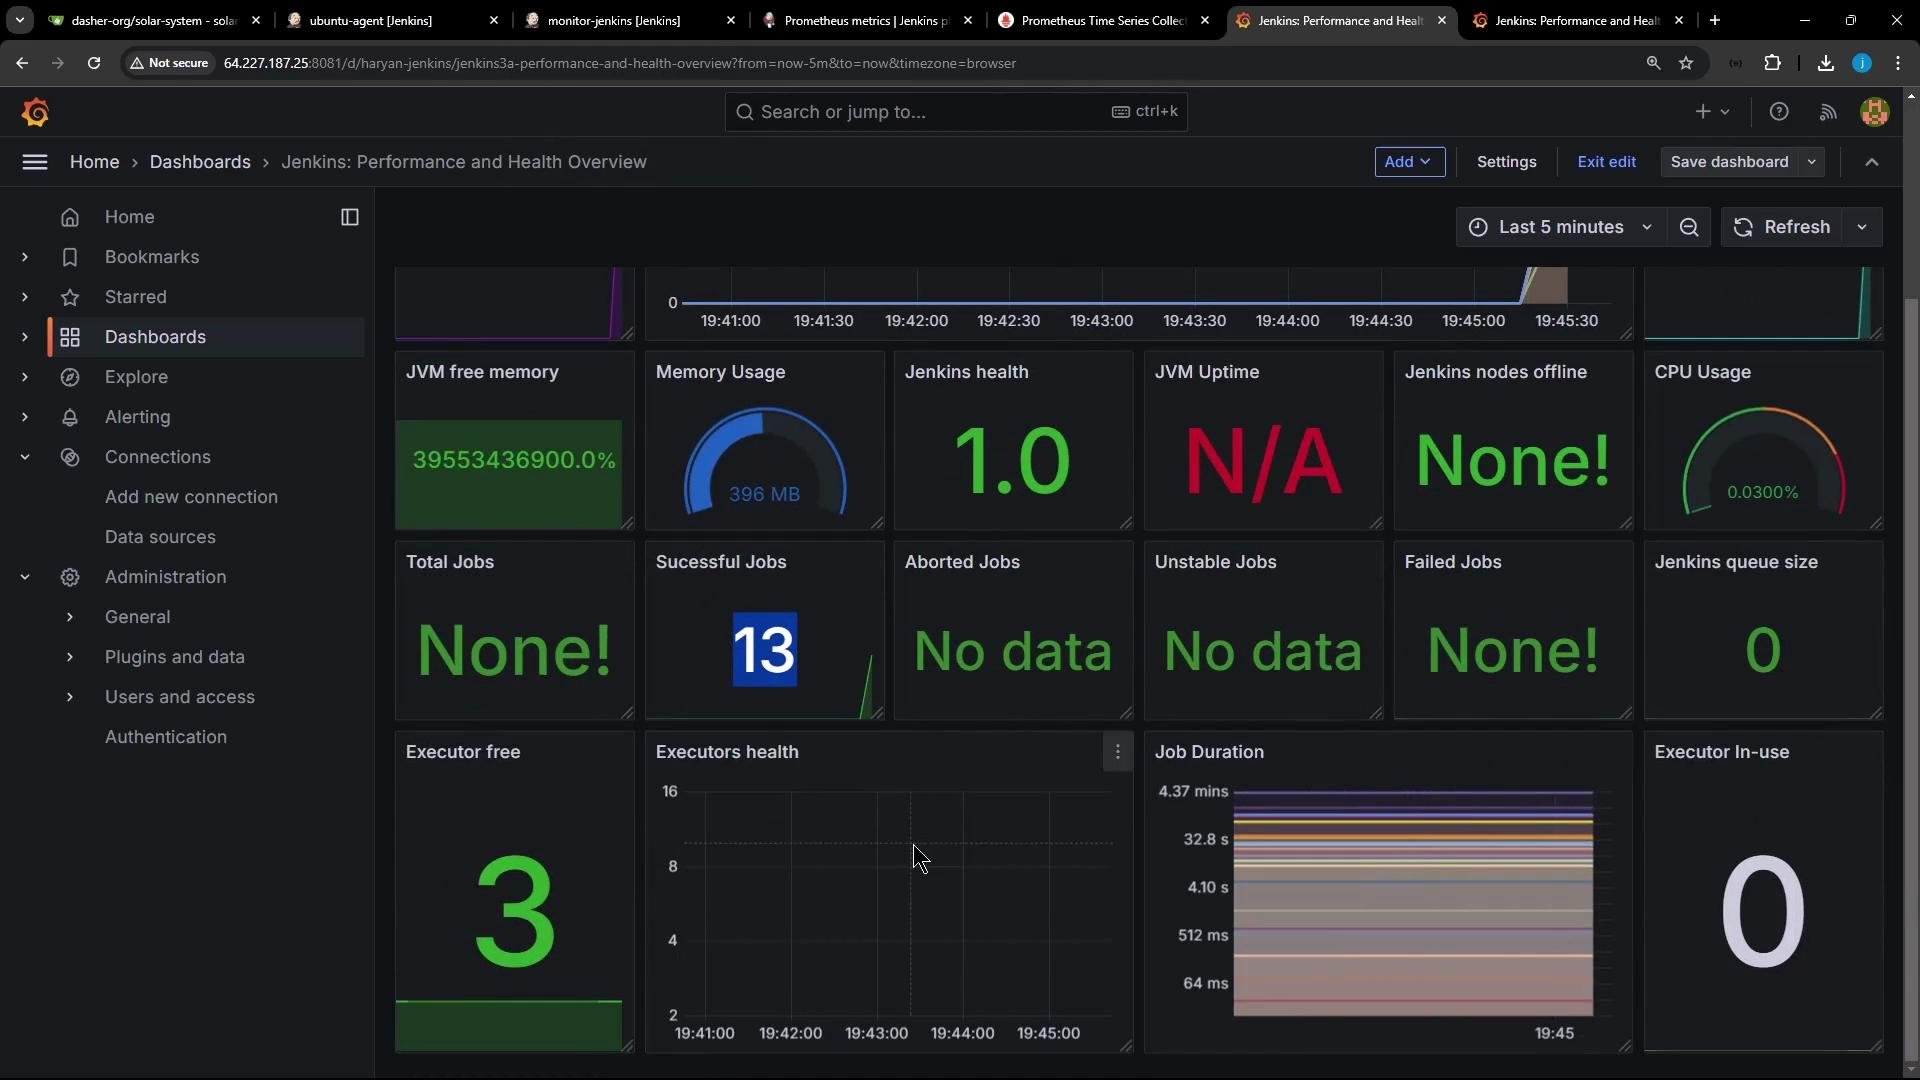
 Trigger the pipeline several times (Build Now). Prometheus will scrape the metrics at its configured interval and Grafana dashboards will begin to reflect the activity. You should see panels for JVM memory, CPU, job counts (total/successful/failed), executor usage, queue durations, and other Jenkins metrics. Customize panels (time series, gauge, heatmap, etc.) and refine PromQL queries to suit your monitoring and alerting needs.
 Prometheus summaries & quantiles
The Prometheus exposition may include quantiles for summaries/histograms. Example for queue durations:
```text theme={null}
jenkins_job_queuing_duration{instance="64.227.187.25:8080", job="jenkins", quantile="0.5"} 7.04
jenkins_job_queuing_duration{instance="64.227.187.25:8080", job="jenkins", quantile="0.95"} 13.0
```
These quantiles help with capacity planning and diagnosing issues like executor saturation or slow builds.
Further reading & references
* Jenkins Prometheus metrics plugin — plugin page (Manage Plugins in Jenkins)
* Prometheus exposition formats — [https://prometheus.io/docs/instrumenting/exposition\_formats/](https://prometheus.io/docs/instrumenting/exposition_formats/)
* Prometheus documentation — [https://prometheus.io/docs/](https://prometheus.io/docs/)
* Grafana dashboards search — [https://grafana.com/grafana/dashboards](https://grafana.com/grafana/dashboards)
* Example dashboard: Jenkins: Performance and Health Overview (ID 9964) — [https://grafana.com/grafana/dashboards/9964](https://grafana.com/grafana/dashboards/9964)
Summary
You now know how to:
* Expose Jenkins metrics via the Prometheus plugin at `/prometheus`
* Configure Prometheus to scrape Jenkins metrics
* Run Prometheus and Grafana with Docker Compose
* Add Prometheus as a Grafana data source and import a Jenkins dashboard
* Generate Jenkins activity to validate the metrics and dashboards
Use the dashboards to monitor Jenkins health, plan capacity, and create alerts when metrics indicate problems (e.g., queue growth or executor saturation).
Prometheus summaries & quantiles
The Prometheus exposition may include quantiles for summaries/histograms. Example for queue durations:
```text theme={null}
jenkins_job_queuing_duration{instance="64.227.187.25:8080", job="jenkins", quantile="0.5"} 7.04
jenkins_job_queuing_duration{instance="64.227.187.25:8080", job="jenkins", quantile="0.95"} 13.0
```
These quantiles help with capacity planning and diagnosing issues like executor saturation or slow builds.
Further reading & references
* Jenkins Prometheus metrics plugin — plugin page (Manage Plugins in Jenkins)
* Prometheus exposition formats — [https://prometheus.io/docs/instrumenting/exposition\_formats/](https://prometheus.io/docs/instrumenting/exposition_formats/)
* Prometheus documentation — [https://prometheus.io/docs/](https://prometheus.io/docs/)
* Grafana dashboards search — [https://grafana.com/grafana/dashboards](https://grafana.com/grafana/dashboards)
* Example dashboard: Jenkins: Performance and Health Overview (ID 9964) — [https://grafana.com/grafana/dashboards/9964](https://grafana.com/grafana/dashboards/9964)
Summary
You now know how to:
* Expose Jenkins metrics via the Prometheus plugin at `/prometheus`
* Configure Prometheus to scrape Jenkins metrics
* Run Prometheus and Grafana with Docker Compose
* Add Prometheus as a Grafana data source and import a Jenkins dashboard
* Generate Jenkins activity to validate the metrics and dashboards
Use the dashboards to monitor Jenkins health, plan capacity, and create alerts when metrics indicate problems (e.g., queue growth or executor saturation).