> ## Documentation Index
> Fetch the complete documentation index at: https://notes.kodekloud.com/llms.txt
> Use this file to discover all available pages before exploring further.
# EC2 Cloudwatch and Monitoring
> Learn to monitor Amazon EC2 instances using AWS CloudWatch for real-time insights into resource utilization, application performance, and operational health.
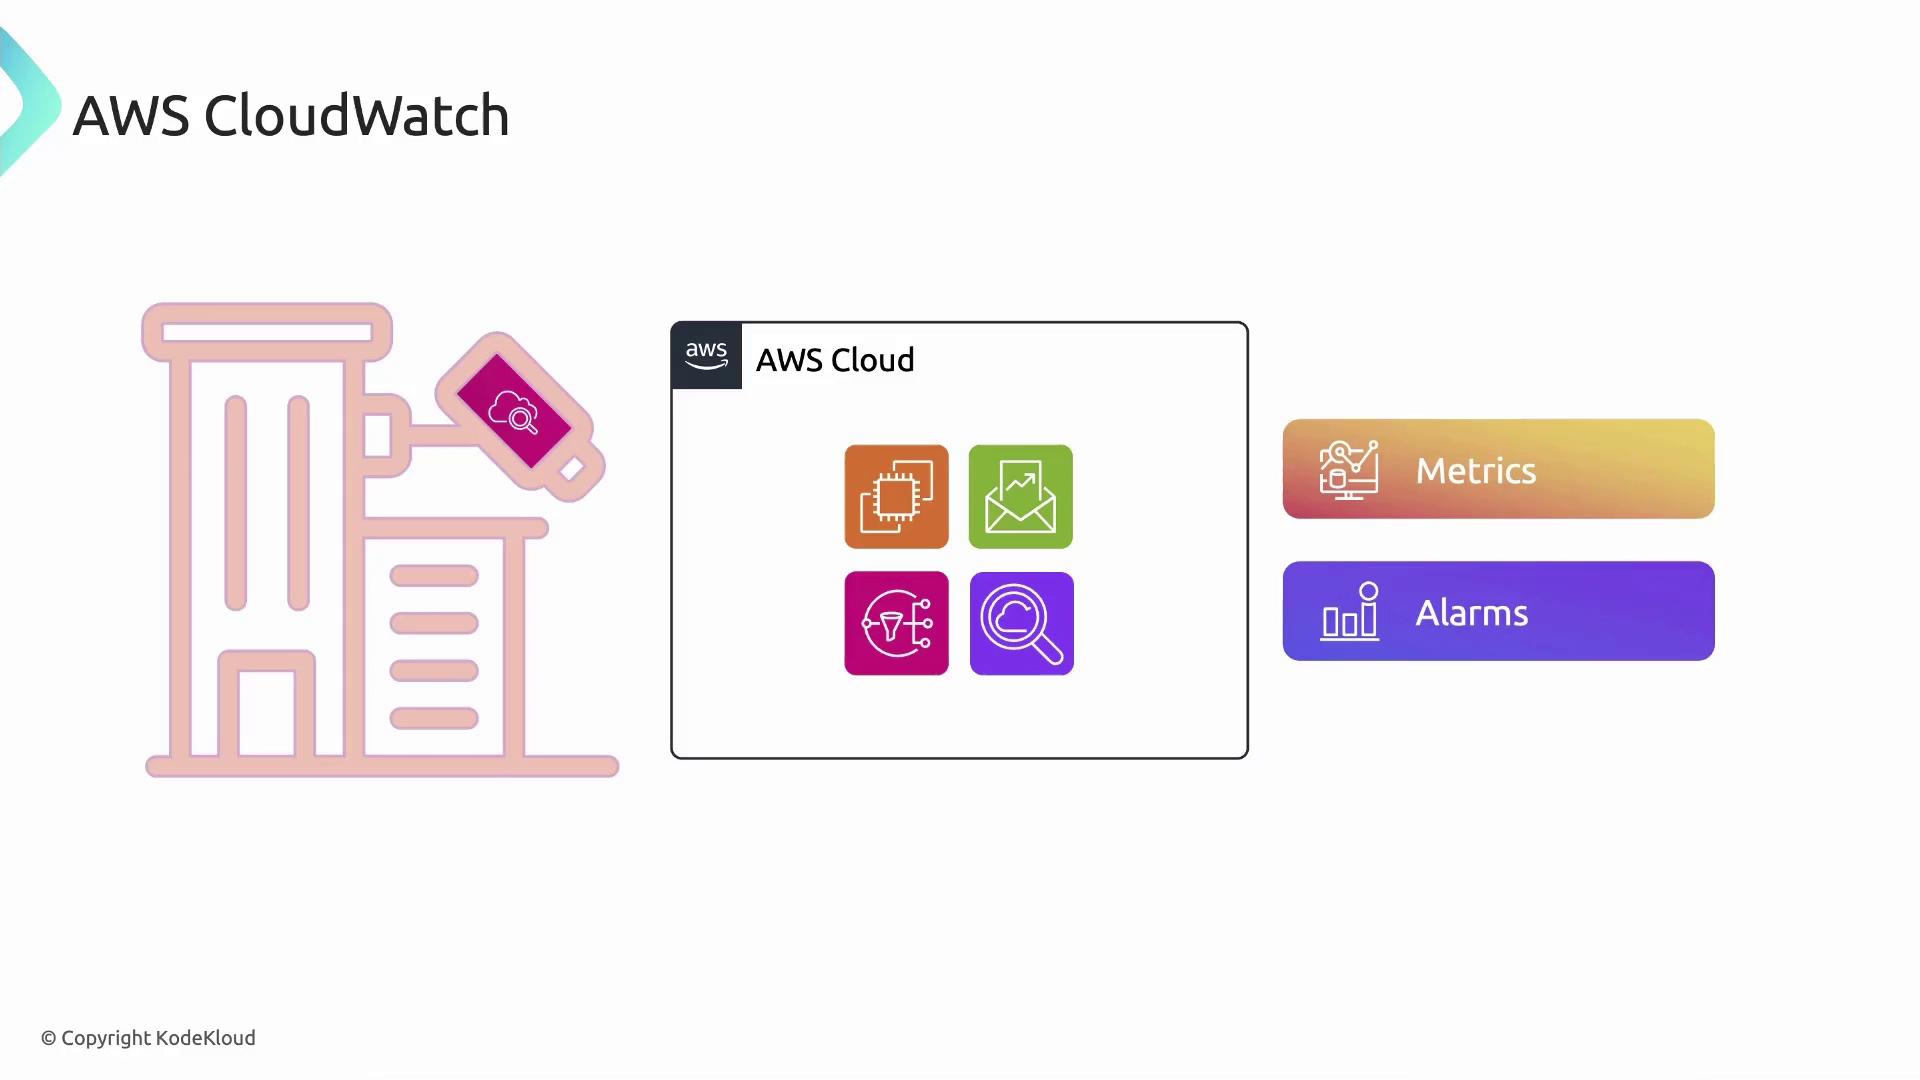
In this guide, you’ll learn how to monitor Amazon EC2 instances using AWS CloudWatch. Think of CloudWatch as the centralized control room in a sophisticated building-wide security system—it ingests data from cameras, sensors, and alarms, then provides real‐time insights into resource utilization, application performance, and operational health across your AWS environment.
***
## Table of Contents
1. [Metrics and Alarms](#metrics-and-alarms)
2. [CloudWatch Dashboards](#cloudwatch-dashboards)
3. [Data Retention & Detailed Monitoring](#data-retention--detailed-monitoring)
4. [CloudWatch Agent](#cloudwatch-agent)
5. [CloudWatch Logs](#cloudwatch-logs)
6. [Additional Resources](#additional-resources)
***
## Metrics and Alarms
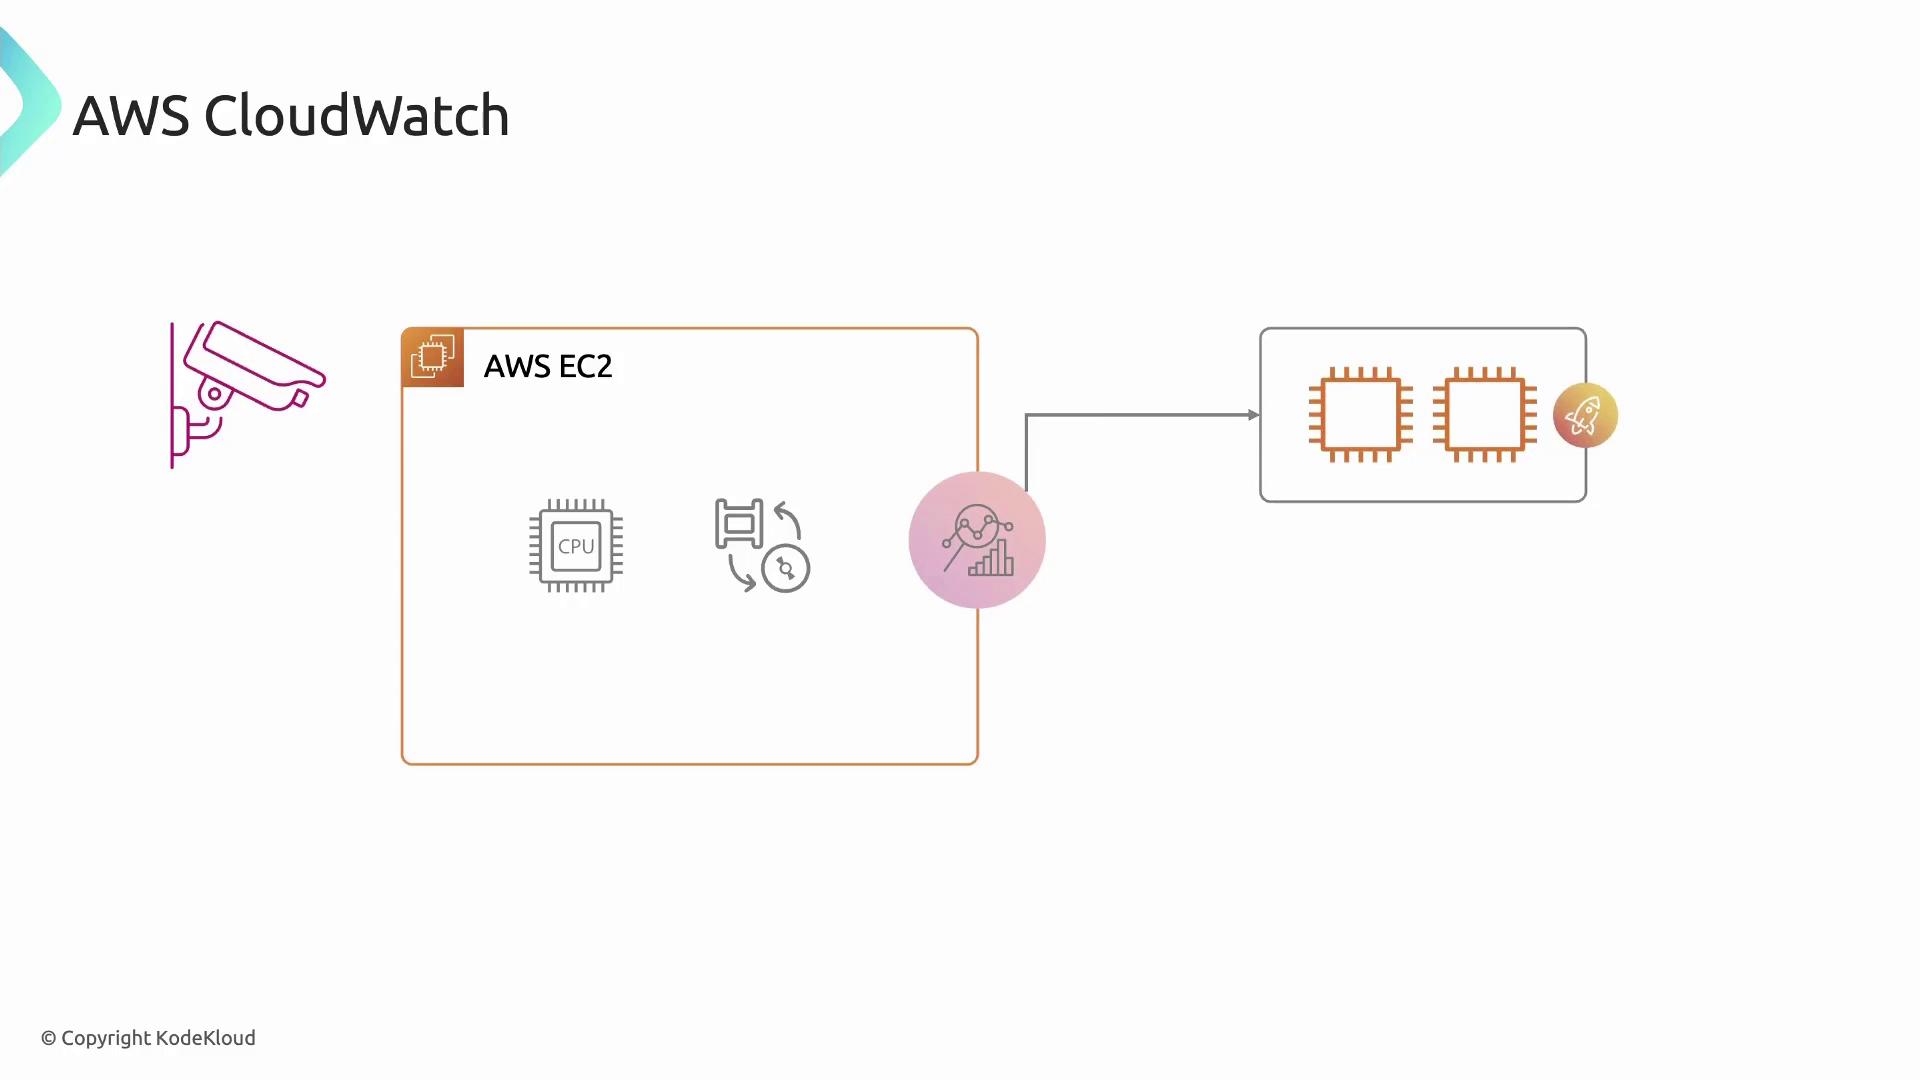
CloudWatch **metrics** are time-ordered data points representing system and application measurements—such as CPU utilization, disk I/O, or network traffic—collected from your EC2 instances.
* Create **alarms** to watch metrics and trigger automated actions (e.g., Auto Scaling) or notifications (e.g., Amazon SNS) when predefined thresholds are crossed.
* Use built-in metrics for EC2 or publish **custom metrics** for domain-specific KPIs.
### Common EC2 Metrics
| Metric Name | Description | Resolution (Default / Detailed) |
| ----------------- | ------------------------------------ | ------------------------------- |
| CPUUtilization | Percentage of allocated EC2 CPU used | 5 minutes / 1 minute |
| DiskReadOps | Number of disk read operations | 5 minutes / 1 minute |
| NetworkIn | Incoming network traffic (bytes) | 5 minutes / 1 minute |
| StatusCheckFailed | Instance health check failures | 5 minutes / 1 minute |
Enabling detailed monitoring incurs additional charges. Review the [CloudWatch pricing page](https://aws.amazon.com/cloudwatch/pricing/) before turning on one‐minute metrics.
***
## CloudWatch Dashboards
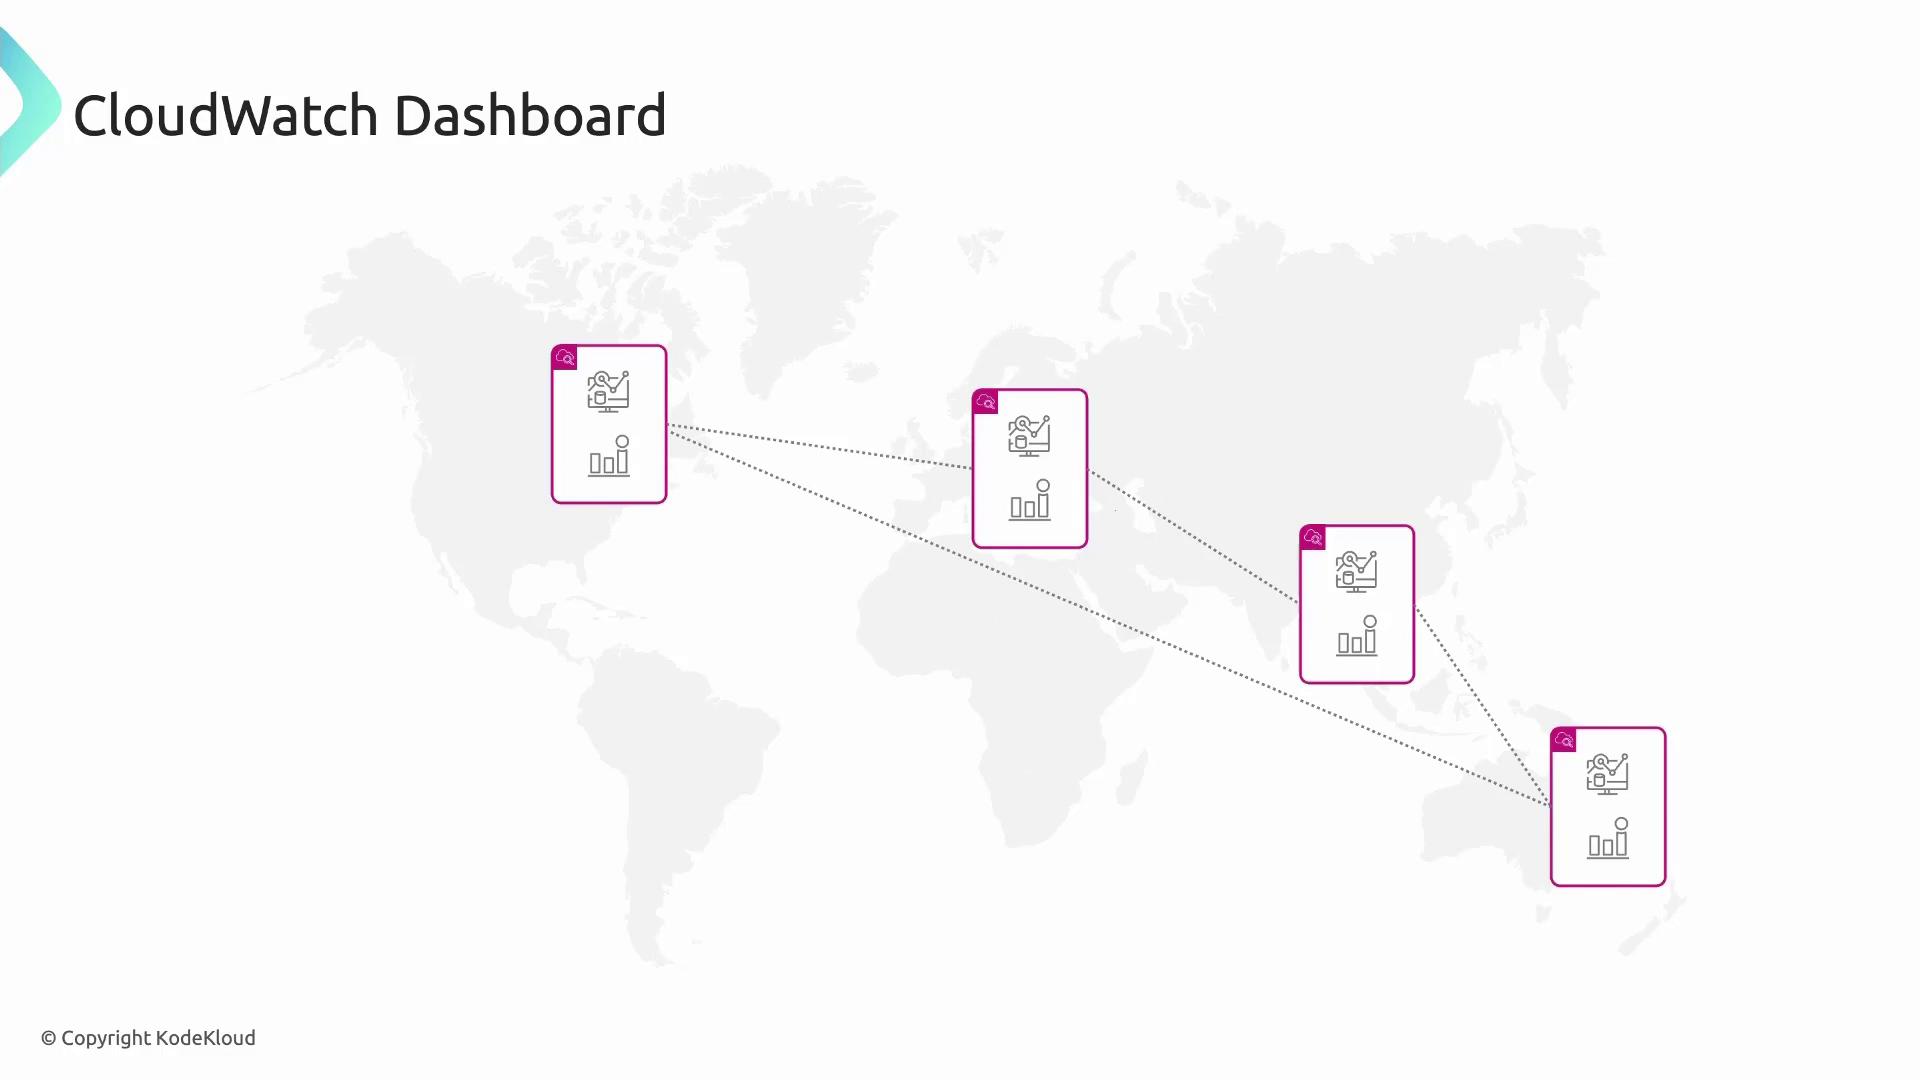
Dashboards let you unify metrics, alarms, and logs into a single customizable view. You can:
* Combine widgets (graphs, text, alarms) from multiple AWS accounts and regions.
* Share readonly dashboards with stakeholders for real‐time collaboration.
* Embed dashboards in internal portals or runbooks for incident response.
Use descriptive widget titles and color‐coded alarms to make critical metrics stand out on your dashboard.
***
## Data Retention & Detailed Monitoring
CloudWatch automatically retains metrics at different granularities:
| Time Period | Metric Resolution | Use Case |
| ----------------- | ----------------- | ------------------------------ |
| 0–3 hours | 1 minute | Near real-time troubleshooting |
| 3–15 days | 5 minutes | Short-term trend analysis |
| 15 days–63 days | 1 hour | Mid-term capacity planning |
| 63 days–15 months | 1 day | Long-term historical reporting |
**Detailed monitoring** (1-minute resolution) is available for EC2 instances and certain services at extra cost. Custom metrics follow the same retention model once published.
***
## CloudWatch Agent
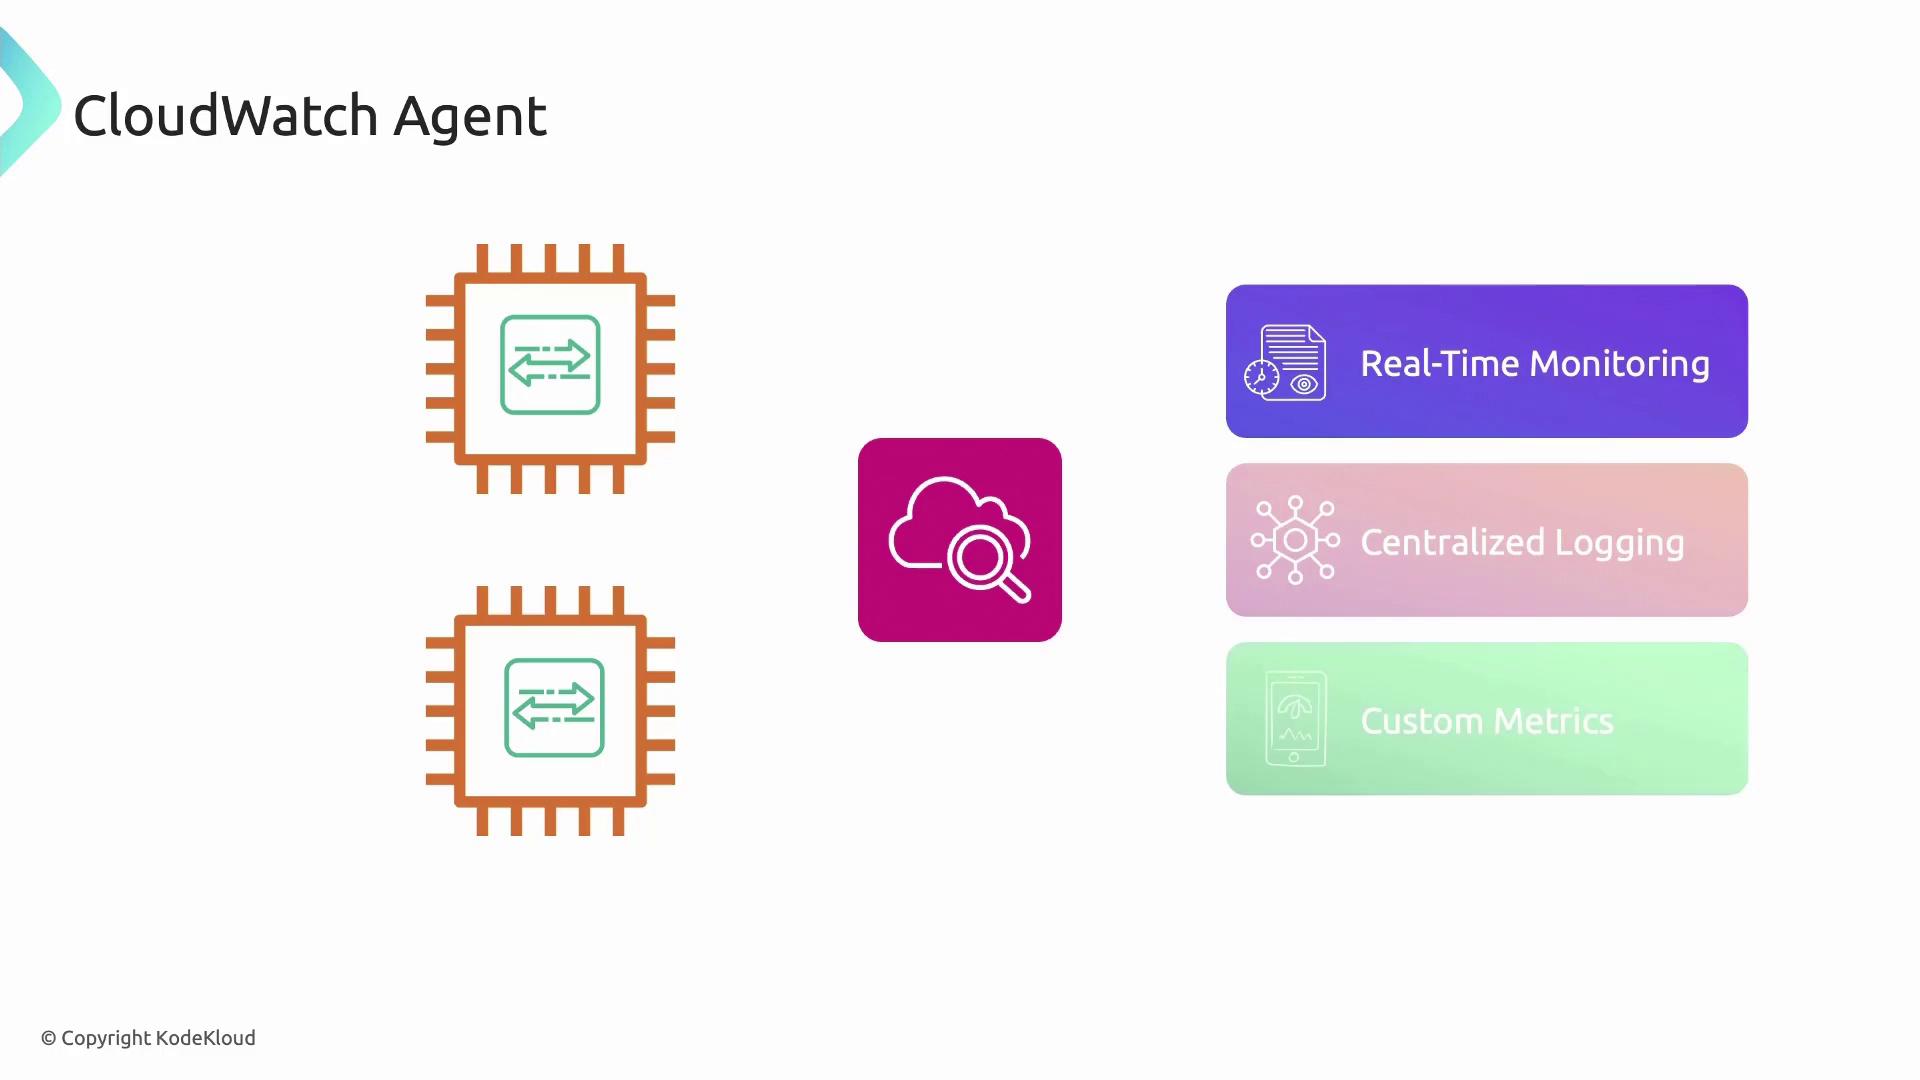
The CloudWatch Agent is lightweight software you install on EC2 instances (or on-premises servers) to collect system metrics, application logs, and custom data:
* Real-time, high-resolution metrics (CPU, memory, disk, network).
* Centralized log collection for Linux and Windows (supports JSON, syslog, IIS, and more).
* Custom metric publishing via configuration files or the GetMetricData API.
Configure the agent with the unified CloudWatch Agent configuration file (`amazon-cloudwatch-agent.json`) and deploy it using AWS Systems Manager for scale.
***
## CloudWatch Logs
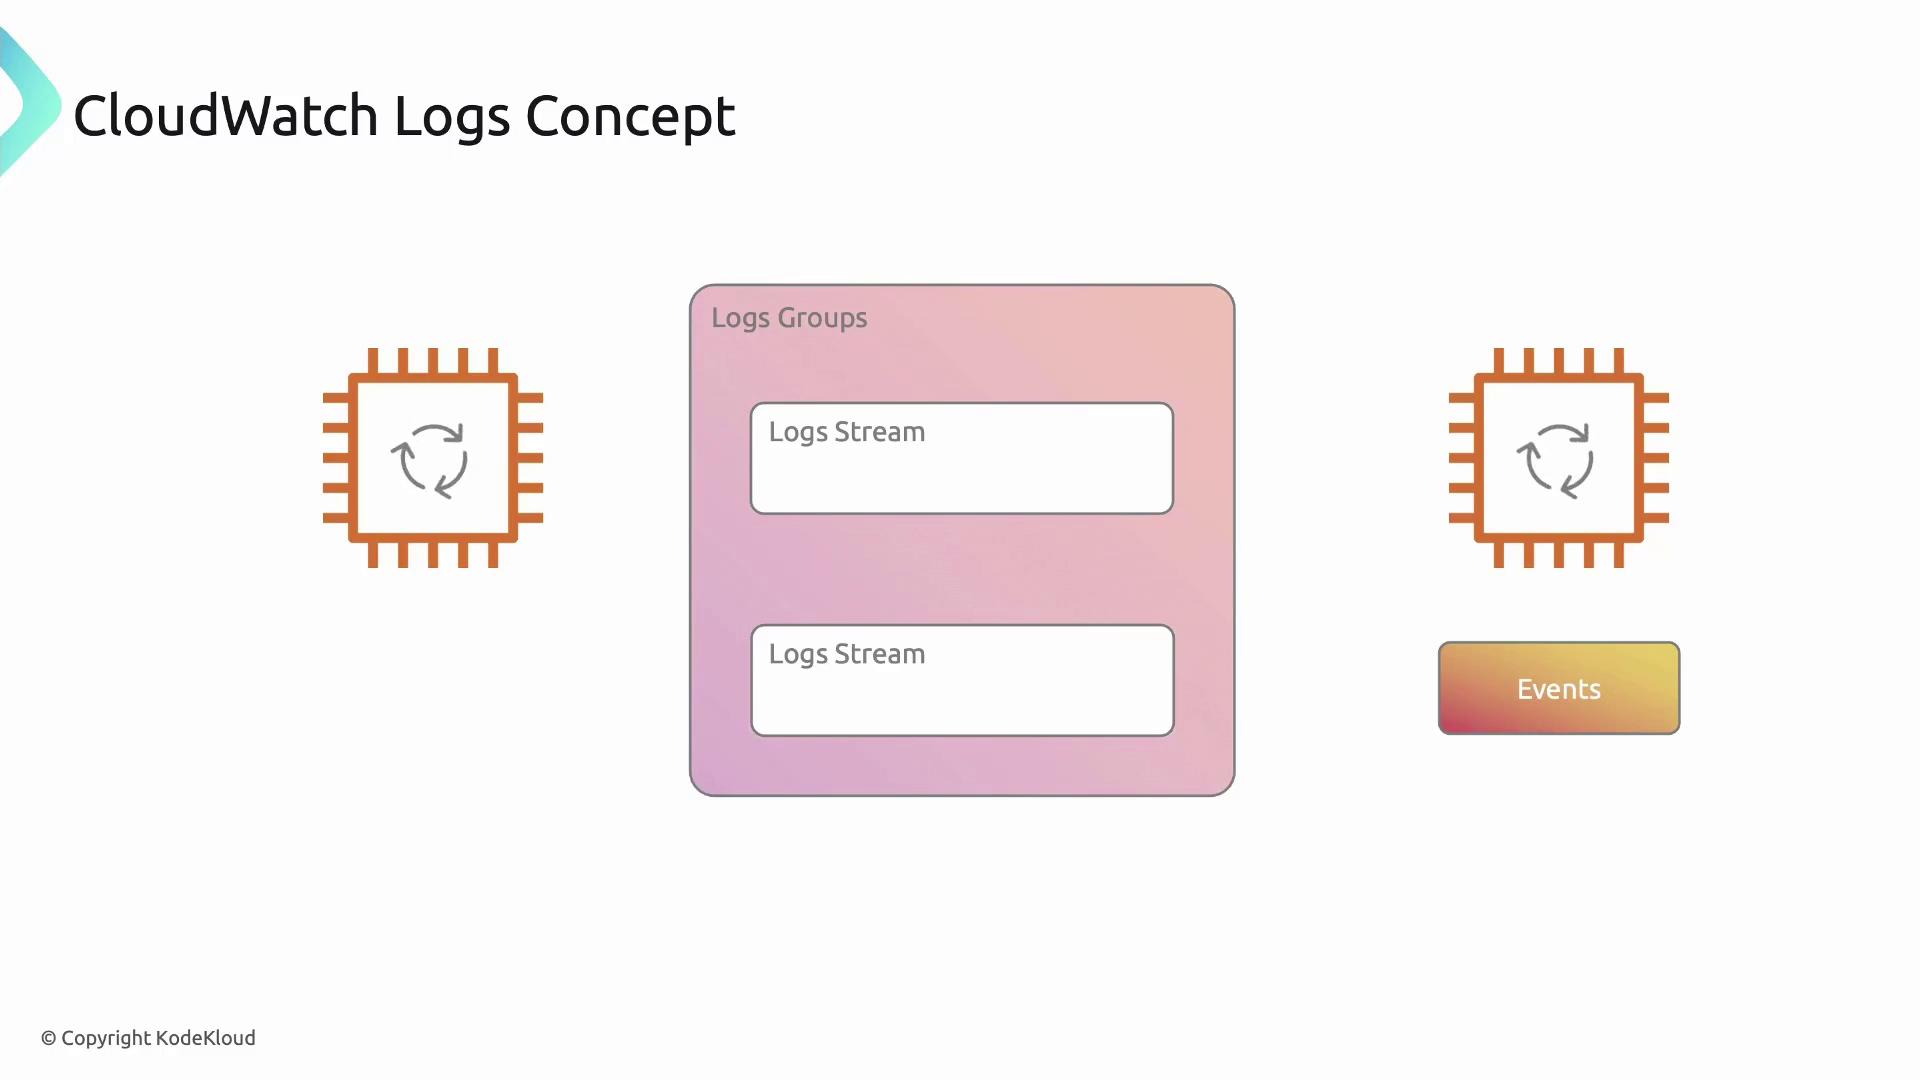
AWS CloudWatch Logs centralizes, monitors, and stores log data from EC2 instances, CloudTrail, VPC Flow Logs, and on-premises servers:
* **Log events**: Individual records with timestamps (e.g., application errors).
* **Log streams**: Ordered sequences of events from a single source.
* **Log groups**: Containers for related streams with shared retention, access controls, and metric filters.
Use **metric filters** to extract numeric data from logs and trigger CloudWatch alarms. Archive older logs to Amazon S3 for cost-effective, long-term storage.
***
## Additional Resources
* [Amazon CloudWatch User Guide](https://docs.aws.amazon.com/AmazonCloudWatch/latest/monitoring/WhatIsCloudWatch.html)
* [CloudWatch Agent Setup Guide](https://docs.aws.amazon.com/AmazonCloudWatch/latest/monitoring/Install-CloudWatch-Agent.html)
* [AWS Monitoring, Logging, and Tracing](https://aws.amazon.com/monitoring/)