This article explores the Horizontal Pod Autoscaler in Kubernetes and how it automates workload scaling, improving efficiency over manual scaling methods.
In this article, we explore the Horizontal Pod Autoscaler (HPA) feature in Kubernetes and explain how it automates the scaling of workloads. We’ll begin by examining the manual approach to scaling an application and then show how HPA streamlines this process.
As a Kubernetes administrator, you might manually scale your application to ensure it has enough resources during traffic spikes. Consider the following deployment configuration:
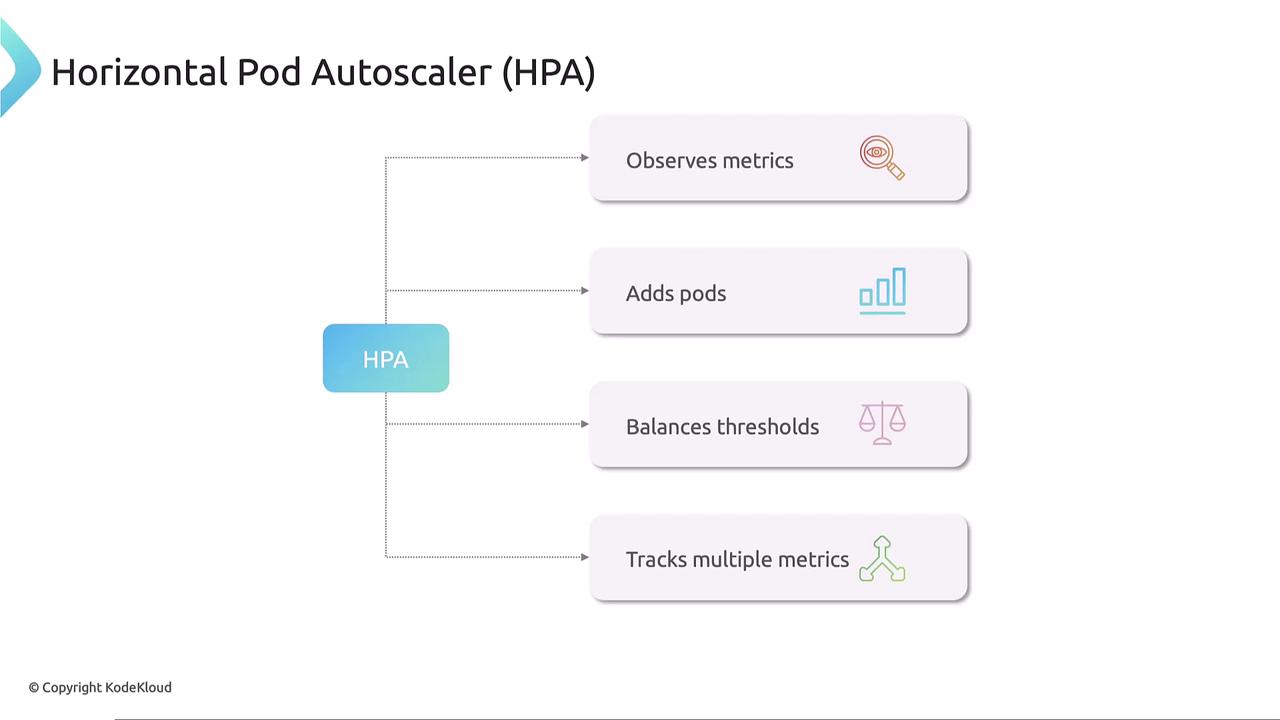
To address the shortcomings of manual scaling, Kubernetes offers the Horizontal Pod Autoscaler (HPA). HPA continuously monitors pod metrics—such as CPU, memory, or custom metrics—using the metrics-server. Based on these metrics, HPA automatically adjusts the number of pod replicas in a deployment, stateful set, or replica set. When resource usage exceeds a preset threshold, HPA increases the pod count; when usage declines, it scales down to conserve resources.
For example, with the nginx deployment above, you can create an HPA by running the command below. This command configures the “my-app” deployment to maintain 50% CPU utilization, scaling the number of pods between 1 and 10:
Kubernetes will then create an HPA that monitors the CPU metrics (using the pod’s 500 mCPU limit) via the metrics-server. If the average CPU utilization exceeds 50%, HPA adjusts the replica count to meet demand without manual input.To review the status of your HPA, use:
Copy
$ kubectl get hpa
This command shows the current CPU usage, threshold set, and the number of replicas—ensuring that pod counts remain within the defined limits. When the HPA is no longer needed, you can remove it with:
This configuration ensures that the HPA monitors the CPU utilization of the “my-app” deployment, automatically adjusting the replica count as needed. Note that HPA, integrated into Kubernetes since version 1.23, relies on the metrics-server to obtain resource utilization data.
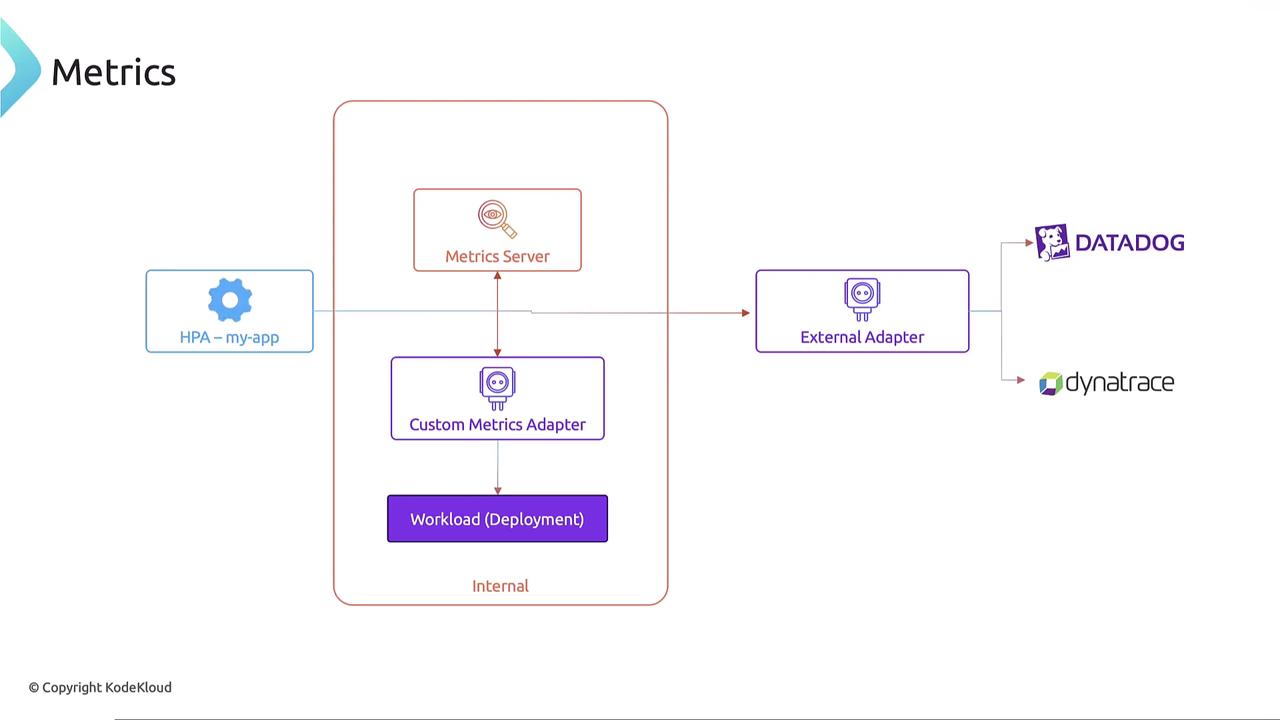
Kubernetes supports not only the internal metrics-server for collecting CPU or memory metrics but also custom metrics adapters. These adapters can retrieve metrics from other internal sources or external metrics providers like Datadog or Dynatrace through an external adapter. For further details on advanced configurations, please explore our Kubernetes Autoscaling course.
This article provided a comprehensive overview of the Horizontal Pod Autoscaler (HPA) in Kubernetes. We discussed the drawbacks of manual scaling and demonstrated how HPA automates scaling based on real-time resource usage. Whether through imperative commands or declarative YAML configurations, HPA ensures that your applications can adapt dynamically to fluctuating workloads.For additional insights and hands-on experience, consider enrolling in our Kubernetes Autoscaling course.Happy scaling!