CKA Certification Course - Certified Kubernetes Administrator
Troubleshooting
Solution Control Plane Failure
In this lesson, we troubleshoot a control plane failure caused by a malfunctioning application deployment. We will methodically investigate the issue and apply the necessary corrections to restore cluster functionality.
Setting Up Helpful Shortcuts and Autocompletion
Before diving into troubleshooting, ensure that you have configured an alias for kubectl and enabled autocompletion to speed up command entry. Execute the following commands:
source <(kubectl completion bash) # Enable autocompletion in the current shell
echo "source <(kubectl completion bash)" >> ~/.bashrc # Persist autocompletion in your bash shell

alias k=kubectl
complete -F __start_kubectl k
Now you can use commands like kubectl get ... or simply k ... with autocompletion to improve your workflow.
Investigating the Application Deployment
The first step is to verify the cluster node statuses:
root@controlplane:~# kubectl get nodes
NAME           STATUS   ROLES                  AGE   VERSION
controlplane   Ready    control-plane,master   21m   v1.20.0
Next, examine the deployment. Although the app is deployed, the pod remains unready:
root@controlplane:~# kubectl get deploy
NAME   READY   UP-TO-DATE   AVAILABLE   AGE
app    0/1     1            0           4m34s
Review the deployment details:
root@controlplane:~# kubectl describe deploy app
Name:                   app
Namespace:              default
CreationTimestamp:      Fri, 22 Apr 2022 22:11:45 +0000
Labels:                 <none>
Annotations:            deployment.kubernetes.io/revision: 1
Selector:               app=app
Replicas:               1 desired | 1 updated | 1 total | 0 available | 1 unavailable
StrategyType:           RollingUpdate
MinReadySeconds:        0
RollingUpdateStrategy:  25% max unavailable, 25% max surge
Pod Template:
  Labels:  app=app
  Containers:
   nginx:
     Image:        nginx:alpine
     Port:         <none>
     Host Port:    <none>
     Environment:  <none>
     Mounts:       <none>
  Volumes:        <none>
Conditions:
  Type           Status  Reason
  ----           ------  ------
  Available      False   MinimumReplicasUnavailable
  Progressing    True    ReplicaSetUpdated
OldReplicaSets:  <none>
NewReplicaSet:   app-586bddbc54 (1/1 replicas created)
Events:
  Type    Reason            Age    From                  Message
  ----    ------            ----   ----                  -------
  Normal  ScalingReplicaSet  4m54s  deployment-controller  Scaled up replica set app-586bddbc54 to 1
The ReplicaSet confirms that the pod is not ready:
root@controlplane:~# kubectl get rs
NAME               DESIRED   CURRENT   READY   AGE
app-586bddbc54    1         1         0       5m16s

root@controlplane:~# kubectl describe rs app-586bddbc54
Name:         app-586bddbc54
Namespace:    default
Selector:     app=app,pod-template-hash=586bddbc54
Labels:       app=app
              pod-template-hash=586bddbc54
Annotations:  deployment.kubernetes.io/desired-replicas: 1
              deployment.kubernetes.io/max-replicas: 2
              deployment.kubernetes.io/revision: 1
Controlled By:  Deployment/app
Replicas:        1 current / 1 desired
Pods Status:     0 Running / 1 Waiting / 0 Succeeded / 0 Failed
Pod Template:
  Labels:  app=app
          pod-template-hash=586bddbc54
  Containers:
   nginx:
    Image:      nginx:alpine
    Port:       <none>
    Host Port:  <none>
    Environment: <none>
    Mounts:     <none>
    Volumes:    <none>
Events:
  Type     Reason             Age               From                    Message
  ----     ------             ----              ----                    -------
  Normal   SuccessfulCreate   5m23s             replicaset-controller   Created pod: app-586bddbc54-hc779
Gather more details by describing the problematic pod:
root@controlplane:~# kubectl get pod
NAME                    READY   STATUS    RESTARTS   AGE
app-586bddbc54-hc779    0/1     Pending   0          5m40s

root@controlplane:~# kubectl describe pod app-586bddbc54-hc779
Name:         app-586bddbc54-hc779
Namespace:    default
Priority:     <none>
Node:         <none>
Labels:       app=app
              pod-template-hash=586bddbc54
Annotations:  <none>
Status:       Pending
IP:           <none>
Controlled By:  ReplicaSet/app-586bddbc54
Containers:
  nginx:
    Image:    nginx:alpine
    Port:     <none>
    Host Port: <none>
    Environment: <none>
    Mounts:
      /var/run/secrets/kubernetes.io/serviceaccount from default-token-9b8gf (ro)
Volumes:
  default-token-9b8gf:
    Type:        Secret (a volume populated by a Secret)
    SecretName:  default-token-9b8gf
    Optional:    false
QoS Class:   BestEffort
Node-Selectors: <none>
Tolerations:   node.kubernetes.io/not-ready:NoExecute op=Exists for 300s
               node.kubernetes.io/unreachable:NoExecute op=Exists for 300s
Events:      <none>
Note
Since the pod remains in the Pending state without an assigned node, the issue likely originates with the scheduler.
Troubleshooting the Kube Scheduler
Check the kube-scheduler pod within the kube-system namespace:

List the pods in the kube-system namespace to assess the scheduler’s status:
root@controlplane:~# kubectl get pods -n kube-system
NAME                                     READY   STATUS             RESTARTS   AGE
corerdns-74ff55c5b-fz97g                  1/1     Running            0          23m
corerdns-74ff55c5b-wfdmz                  1/1     Running            0          23m
etcd-controlplane                         1/1     Running            0          23m
kube-apiserver-controlplane               1/1     Running            0          23m
kube-controller-manager-controlplane      1/1     Running            0          23m
kube-flannel-ds-b85q5                     1/1     Running            0          23m
kube-proxy-pthlt                          1/1     Running            0          23m
kube-scheduler-controlplane               0/1     CrashLoopBackOff   6          6m28s
Describe the scheduler pod to identify the error:
root@controlplane:~# kubectl describe pod kube-scheduler-controlplane -n kube-system
...
Containers:
  kube-scheduler:
    Image:          k8s.gcr.io/kube-scheduler:v1.20.0
    Command:
      kube-schedulerrrr
      --authentication-kubeconfig=/etc/kubernetes/scheduler.conf
      --authorization-kubeconfig=/etc/kubernetes/scheduler.conf
      --bind-address=127.0.0.1
      --kubeconfig=/etc/kubernetes/scheduler.conf
      --leader-elect=true
      --port=0
State:              Waiting
Reason:             CrashLoopBackOff
Last State:
  Terminated:
    Reason:             ContainerCannotRun
    Message:           OCI runtime create failed: ... exec: "kube-schedulerrrr": executable file not found in $PATH
    Exit Code:         127
...
The error indicates an incorrect command—"kube-schedulerrrr"—which contains extra characters. Because the kube-scheduler is a static pod defined in /etc/kubernetes/manifests/kube-scheduler.yaml, edit that file to remove the extra characters. After saving the corrected file, check the pod's status again:
root@controlplane:~# vi /etc/kubernetes/manifests/kube-scheduler.yaml
Then verify:
root@controlplane:~# kubectl get pods -n kube-system
NAME                                    READY   STATUS                          RESTARTS   AGE
...
kube-scheduler-controlplane             0/1     CreateContainerConfigError      0          8s
Watch until the pod reaches the ready state:
root@controlplane:~# kubectl get pods -n kube-system --watch
NAME                                      READY   STATUS      RESTARTS   AGE
...
kube-scheduler-controlplane               0/1     Running     0          72s
Finally, review the logs to confirm the scheduler has started successfully:
root@controlplane:~# kubectl logs kube-scheduler -n kube-system
I0422 22:19:49.898295       1 serving.go:311] Generated self-signed cert in-memory
...
I0422 22:20:07.363748       1 leader election.go:253] successfully acquired lease kube-system/kube-scheduler
Scaling the Application Deployment
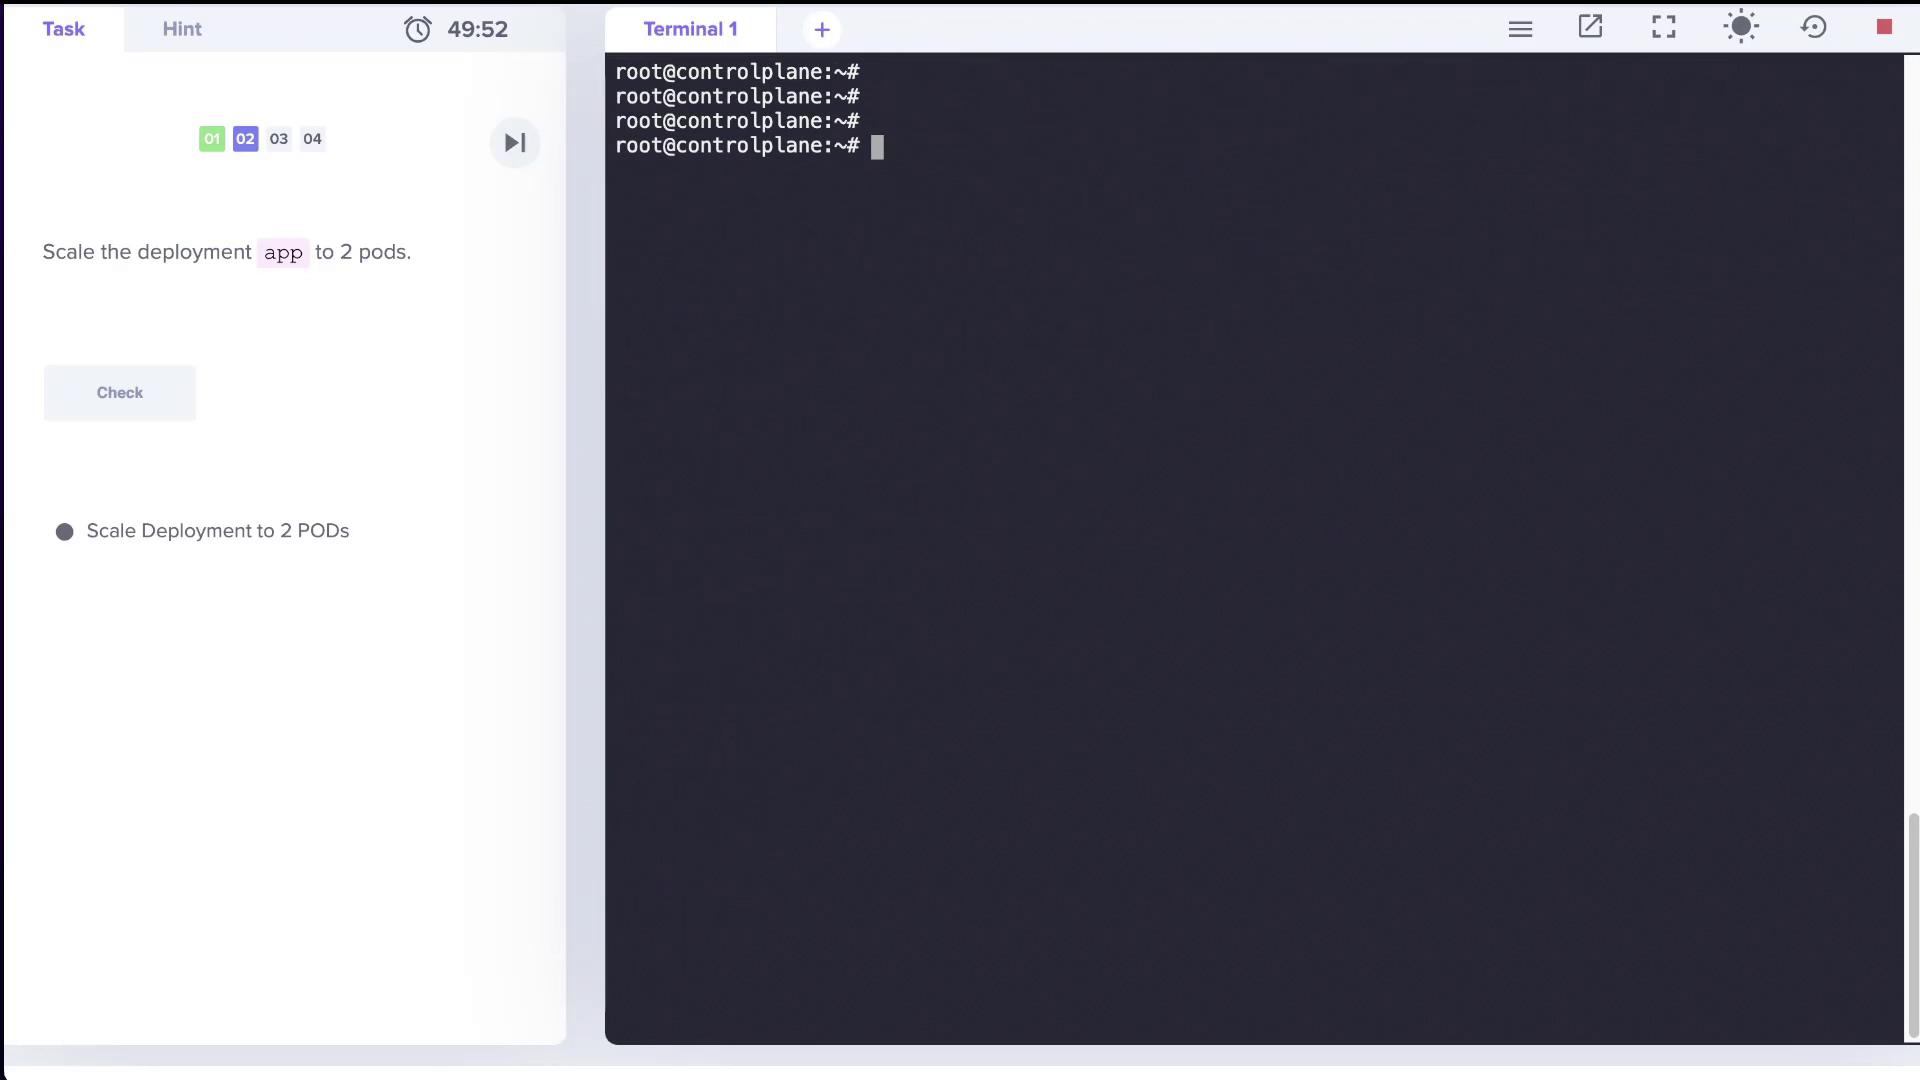
The next step is to scale the deployment named "app" to two pods. An image below illustrates the expected output:

Begin by checking the current deployment status:
root@controlplane:~# kubectl get deploy
NAME   READY   UP-TO-DATE   AVAILABLE   AGE
app    1/1     1            1           10m
Scale the deployment to two replicas:
root@controlplane:~# kubectl scale deploy app --replicas=2
deployment.apps/app scaled
Verify the updated status:
root@controlplane:~# kubectl get deploy
NAME   READY   UP-TO-DATE   AVAILABLE   AGE
app    1/2     1            1           10m
Then, check the pods:
root@controlplane:~# kubectl get pods
NAME                       READY   STATUS    RESTARTS   AGE
app-586bddbc54-hc779       1/1     Running   0          10m
Since the ReplicaSet is not scaling as expected, the issue may reside with the control plane component, specifically the kube-controller-manager.
Troubleshooting the Kube Controller Manager
List the pods in the kube-system namespace to examine the controller manager’s status:
root@controlplane:~# kubectl get pods -n kube-system
NAME                                   READY   STATUS             RESTARTS   AGE
coredns-74ff55c5b-fz97g                1/1     Running            0          28m
coredns-74ff55c5b-wfdmz                1/1     Running            0          28m
etcd-controlplane                      1/1     Running            0          28m
kube-apiserver-controlplane            1/1     Running            0          28m
kube-controller-manager-controlplane   1/1     CrashLoopBackOff   4          116s
kube-flannel-ds-b85q5                  1/1     Running            0          28m
kube-proxy-phtlt                       1/1     Running            0          28m
kube-scheduler-controlplane            1/1     Running            0          3m53s
Describe the controller manager pod to capture error details. Check its logs:
root@controlplane:~# kubectl logs kube-controller-manager-controlplane -n kube-system
Flag --port has been deprecated, see --secure-port instead.
I0422 22:24:31.928604   1 serving.go:331] Generated self-signed cert in-memory
stat /etc/kubernetes/controller-manager-XXXX.conf: no such file or directory
The log message indicates that the controller manager is referencing a non-existent kubeconfig file (/etc/kubernetes/controller-manager-XXXX.conf) instead of the correct /etc/kubernetes/controller-manager.conf. Edit the manifest file located at /etc/kubernetes/manifests/kube-controller-manager.yaml to remove the erroneous characters. A corrected snippet should appear as follows:
...
    - --authentication-kubeconfig=/etc/kubernetes/controller-manager.conf
    - --authorization-kubeconfig=/etc/kubernetes/controller-manager.conf
    - --kubeconfig=/etc/kubernetes/controller-manager.conf
...
Also, ensure that certificate files and other volume mounts are defined correctly. For example, the manifest should include:
volumeMounts:
  - mountPath: /etc/ssl/certs
    name: ca-certs
    readOnly: true
  - mountPath: /etc/ca-certificates
    name: etc-ca-certificates
    readOnly: true
  - mountPath: /usr/libexec/kubernetes/kubelet-plugins/volume/exec
    name: flexvolume-dir
  - mountPath: /etc/kubernetes/pki
    name: k8s-certs
    readOnly: true
  - mountPath: /etc/kubernetes/controller-manager.conf
    name: kubeconfig
    readOnly: true
...
volumes:
  - name: ca-certs
    hostPath:
      path: /etc/ssl/certs
      type: DirectoryOrCreate
  - name: etc-ca-certificates
    hostPath:
      path: /etc/ca-certificates
      type: DirectoryOrCreate
  - name: flexvolume-dir
    hostPath:
      path: /usr/libexec/kubernetes/kubelet-plugins/volume/exec
      type: DirectoryOrCreate
  - name: k8s-certs
    hostPath:
      path: /etc/kubernetes/pki
      type: DirectoryOrCreate
  - name: kubeconfig
    hostPath:
      path: /etc/kubernetes/controller-manager.conf
      type: FileOrCreate
...
After saving the corrected manifest, monitor the controller manager pod:
root@controlplane:~# kubectl get pods -n kube-system --watch
Once the controller manager pod is running and ready, the scaling issue should resolve since the controller manager updates the ReplicaSets. Confirm this with:
root@controlplane:~# kubectl get deploy
NAME   READY   UP-TO-DATE   AVAILABLE   AGE
app    3/3     3            3           16m
All pods should now be running as expected.
This concludes the troubleshooting lesson for control plane failures. We covered environment setup, diagnosing scheduling issues, and correcting static pod manifest errors for both the kube-scheduler and kube-controller-manager. For more information, refer to the Kubernetes Documentation.
Happy troubleshooting!
Watch Video
Watch video content