> ## Documentation Index
> Fetch the complete documentation index at: https://notes.kodekloud.com/llms.txt
> Use this file to discover all available pages before exploring further.
# Demo Jenkins Folder Part 4
> Learn to propagate the worst child build status to parent folders for accurate dashboard health metrics in Jenkins.
Welcome to Part 4 of our Jenkins Folders series. In this lesson, you’ll learn how to propagate the worst child build status up to parent folders so that your dashboard weather icons always reflect nested pipeline health.
## Why Folder-Level Health Matters
By default, Jenkins folder icons display an aggregate health based only on direct children. This means a failure deep inside a nested folder might not be visible at a glance on your main dashboard.
Make sure you have the [Folder Health Metrics Plugin](https://plugins.jenkins.io/cloudbees-folder-health-metrics/) installed before proceeding.
## Understanding Jenkins Weather Icons
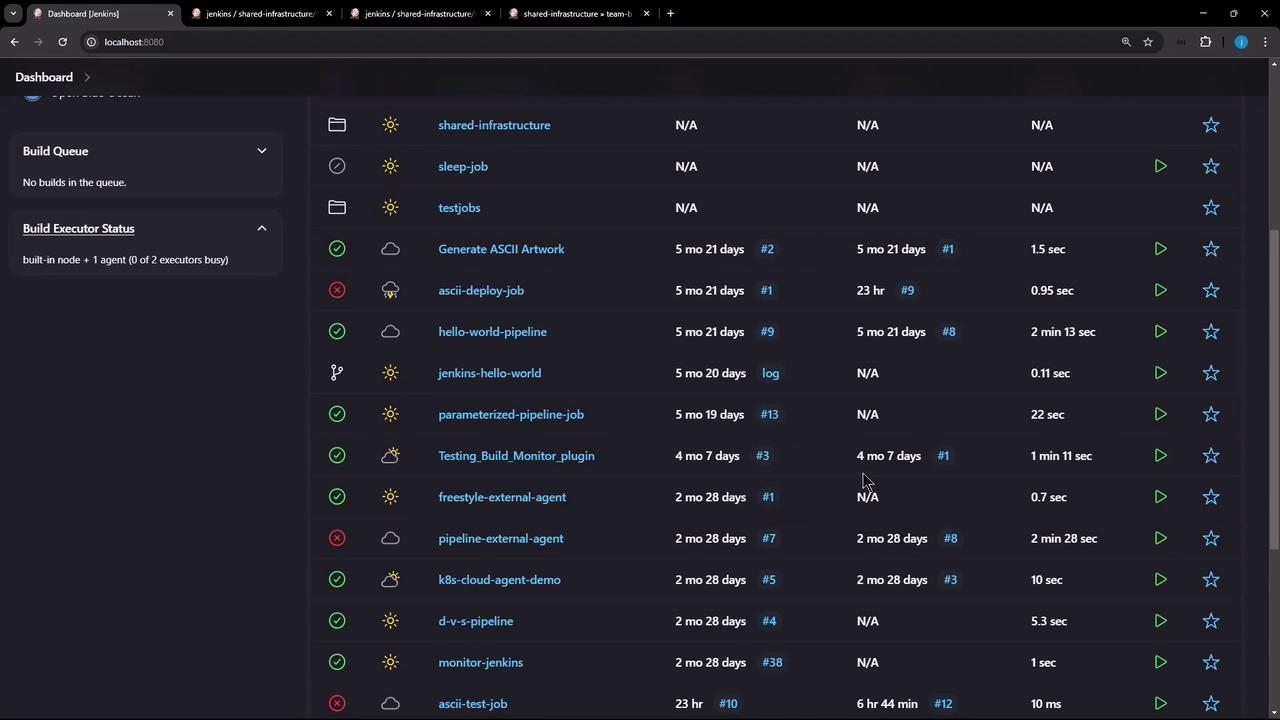
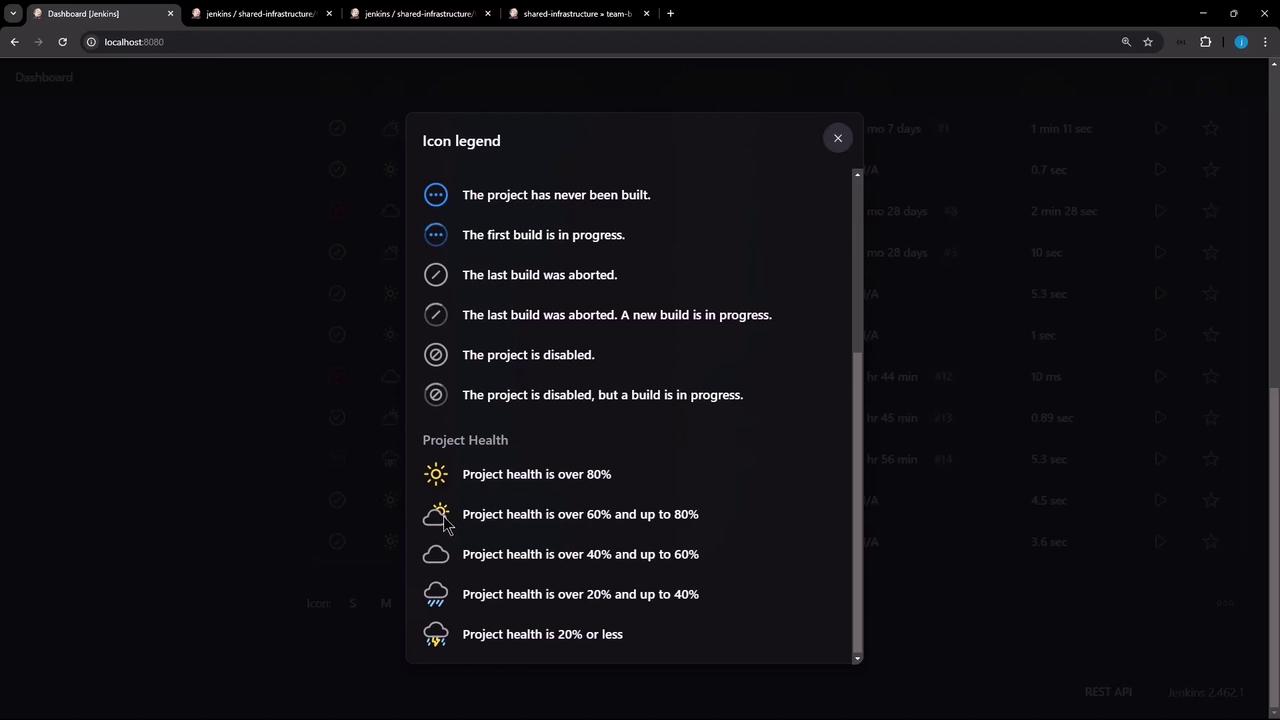
On the Jenkins dashboard, each job and folder shows a "weather" icon indicating its health:
| Weather Icon | Health % | Meaning |
| ---------------- | -------- | ------------------- |
| ☀️ Sunny | > 80% | Excellent stability |
| 🌤️ Partly Sunny | 60–80% | Good stability |
| ☁️ Cloudy | 40–60% | Moderate stability |
| 🌧️ Rainy | 20–40% | Unstable |
| ⛈️ Stormy | \< 20% | Critical failures |
The legend below maps these icons to build success rates and status symbols:
## Default vs. Worst-Child Health
Consider the **Shared Infrastructure** folder:
* It shows a ☀️ sunny icon (≥ 80% healthy), yet the nested **Team B** folder inside has a failing build.
* When you open **Team B**, you see a stormy icon and the message *“build stability: all recent builds failed.”*
However, that failure does **not** bubble up to **Shared Infrastructure**—by default, only direct children count.
## Step-by-Step: Propagate Worst-Child Health
Follow these steps to ensure a parent folder reflects the worst health of all nested items:
1. From the dashboard, **click** the target folder (e.g., **Team B**).
2. Select **Configure** from the sidebar.
3. Scroll to the **Health metrics** section.
4. Click **Add** and choose **Worst child health**.
5. **Check** the **Recursive** box to include all nested descendants.
6. Click **Apply** and then **Save**.
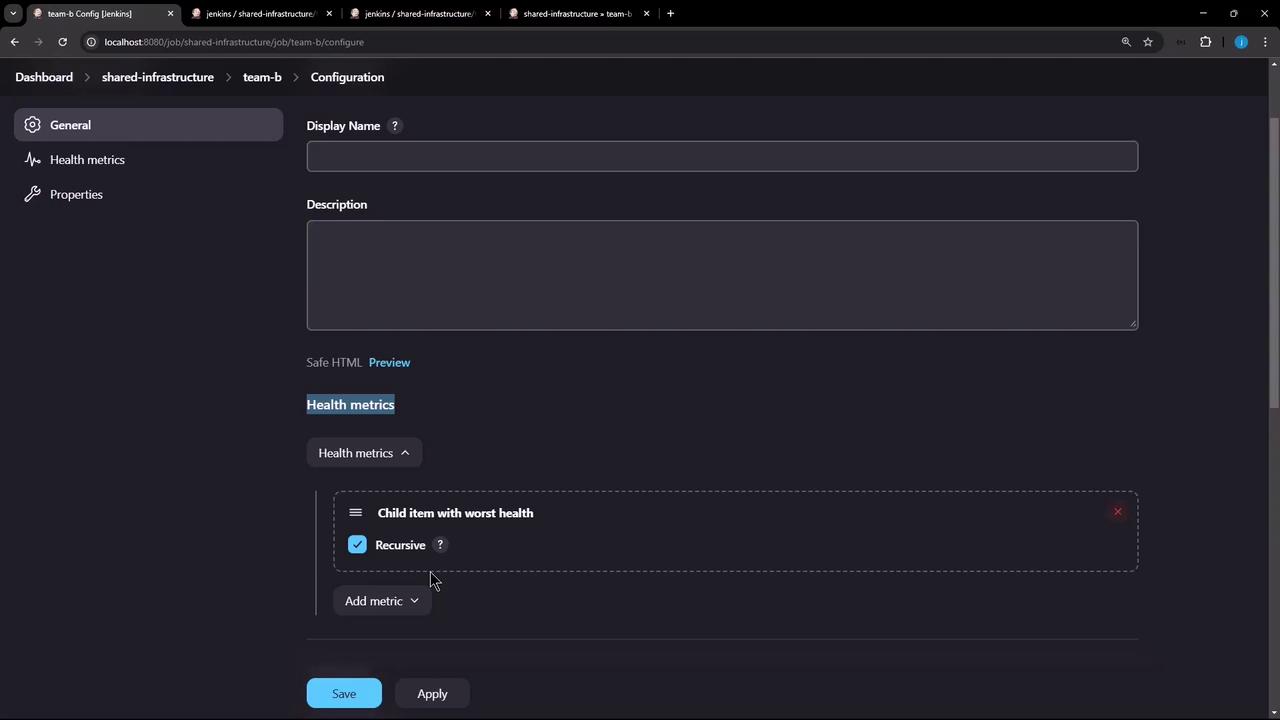
The **Recursive** option ensures that failures at any depth are included in the parent folder’s health calculation.
### Verify the Result
1. Return to **Shared Infrastructure** view.
2. Confirm the folder icon now matches the worst status of its children (including **Team B** failures).
3. Repeat this configuration for any other folders in your hierarchy.
## Links and References
* [Jenkins Folders Plugin](https://plugins.jenkins.io/cloudbees-folder/)
* [Folder Health Metrics Plugin](https://plugins.jenkins.io/cloudbees-folder-health-metrics/)
* [Jenkins Documentation](https://www.jenkins.io/doc/)
* [Managing Build Stability](https://www.jenkins.io/doc/book/pipeline/jenkinsfile/)
Thank you for following this lesson. Your Jenkins dashboard will now always surface the true health of nested pipelines!