> ## Documentation Index
> Fetch the complete documentation index at: https://notes.kodekloud.com/llms.txt
> Use this file to discover all available pages before exploring further.
# Demo Forward Audit logs to External Server
> Learn to ship Jenkins audit logs to an Elasticsearch cluster on Elastic Cloud Observability.
In this guide, you’ll learn how to ship Jenkins audit trail logs from your controller to an external Elasticsearch cluster hosted on Elastic Cloud Observability. We’ll cover:
1. Setting up Elastic Cloud Observability
2. Installing the Elastic Agent on your Jenkins controller
3. Configuring the agent to read Jenkins audit logs
4. Verifying audit entries in Kibana
## 1. Set Up Elastic Cloud Observability
1. Sign up for an Elastic Cloud trial on [elastic.co](https://www.elastic.co/cloud).
2. In the Elastic Cloud console, go to **Observability → Logs** and click **Collect and analyze logs**.
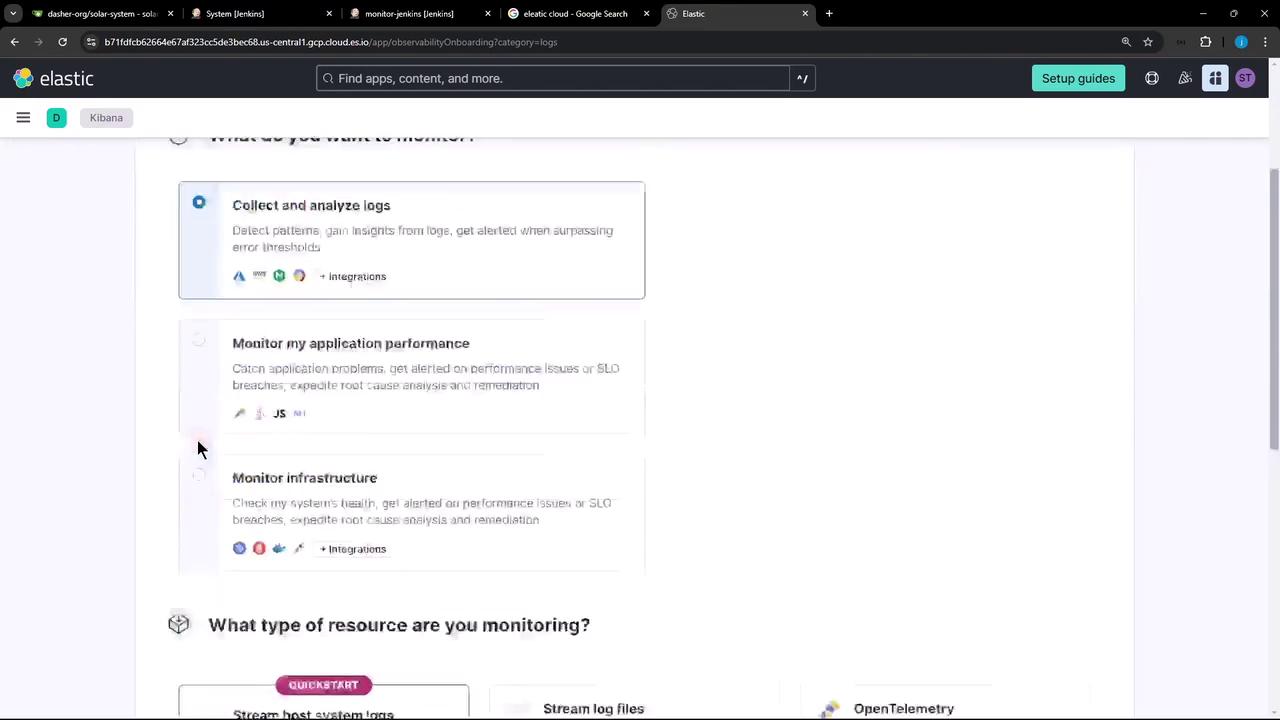
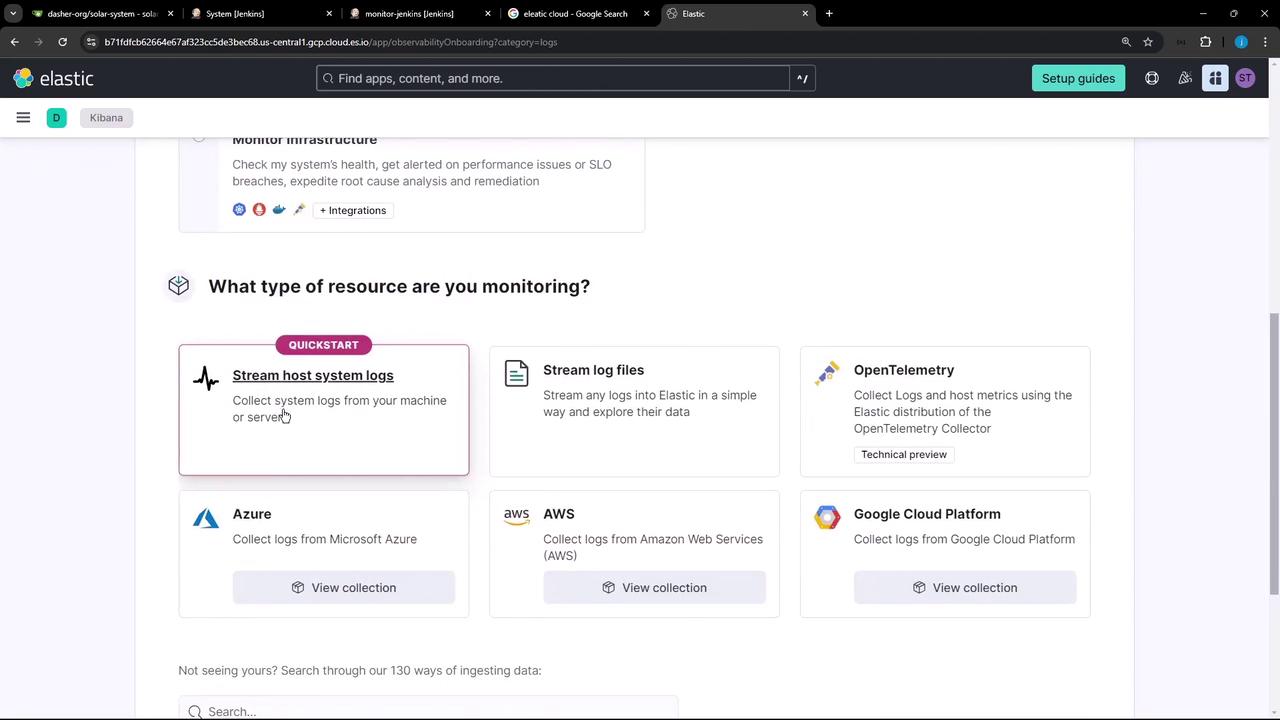
3. Choose **Host system logs** as your resource type.
4. Follow the prompts to install the Elastic Agent and generate an API key for onboarding.
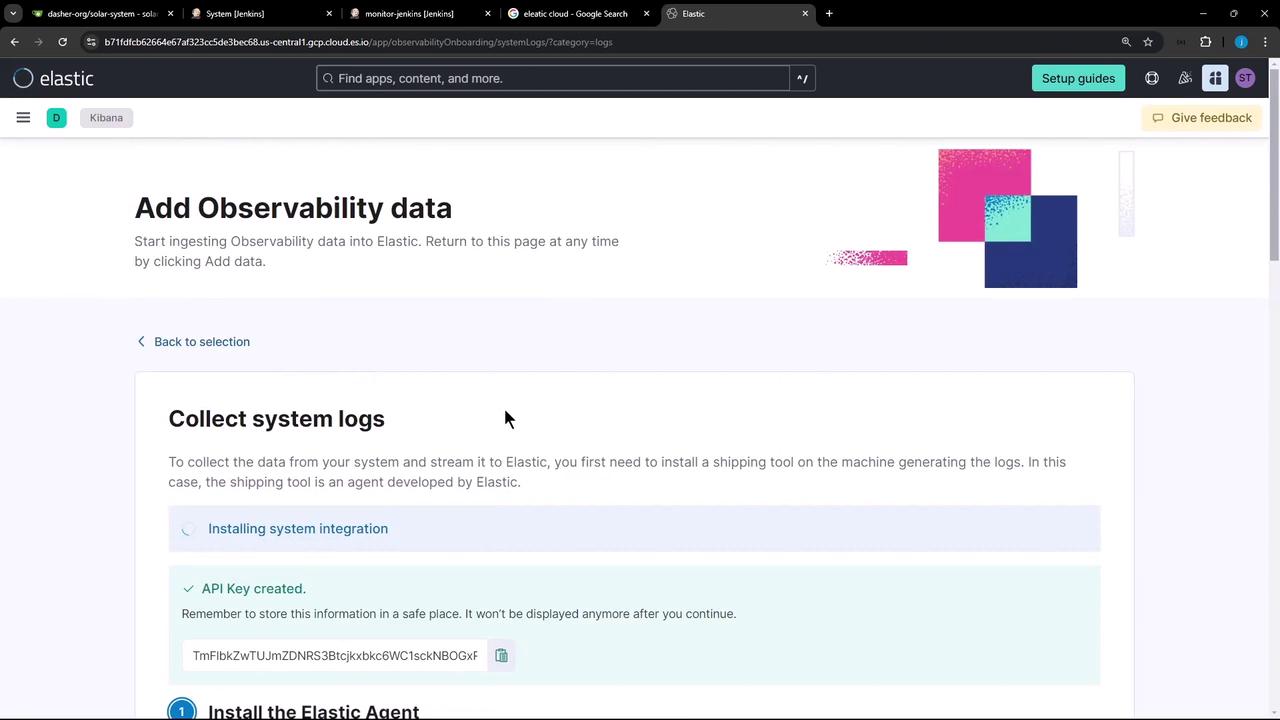
Your Elastic Cloud trial includes full access to Observability features. Save the API key securely, as you’ll need it for agent enrollment.
## 2. Install the Elastic Agent on the Jenkins Controller
On your Jenkins controller shell, download and run the provided installation script. Replace the placeholders with your API key and Cloud endpoint URL:
```bash theme={null}
curl \
https:///plugins/observabilityOnboarding/assets/standalone_agent_setup.sh \
-o standalone_agent_setup.sh && \
sudo bash standalone_agent_setup.sh \
YOUR_API_KEY \
https:///internal/observability_onboarding \
8.15.3 \
```
This script will:
* Download and unpack the Elastic Agent
* Enroll the agent using your API key and endpoint
* Place the main config at `/opt/Elastic/Agent/elastic-agent.yml`
## 3. Configure the Agent to Stream Audit Logs
Edit the agent configuration as root:
```bash theme={null}
sudo vi /opt/Elastic/Agent/elastic-agent.yml
```
### 3.1 Define the Elasticsearch Output
Locate (or add) the `outputs` section and update it with your Cloud URL and API key:
```yaml theme={null}
outputs:
default:
type: elasticsearch
hosts: ['https://your-cluster-id.us-central1.gcp.cloud.es.io:443']
api_key: 'YOUR_API_KEY'
```
### 3.2 Add Log File Inputs
Below `outputs:`, include inputs to capture Jenkins audit files from `/var/log/jenkins/custom*`:
```yaml theme={null}
inputs:
- id: jenkins-audit-logs
type: logfile
data_stream:
dataset: system.auth
type: logs
streams:
- id: jenkins-audit-logs-stream
type: logs
data_stream:
namespace: default
paths:
- /var/log/jenkins/custom*
exclude_files:
- '*.gz'
multiline:
pattern: '^'
match: after
tags: ['jenkins','audit']
- id: system-messages
type: logfile
data_stream:
dataset: system.syslog
type: logs
streams:
- id: system-messages-stream
type: logs
data_stream:
namespace: default
paths:
- /var/log/messages*
- /var/log/syslog*
- /var/log/system*
exclude_files:
- '*.gz'
multiline:
pattern: '^'
match: after
```
Ensure indentation and quotation marks are correct in `elastic-agent.yml`. A YAML syntax error will prevent the agent from starting.
### 3.3 Restart the Agent
Apply your changes:
```bash theme={null}
sudo systemctl restart elastic-agent
```
## 4. Verify Logs in Kibana
1. In Kibana, open **Observability → Logs**.
2. Refresh the interface; you should see Jenkins audit events streaming in.
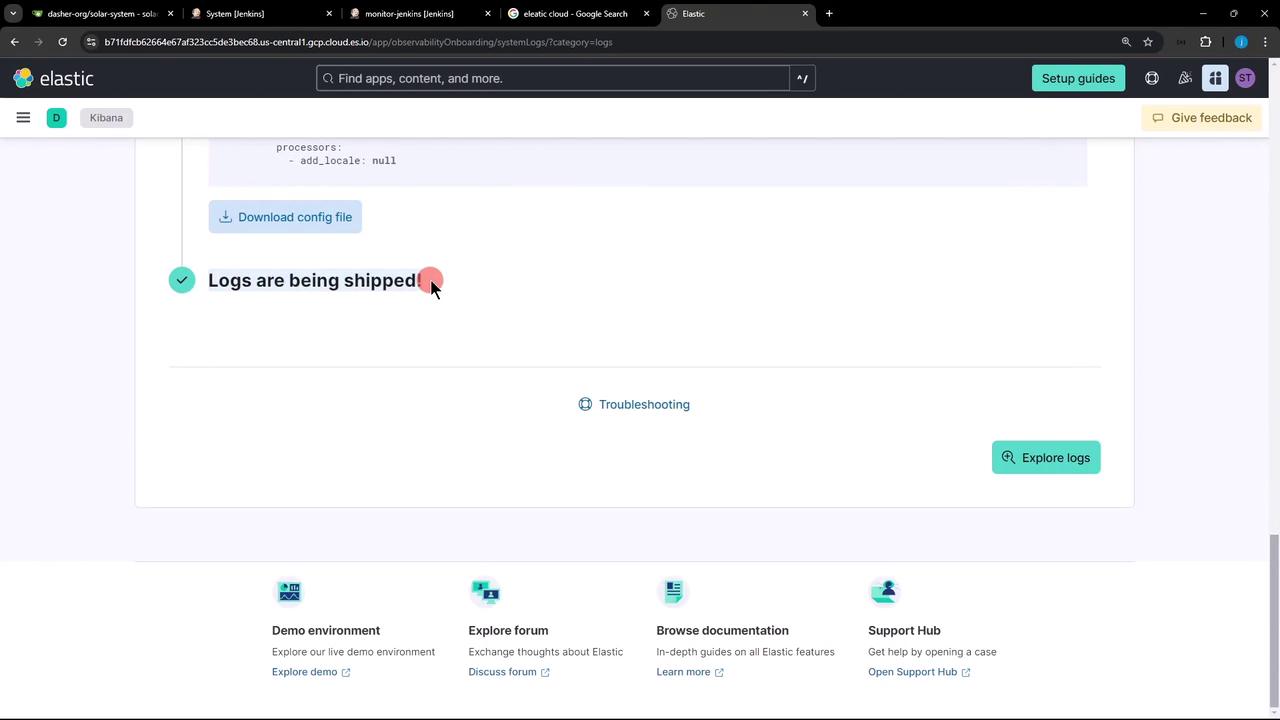
3. Click **Explore logs** to filter, search, and analyze your audit data.
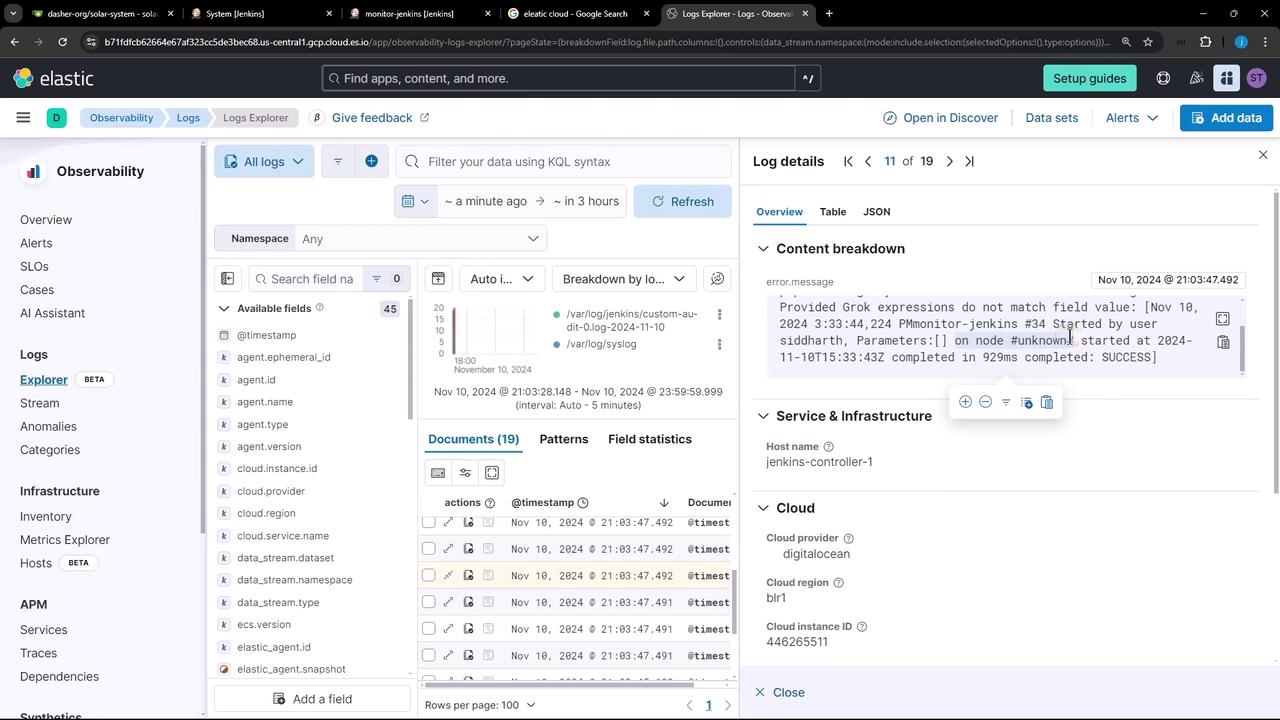
### Sample Audit Entries
```text theme={null}
pipeline logs-system.auth-1.62.1 failed with message: Provided Grok expressions do not match field value: [Nov 10, 2024 3:33:43,556 PM] job/monitor-jenkins/ #35 Started by user siddharth, Parameters:[]
```
Or on your controller:
```text theme={null}
Nov 10, 2024 3:30:09,212 PM job/monitor-jenkins/ #31 Started by user siddharth, Parameters:[]
Nov 10, 2024 3:33:44,394 PM monitor-jenkins #36 Started by user siddharth, Parameters:[] on node #unknown# started at 2024-11-10T15:33:43Z completed in 929ms completed: SUCCESS
```
Continue generating Jenkins audit events; they’ll flow automatically into your Elastic Cloud instance.
***
## Links and References
* [Elastic Cloud Observability](https://www.elastic.co/cloud/observability)
* [Elastic Agent Documentation](https://www.elastic.co/guide/en/fleet/current/fleet-overview.html)
* [Kibana Logs UI](https://www.elastic.co/guide/en/kibana/current/logs.html)
* [Jenkins Audit Trail Plugin](https://plugins.jenkins.io/audit-trail/)