> ## Documentation Index
> Fetch the complete documentation index at: https://notes.kodekloud.com/llms.txt
> Use this file to discover all available pages before exploring further.

# Demo Monitoring with Prometheus Grafana

> This tutorial teaches how to collect and visualize Jenkins metrics using Prometheus and Grafana.

In this tutorial, you’ll learn how to collect and visualize Jenkins metrics using the **Prometheus Metrics Plugin**, Prometheus, and Grafana. We’ll cover:

* Installing and configuring the Jenkins plugin
* Deploying Prometheus and Grafana via Docker Compose
* Scraping Jenkins metrics in Prometheus
* Building dashboards in Grafana
* Generating live data with a sample pipeline

***

## 1. Install and Configure the Jenkins Prometheus Metrics Plugin

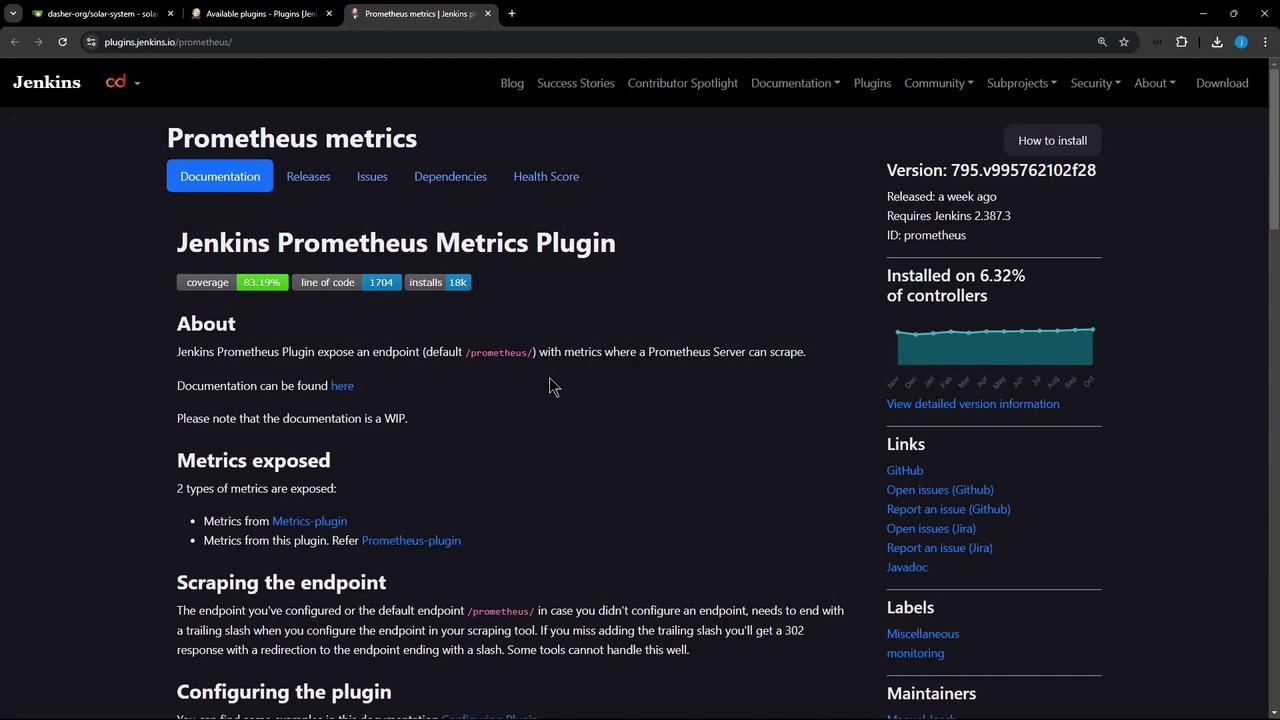
Jenkins can export runtime data through the **Prometheus Metrics Plugin**, which adds an HTTP endpoint for scraping.
<Frame>
  ![The image shows a webpage for the Jenkins Prometheus Metrics Plugin, detailing its features, installation statistics, and links for further information.](https://kodekloud.com/kk-media/image/upload/v1752870707/notes-assets/images/Certified-Jenkins-Engineer-Demo-Monitoring-with-Prometheus-Grafana/jenkins-prometheus-metrics-plugin.jpg)
</Frame>

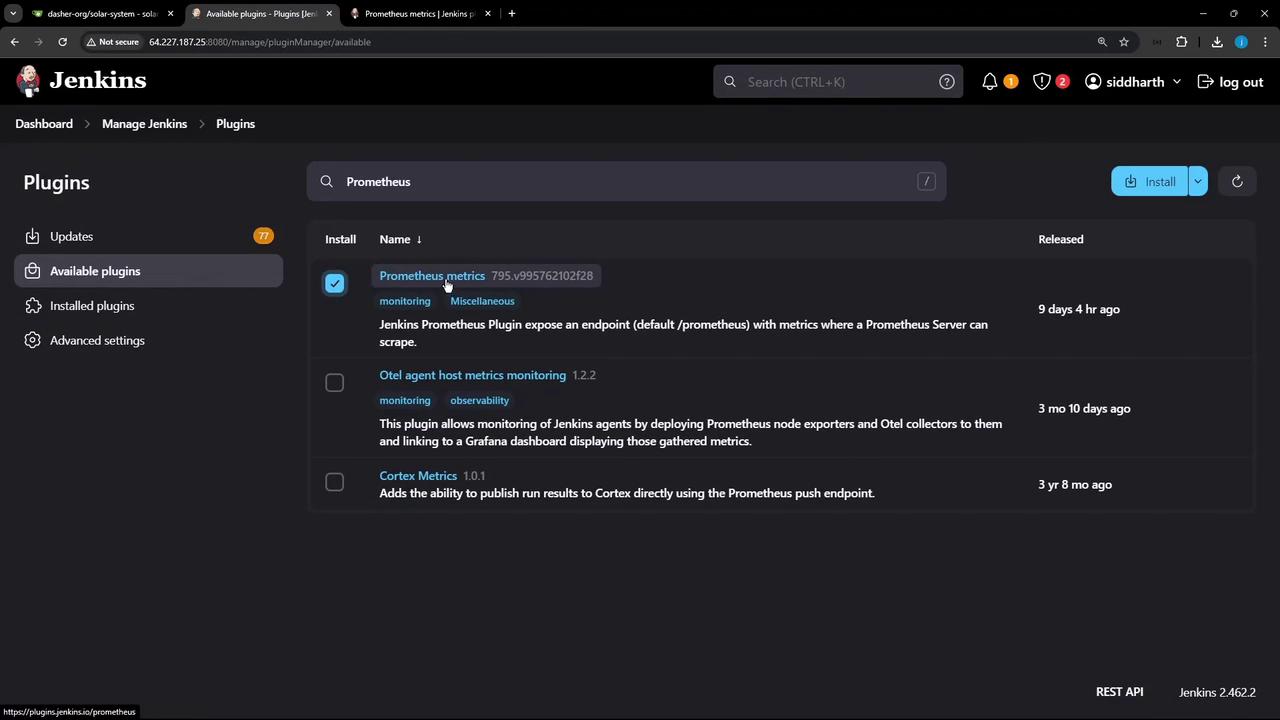
1. In Jenkins, navigate to **Manage Jenkins » Manage Plugins » Available**, search for **Prometheus**, then install **Prometheus Metrics Plugin**.
<Frame>
  ![The image shows the Jenkins plugin management interface, specifically the "Available plugins" section, with a search for "Prometheus" displaying related plugins and their details.](https://kodekloud.com/kk-media/image/upload/v1752870708/notes-assets/images/Certified-Jenkins-Engineer-Demo-Monitoring-with-Prometheus-Grafana/jenkins-plugin-management-prometheus.jpg)
</Frame>

2. Restart Jenkins to activate the plugin.
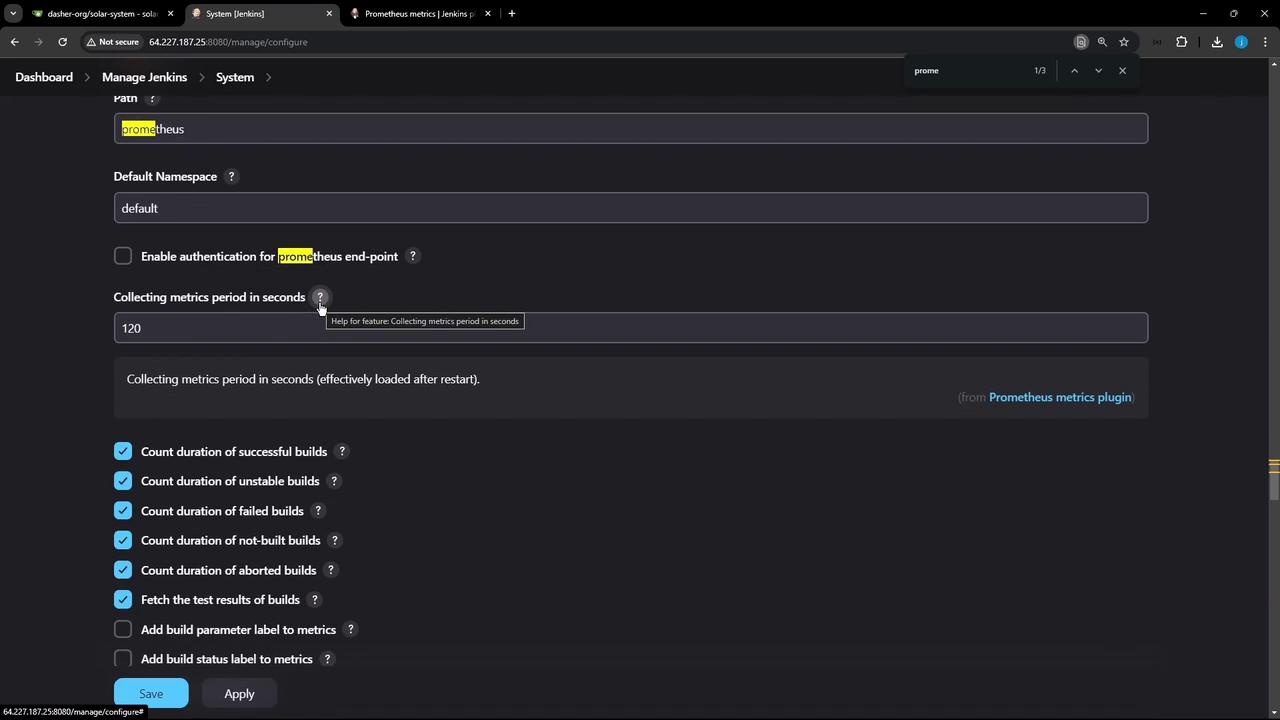
3. Go to **Manage Jenkins » Configure System » Prometheus**. By default, metrics are collected every 120 seconds at the `/prometheus` endpoint.
<Frame>
  ![The image shows a Jenkins system configuration page for Prometheus metrics, with options to set the metrics collection period and enable various build count metrics.](https://kodekloud.com/kk-media/image/upload/v1752870709/notes-assets/images/Certified-Jenkins-Engineer-Demo-Monitoring-with-Prometheus-Grafana/jenkins-prometheus-metrics-configuration.jpg)
</Frame>

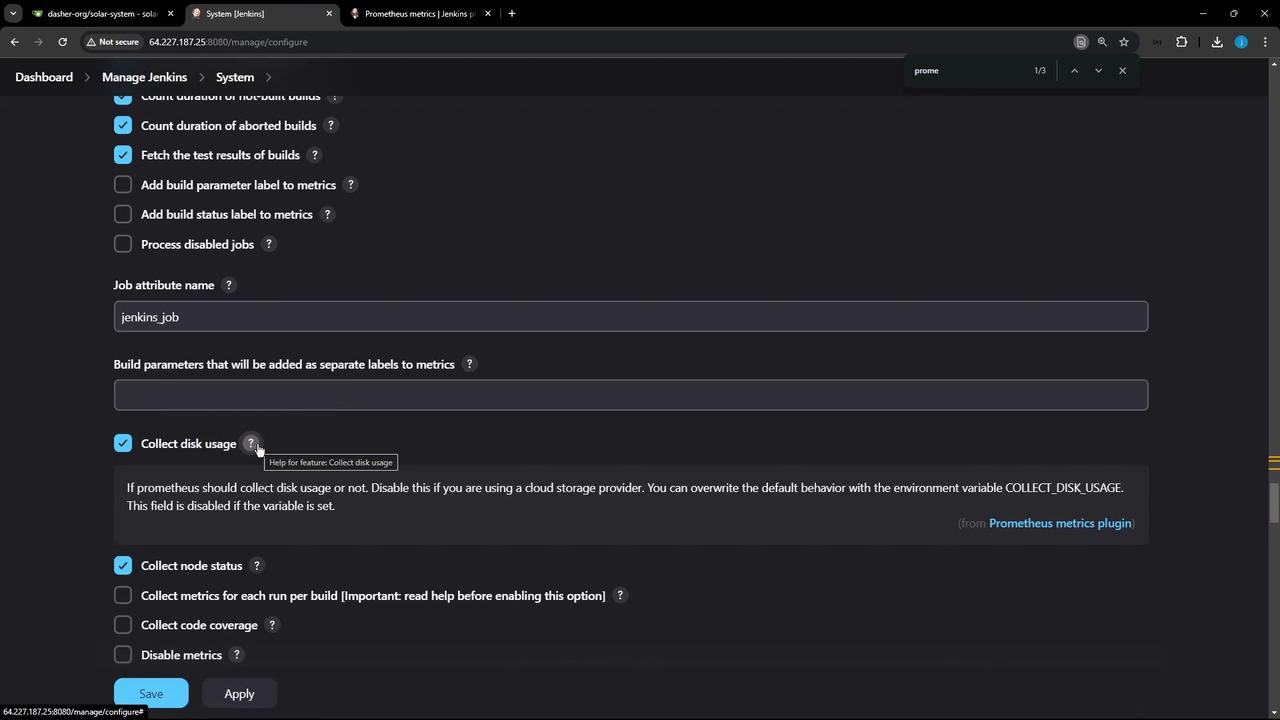
4. For rapid feedback, set **Metrics collection period** to **10 seconds**. Enable or disable metrics (disk usage, node status, etc.).
<Frame>
  ![The image shows a configuration page from Jenkins, specifically for setting up Prometheus metrics. Various options are available for enabling or disabling metrics collection, such as disk usage and node status.](https://kodekloud.com/kk-media/image/upload/v1752870710/notes-assets/images/Certified-Jenkins-Engineer-Demo-Monitoring-with-Prometheus-Grafana/jenkins-prometheus-metrics-configuration-2.jpg)
</Frame>

Now Jenkins exposes metrics at:

```text theme={null}
http://<jenkins-host>:<port>/prometheus
```

***

## 2. Deploy Prometheus and Grafana with Docker Compose

Create a project directory (e.g., `prometheus-grafana/`) with:

* `docker-compose.yml`
* `prometheus/prometheus.yml`

In `docker-compose.yml`:

```yaml theme={null}
version: '3.8'

services:
  prometheus:
    image: prom/prometheus
    container_name: prometheus
    command: --config.file=/etc/prometheus/prometheus.yml
    ports:
      - "9090:9090"
    volumes:
      - ./prometheus:/etc/prometheus
      - prom_data:/prometheus
    restart: unless-stopped

  grafana:
    image: grafana/grafana
    container_name: grafana
    ports:
      - "8081:3000"
    environment:
      - GF_SECURITY_ADMIN_USER=admin
      - GF_SECURITY_ADMIN_PASSWORD=password
    volumes:
      - ./grafana:/etc/grafana/provisioning/datasources
    restart: unless-stopped

volumes:
  prom_data:
```

### 2.1 Service Overview

| Service    | Image           | Ports     | Data Volume                                       |
| ---------- | --------------- | --------- | ------------------------------------------------- |
| prometheus | prom/prometheus | 9090:9090 | `./prometheus:/etc/prometheus`, `prom_data`       |
| grafana    | grafana/grafana | 8081:3000 | `./grafana:/etc/grafana/provisioning/datasources` |

### 2.2 Prometheus Configuration

In `prometheus/prometheus.yml`, set global options and scrape jobs:

```yaml theme={null}
alerting:
  alertmanagers:
    - static_configs:
        - targets: ["alertmanager:9093"]

scrape_configs:
  - job_name: 'prometheus'
    metrics_path: /metrics
    static_configs:
      - targets: ['localhost:9090']

  - job_name: 'jenkins'
    metrics_path: /prometheus
    static_configs:
      - targets: ['<jenkins-host>:<jenkins-port>']
```

Replace `<jenkins-host>` and `<jenkins-port>` with your Jenkins address (e.g., `jenkins-controller:8080`).

<Callout icon="lightbulb" color="#1CB2FE">
  If you’re not using Alertmanager, you can remove or comment out the `alerting:` section above.
</Callout>

### 2.3 Launch the Stack

```bash theme={null}
cd prometheus-grafana
docker compose up -d
```

You should see:

```text theme={null}
[+] Running 4/4
 Network prometheus-grafana_default   Created
 Volume "prometheus-grafana_prom_data" Created
 Container prometheus                Started
 Container grafana                   Started
```

***

## 3. Verify in Prometheus

1. Open `http://<vm-ip>:9090` in your browser.
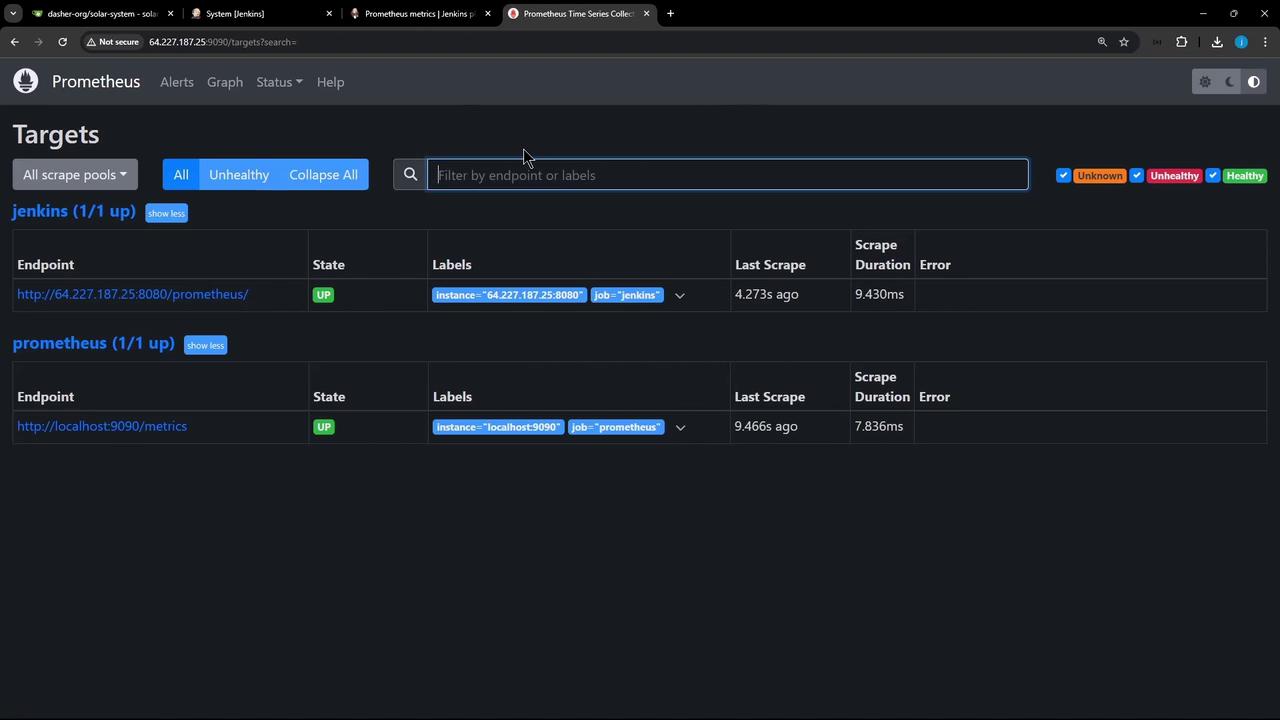
2. Go to **Status » Targets**. Both **prometheus** and **jenkins** targets should be **UP**.
<Frame>
  ![The image shows a Prometheus monitoring dashboard displaying the status of two targets, "jenkins" and "prometheus," both of which are up and running. It includes details like endpoints, state, labels, last scrape time, and scrape duration.](https://kodekloud.com/kk-media/image/upload/v1752870711/notes-assets/images/Certified-Jenkins-Engineer-Demo-Monitoring-with-Prometheus-Grafana/prometheus-monitoring-dashboard-jenkins.jpg)
</Frame>

### 3.1 Query Example: Jenkins Job Count

* Navigate to **Graph**.
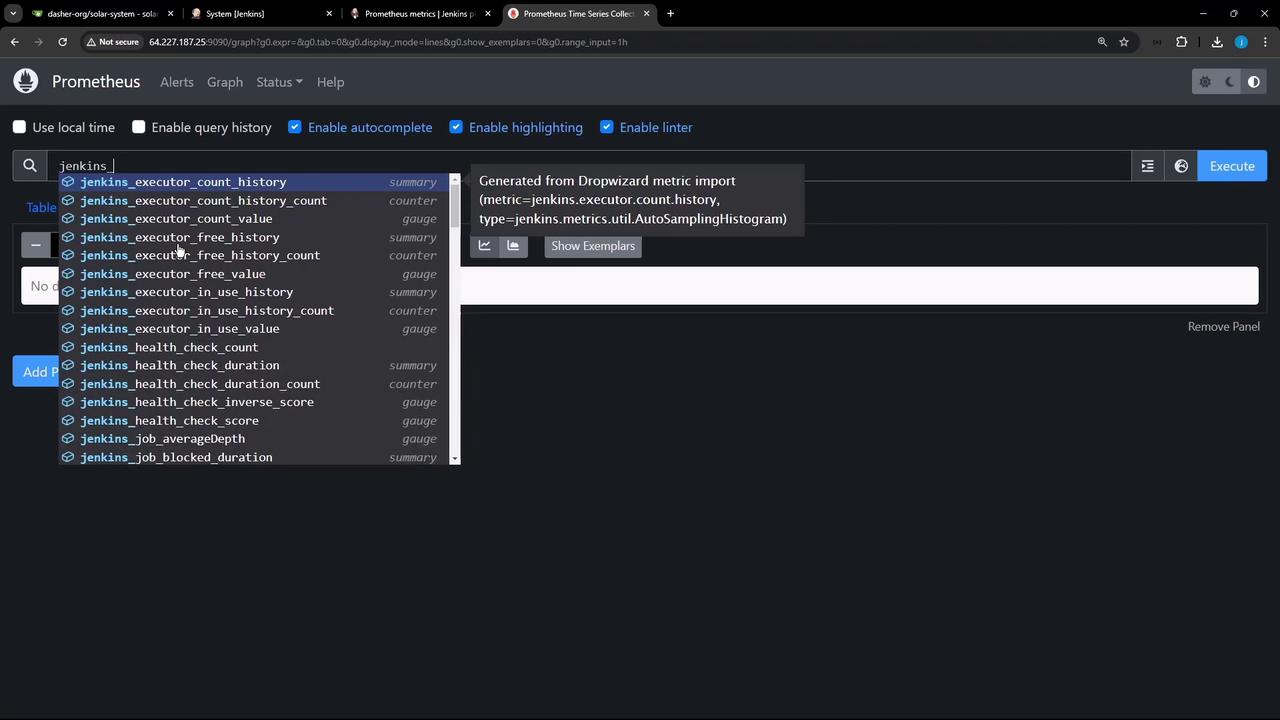
* Enter the query:

  ```promql theme={null}
  jenkins_job_count_value{job="jenkins"}
  ```
<Frame>
  ![The image shows a Prometheus interface with a query input field, displaying a list of Jenkins-related metrics. The user is selecting a metric from the dropdown list to execute a query.](https://kodekloud.com/kk-media/image/upload/v1752870712/notes-assets/images/Certified-Jenkins-Engineer-Demo-Monitoring-with-Prometheus-Grafana/prometheus-jenkins-metrics-query.jpg)
</Frame>

* Click **Execute**. You may see output like:

  ```text theme={null}
  jenkins_job_count_value{instance="64.227.187.25:8080", job="jenkins"} => 22
  ```

### 3.2 Plugin Metrics

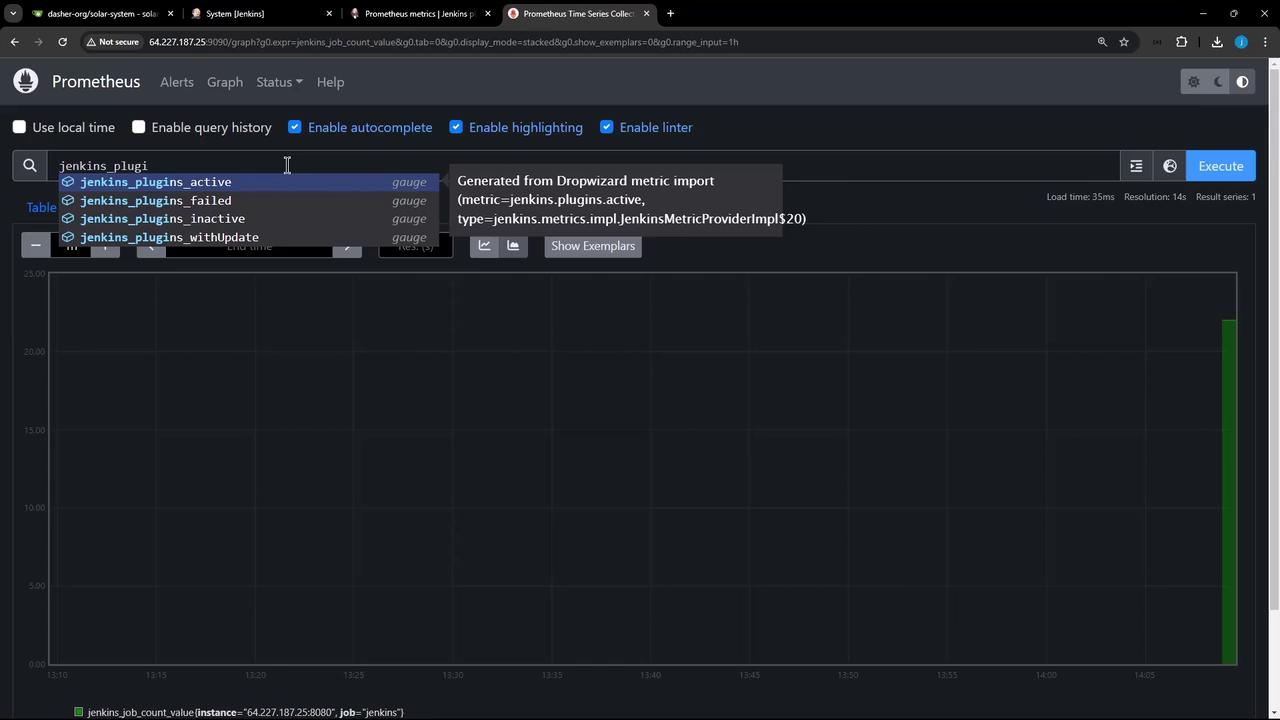
* **Active plugins**:

  ```promql theme={null}
  jenkins_plugins_active{job="jenkins"}
  ```
<Frame>
  ![The image shows a Prometheus interface with a query for Jenkins plugin metrics, displaying a graph with a single data point. The query options include metrics like active, failed, inactive, and with updates.](https://kodekloud.com/kk-media/image/upload/v1752870713/notes-assets/images/Certified-Jenkins-Engineer-Demo-Monitoring-with-Prometheus-Grafana/prometheus-jenkins-metrics-graph.jpg)
</Frame>

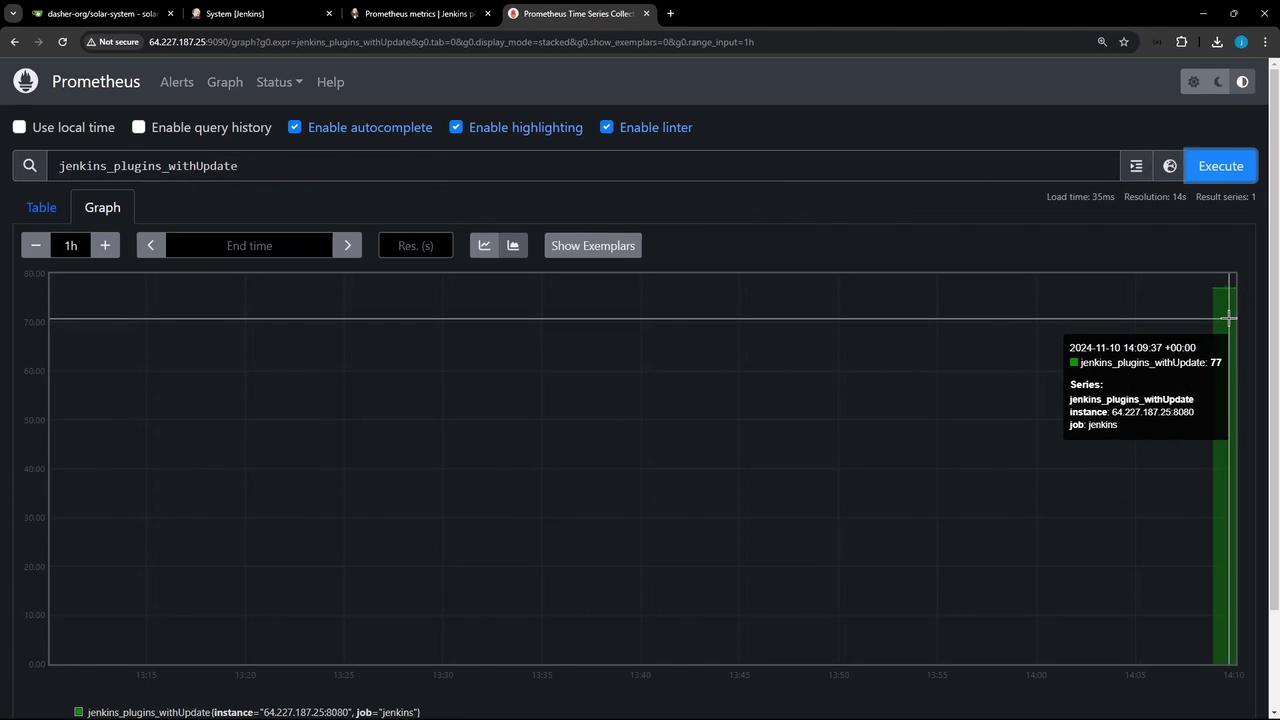
* **Plugins requiring updates**:

  ```promql theme={null}
  jenkins_plugins_withUpdate{job="jenkins"}
  ```
<Frame>
  ![The image shows a Prometheus dashboard displaying a graph of Jenkins plugin updates over time, with a highlighted data point indicating 77 updates at a specific timestamp.](https://kodekloud.com/kk-media/image/upload/v1752870714/notes-assets/images/Certified-Jenkins-Engineer-Demo-Monitoring-with-Prometheus-Grafana/prometheus-dashboard-jenkins-updates.jpg)
</Frame>

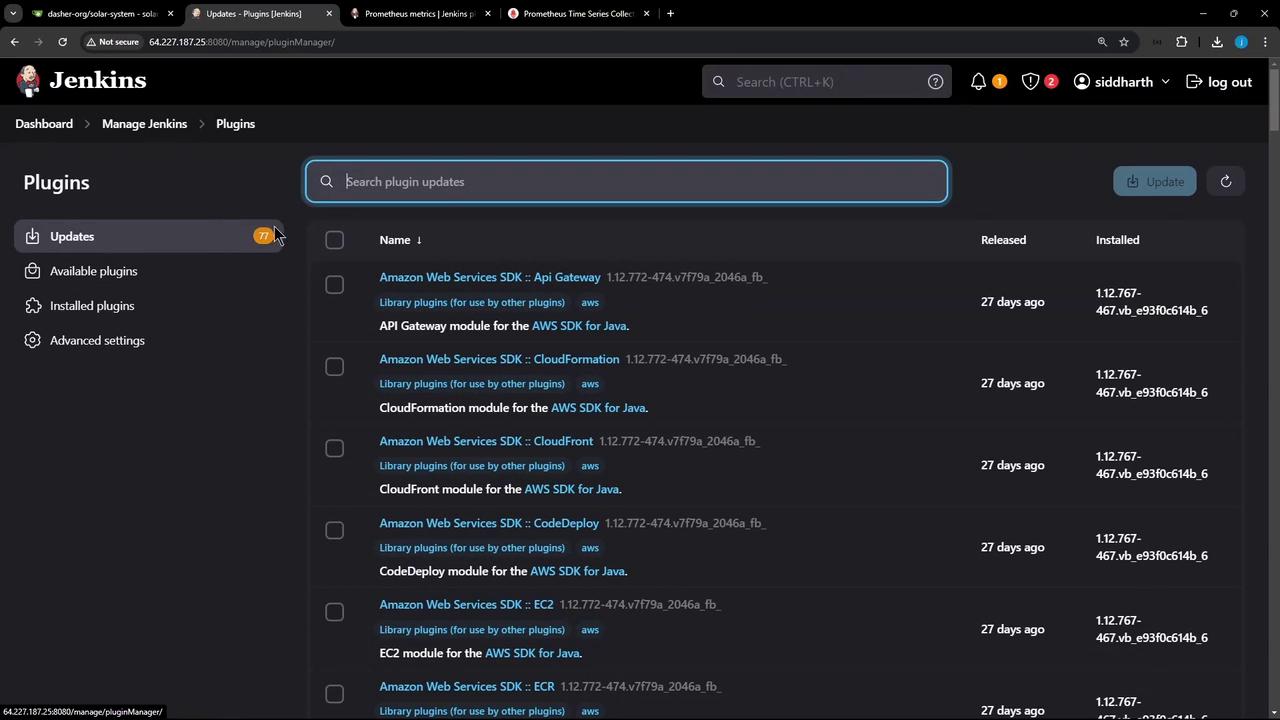
Confirm plugin updates in Jenkins under **Manage Jenkins » Manage Plugins » Updates**:
<Frame>
  ![The image shows the Jenkins plugin management interface, specifically the updates section, listing various Amazon Web Services SDK plugins available for update.](https://kodekloud.com/kk-media/image/upload/v1752870715/notes-assets/images/Certified-Jenkins-Engineer-Demo-Monitoring-with-Prometheus-Grafana/jenkins-plugin-management-aws-sdk-updates.jpg)
</Frame>

***

## 4. Visualize in Grafana

1. Open Grafana at `http://<vm-ip>:8081`. Log in as **admin/password**.
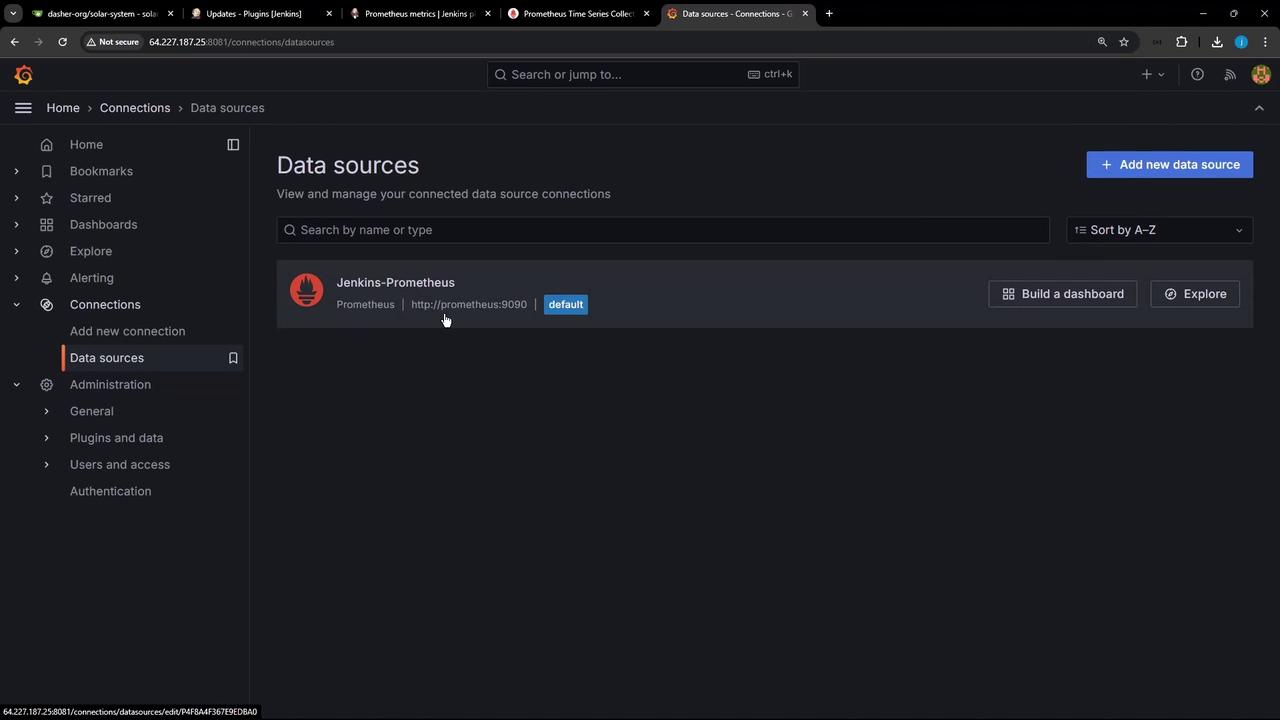
2. Go to **Configuration » Data Sources**, and add or verify **Prometheus** pointing to `http://prometheus:9090`.
<Frame>
  ![The image shows a dashboard interface for managing data source connections, specifically displaying a connection to "Jenkins-Prometheus" with options to build a dashboard or explore. The interface includes a sidebar with navigation options like Home, Bookmarks, and Connections.](https://kodekloud.com/kk-media/image/upload/v1752870716/notes-assets/images/Certified-Jenkins-Engineer-Demo-Monitoring-with-Prometheus-Grafana/dashboard-interface-jenkins-prometheus.jpg)
</Frame>

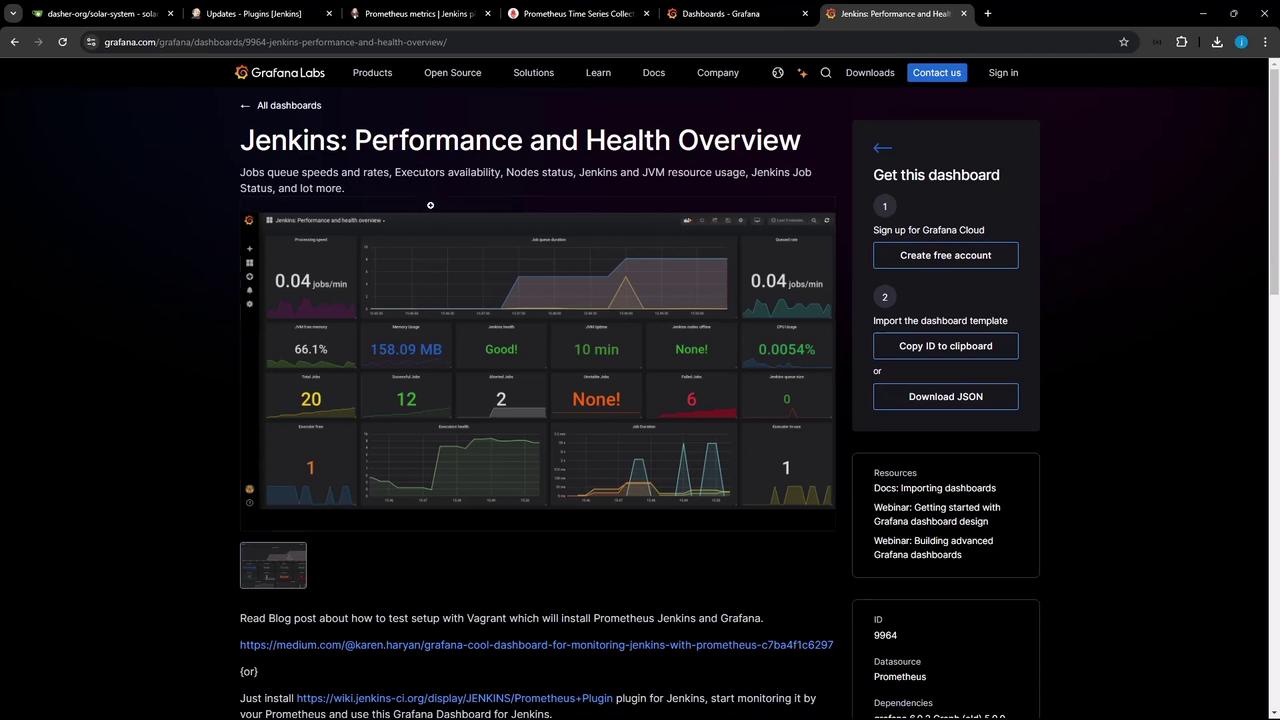
3. Click **Create » Import**, enter **Dashboard ID 9964**, select your Prometheus data source, and import.
<Frame>
  ![The image shows a Grafana dashboard for Jenkins, displaying performance and health metrics such as job queue speeds, executor availability, and resource usage. There are options to sign up for Grafana Cloud and import the dashboard template.](https://kodekloud.com/kk-media/image/upload/v1752870717/notes-assets/images/Certified-Jenkins-Engineer-Demo-Monitoring-with-Prometheus-Grafana/grafana-jenkins-dashboard-metrics.jpg)
</Frame>

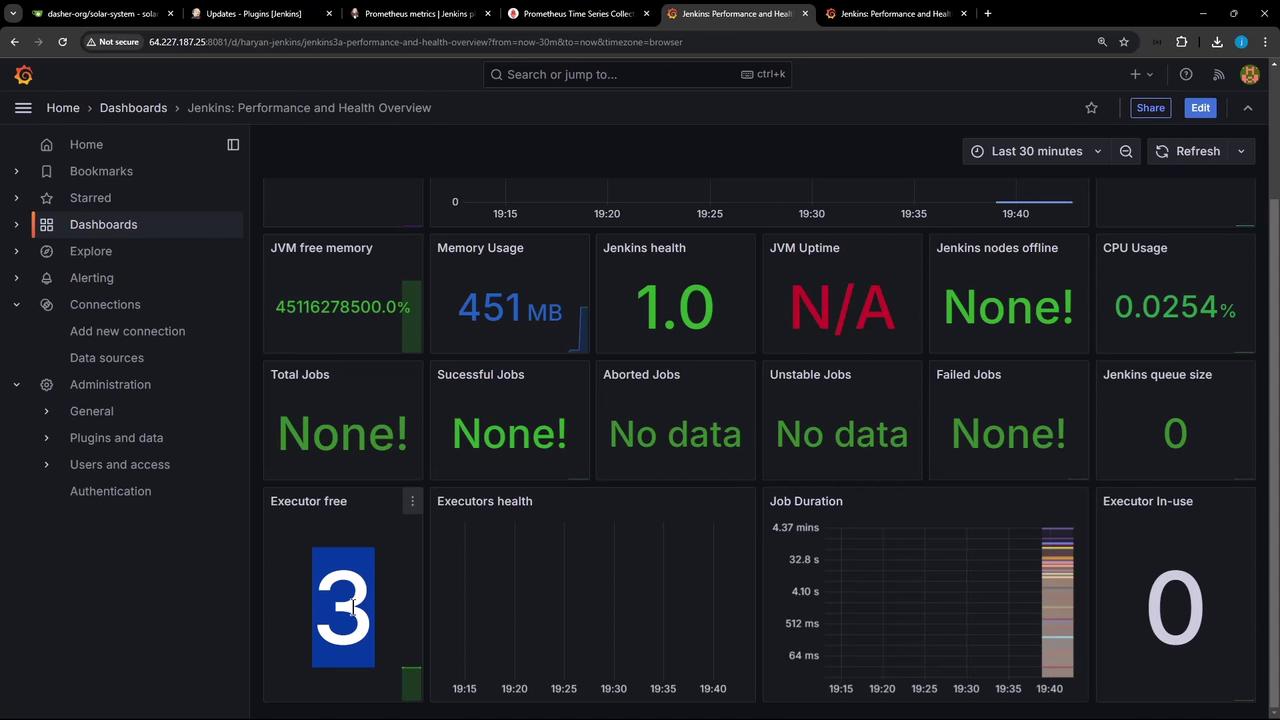
You’ll see the **Jenkins Performance & Health Overview**:
<Frame>
  ![The image shows a Jenkins performance and health overview dashboard displaying various metrics such as JVM free memory, memory usage, Jenkins health, CPU usage, and job statistics.](https://kodekloud.com/kk-media/image/upload/v1752870718/notes-assets/images/Certified-Jenkins-Engineer-Demo-Monitoring-with-Prometheus-Grafana/jenkins-performance-health-dashboard.jpg)
</Frame>

***

## 5. Generate Live Data with a Sample Pipeline

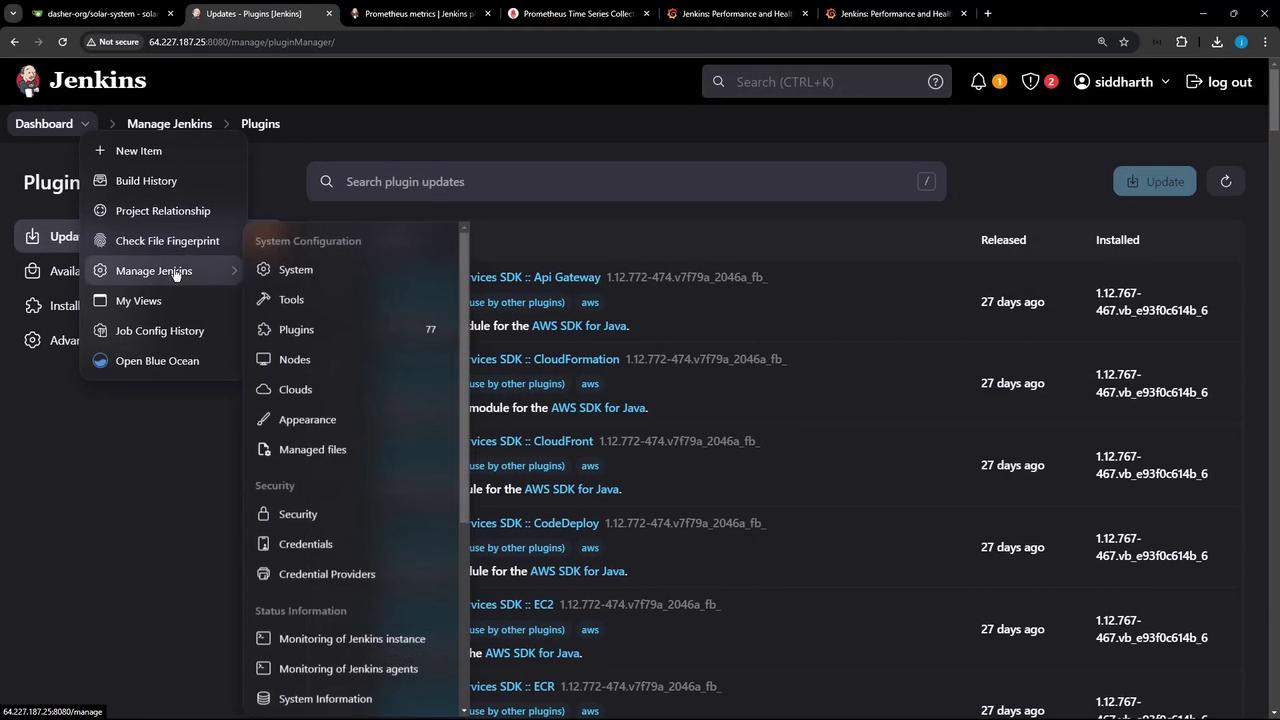
Before adding load, revisit plugin updates:
<Frame>
  ![The image shows a Jenkins dashboard displaying memory usage, with a graph indicating 343 MB of memory used. The interface includes options for editing the panel and configuring queries.](https://kodekloud.com/kk-media/image/upload/v1752870719/notes-assets/images/Certified-Jenkins-Engineer-Demo-Monitoring-with-Prometheus-Grafana/jenkins-plugins-interface-updates.jpg)
</Frame>

### 5.1 Create a New Pipeline Job

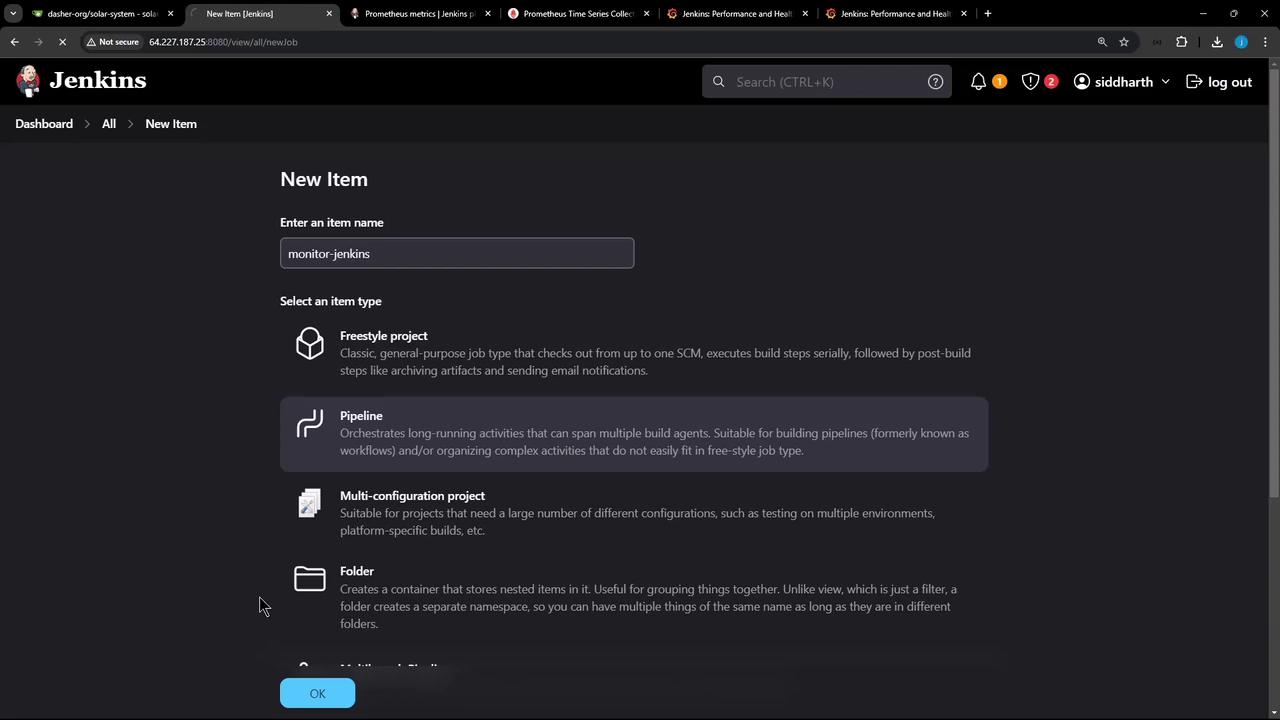
1. Click **New Item**, name it **monitor-jenkins**, choose **Pipeline**, then click **OK**.
<Frame>
  ![The image shows a Jenkins interface where a user is creating a new item named "monitor-jenkins" and selecting an item type, such as Freestyle project, Pipeline, Multi-configuration project, or Folder.](https://kodekloud.com/kk-media/image/upload/v1752870720/notes-assets/images/Certified-Jenkins-Engineer-Demo-Monitoring-with-Prometheus-Grafana/jenkins-create-monitor-jenkins-item.jpg)
</Frame>

2. In **Pipeline » Script**, add:

   ```groovy theme={null}
   node {
     stage('Echo Message1') {
       sh 'sleep 2s'
     }

     node('ubuntu-docker-jdk17-node20') {
       stage('Echo Message2') {
         sh 'echo 15'
       }
     }
   }
   ```

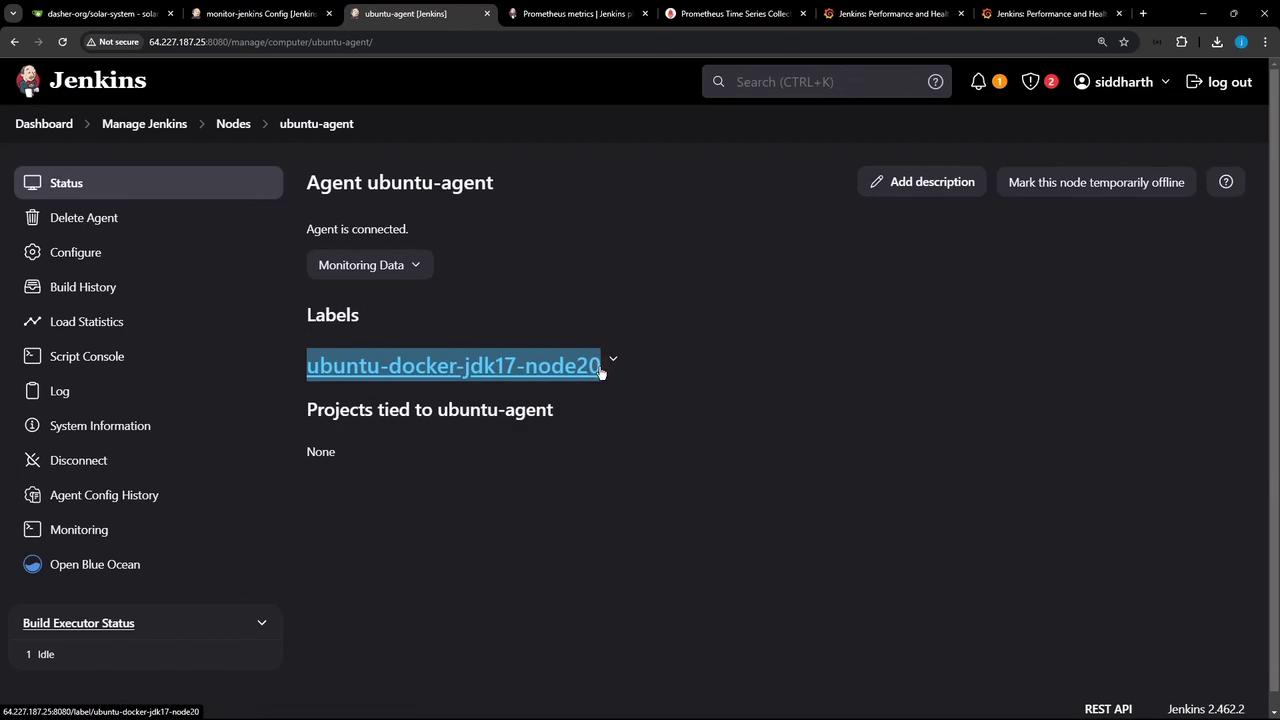
3. Verify your agent label under **Manage Jenkins » Manage Nodes**.
<Frame>
  ![The image shows a Jenkins interface displaying the status of an agent named "ubuntu-agent," which is connected and labeled with "ubuntu-docker-jdk17-node20." There are no projects tied to this agent.](https://kodekloud.com/kk-media/image/upload/v1752870721/notes-assets/images/Certified-Jenkins-Engineer-Demo-Monitoring-with-Prometheus-Grafana/jenkins-ubuntu-agent-status-docker.jpg)
</Frame>

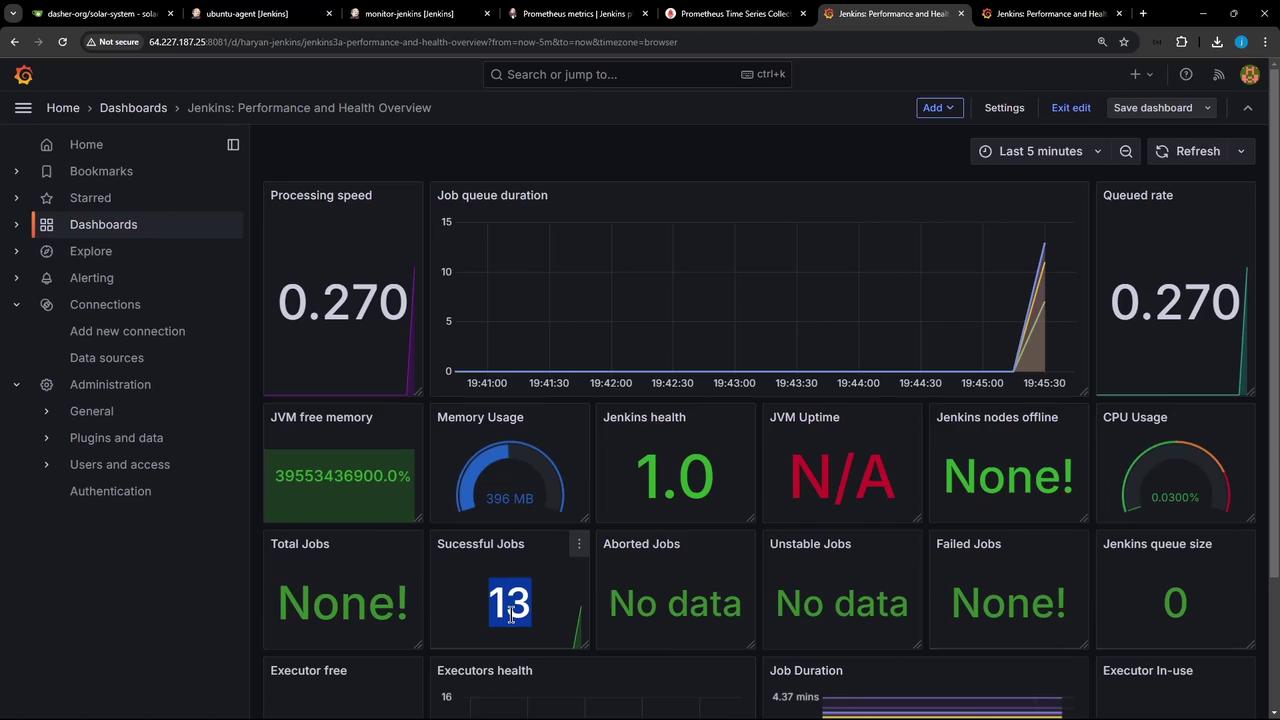
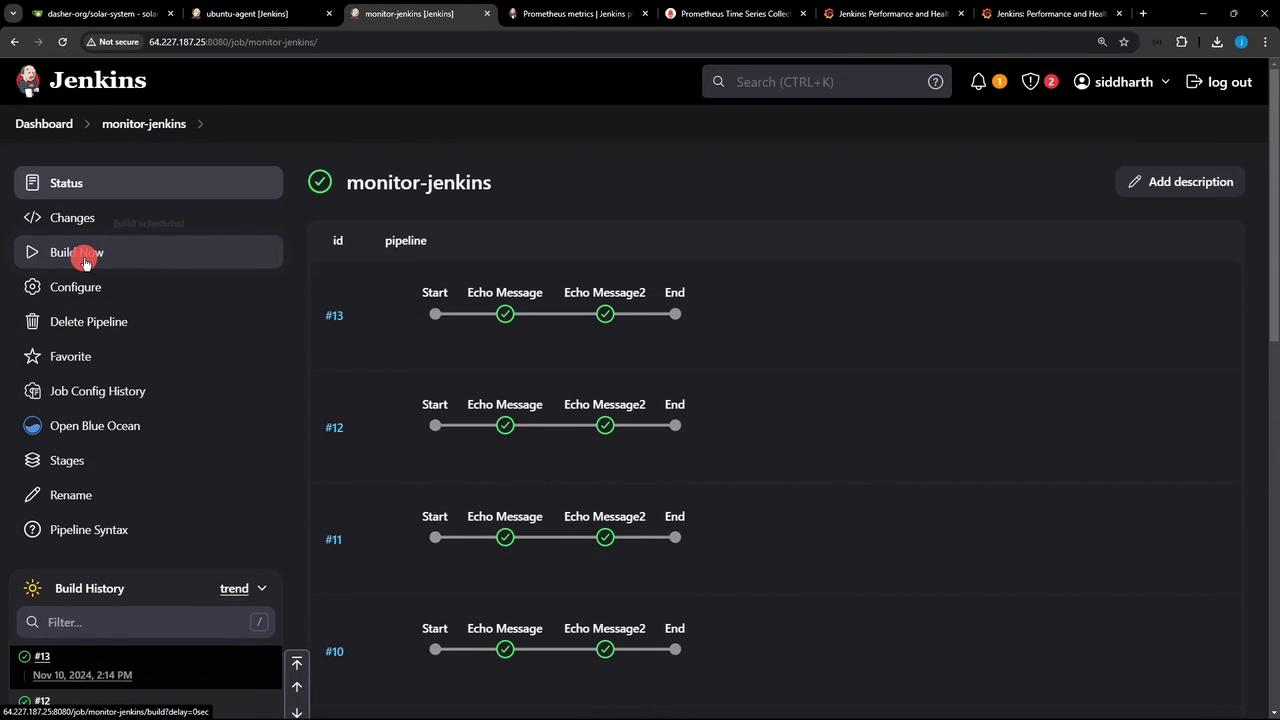
4. Save and click **Build Now** 10–20 times to generate metrics.

***

## 6. Customize Grafana Panels & Observe Metrics

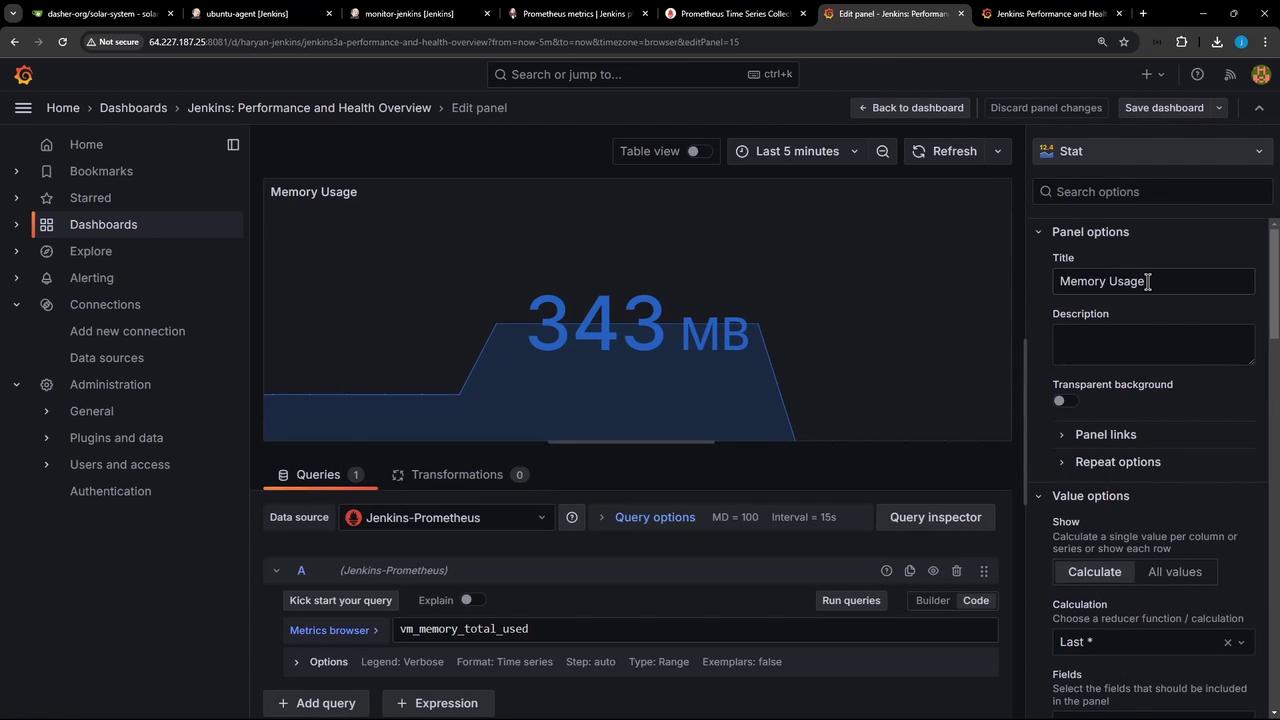
You can tailor any panel—switch from time series to gauge, adjust thresholds, and more:
<Frame>
  ![The image shows a Jenkins dashboard displaying memory usage, with a graph indicating 343 MB of memory used. The interface includes options for editing the panel and configuring queries.](https://kodekloud.com/kk-media/image/upload/v1752870722/notes-assets/images/Certified-Jenkins-Engineer-Demo-Monitoring-with-Prometheus-Grafana/jenkins-dashboard-memory-usage-graph.jpg)
</Frame>

After a few builds, refresh your dashboard:
<Frame>
  ![The image shows a Jenkins performance and health overview dashboard with various metrics such as processing speed, memory usage, CPU usage, and job statistics.](https://kodekloud.com/kk-media/image/upload/v1752870723/notes-assets/images/Certified-Jenkins-Engineer-Demo-Monitoring-with-Prometheus-Grafana/jenkins-performance-health-dashboard-2.jpg)
</Frame>

Finally, monitor pipeline status in Jenkins:
<Frame>
  ![The image shows a Jenkins dashboard with a pipeline named "monitor-jenkins," displaying the status of several builds with stages like "Start," "Echo Message," and "End." The sidebar includes options like "Build Now," "Configure," and "Delete Pipeline."](https://kodekloud.com/kk-media/image/upload/v1752870724/notes-assets/images/Certified-Jenkins-Engineer-Demo-Monitoring-with-Prometheus-Grafana/jenkins-dashboard-monitor-pipeline.jpg)
</Frame>

***

## Conclusion

By following these steps—installing the Prometheus Metrics Plugin, deploying Prometheus/Grafana, scraping Jenkins metrics, and importing a dashboard—you can achieve comprehensive real-time monitoring of your Jenkins environment. Customize scrape intervals, panel types, and alert rules to suit production requirements. Happy monitoring!

## Links and References

* [Jenkins Prometheus Metrics Plugin](https://plugins.jenkins.io/prometheus/)
* [Prometheus Documentation](https://prometheus.io/docs/)
* [Grafana Documentation](https://grafana.com/docs/)
* [Docker Compose Overview](https://docs.docker.com/compose/)

<CardGroup>
  <Card title="Watch Video" icon="video" cta="Learn more" href="https://learn.kodekloud.com/user/courses/certified-jenkins-engineer/module/90da5b24-e8f2-455a-9756-9d69f4a7ce8e/lesson/5ec33f6e-d5ef-4228-958c-6aba6974dfe3" />
</CardGroup>
