> ## Documentation Index
> Fetch the complete documentation index at: https://notes.kodekloud.com/llms.txt
> Use this file to discover all available pages before exploring further.
# Lab Solution Monitor Cluster Components
> Deploying Kubernetes Metrics Server and using kubectl top to monitor node and pod CPU and memory usage, identifying the highest resource consumers
In this lesson you'll deploy the Kubernetes Metrics Server and use `kubectl top` to monitor CPU and memory usage for nodes and pods. The lab environment already runs three application pods: `elephant`, `lion`, and `rabbit`.
## Verify running pods
Start by listing the pods in the cluster. You should see the three workload pods in `Running` state:
```bash theme={null}
root@controlplane:~# kubectl get pods
NAME READY STATUS RESTARTS AGE
elephant 1/1 Running 0 27s
lion 1/1 Running 0 27s
rabbit 1/1 Running 0 27s
```
## Clone the prepared Metrics Server repository
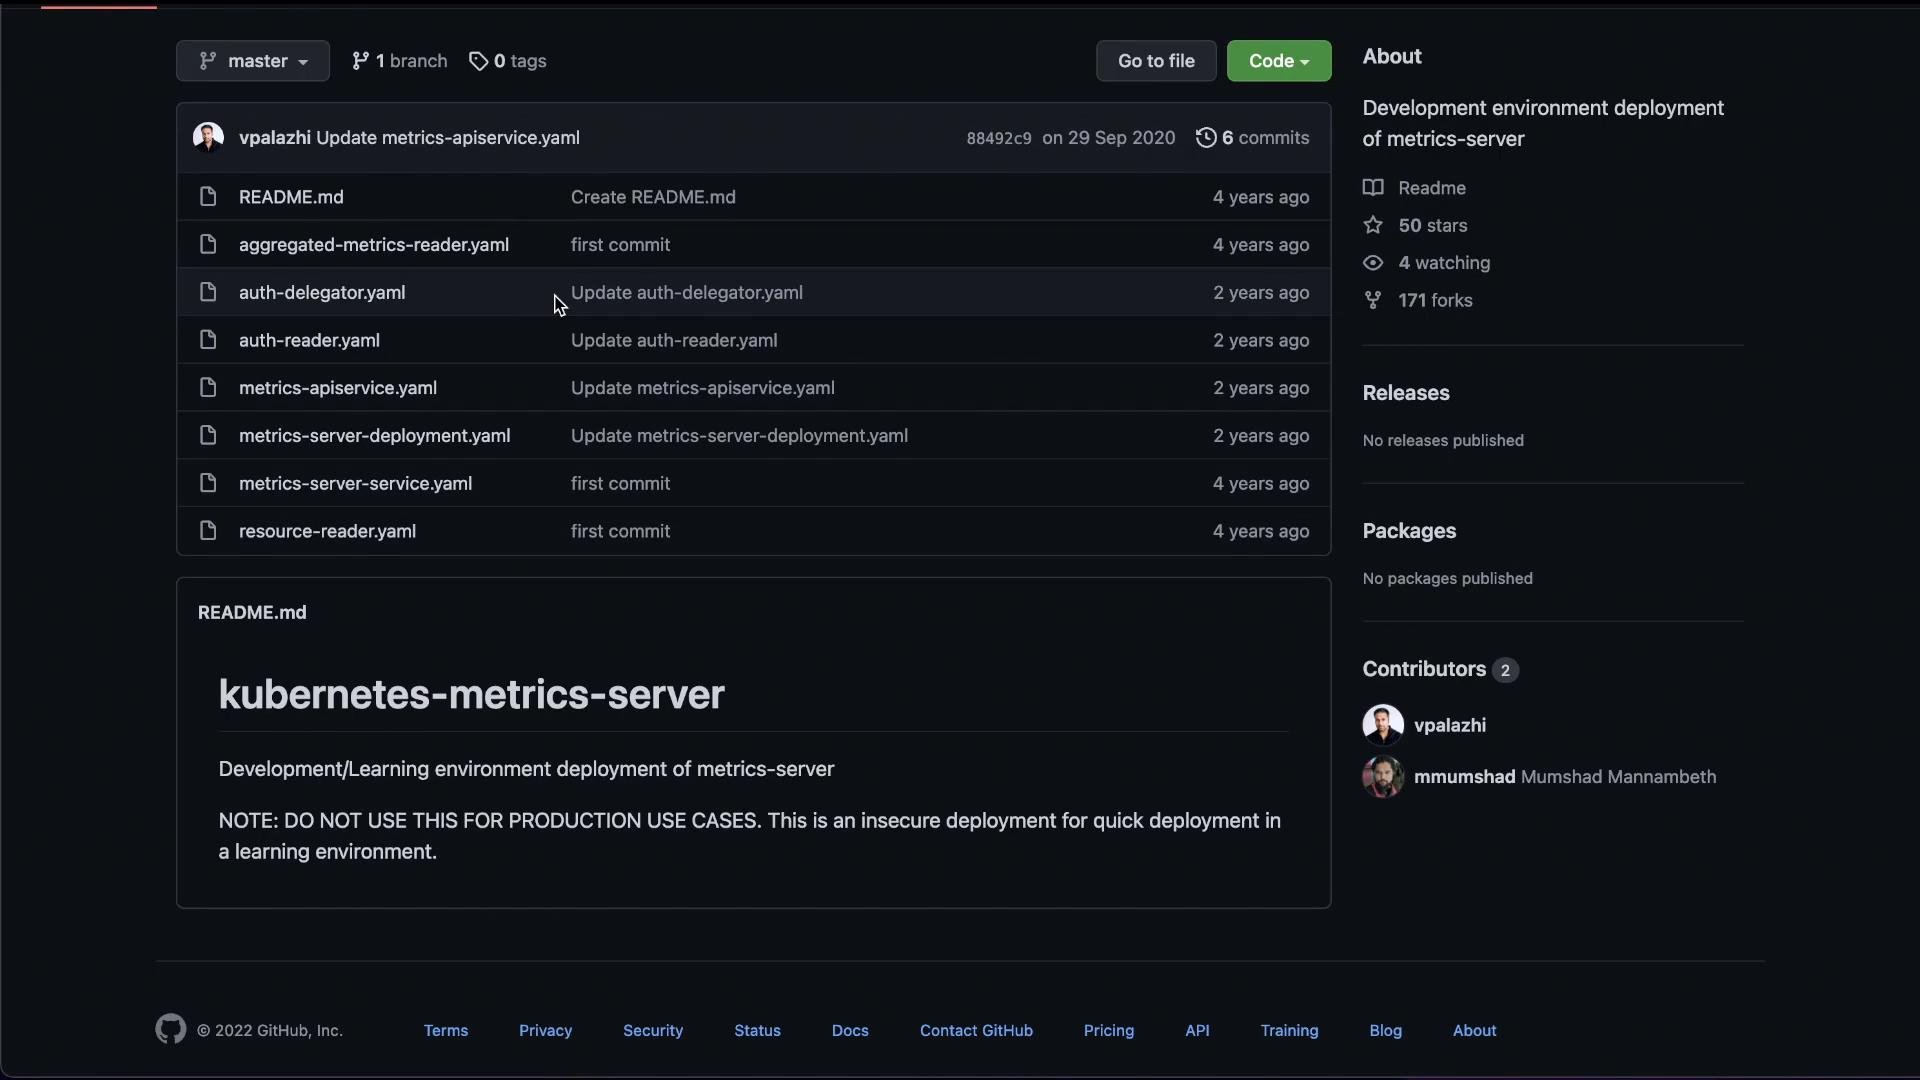
This lab supplies a test repository with manifests tailored for the exercise. Clone it to the control plane and inspect the files:
```bash theme={null}
root@controlplane:~# git clone https://github.com/kodekloudhub/kubernetes-metrics-server.git
Cloning into 'kubernetes-metrics-server'...
remote: Enumerating objects: 24, done.
remote: Counting objects: 100% (12/12), done.
remote: Compressing objects: 100% (12/12), done.
remote: Total 24 (delta 4), reused 0 (delta 0), pack-reused 12
Unpacking objects: 100% (24/24), done.
root@controlplane:~#
```
Do not use the lab repository directly in production. The manifests may be simplified or modified for the lab environment. For production deployments, follow the official Metrics Server documentation: [https://github.com/kubernetes-sigs/metrics-server](https://github.com/kubernetes-sigs/metrics-server)
 ## Deploy the Metrics Server manifests
From the cloned repository directory, create the required resources to install the Metrics Server:
```bash theme={null}
root@controlplane:~/kubernetes-metrics-server# kubectl create -f .
```
The Metrics Server may take a short while to become ready and start publishing metrics to the Metrics API. Wait a minute, then use `kubectl top` to query node and pod metrics.
## Use kubectl top to view resource usage
Once the Metrics Server is collecting metrics, `kubectl top` reports CPU and memory usage for nodes and pods.
Example output for nodes:
```bash theme={null}
root@controlplane:~/kubernetes-metrics-server# kubectl top node
NAME CPU(cores) CPU% MEMORY(bytes) MEMORY%
controlplane 470m 1% 1252Mi 0%
node01 57m 0% 349Mi 0%
```
Example output for pods:
```bash theme={null}
root@controlplane:~/kubernetes-metrics-server# kubectl top pod
NAME CPU(cores) MEMORY(bytes)
elephant 20m 32Mi
lion 1m 18Mi
rabbit 131m 252Mi
```
## Interpretation — identify heavy resource consumers
Use the `kubectl top` results to answer common monitoring questions. The primary consumers in this example are:
| Resource Type | Observed Metrics |
| - | - |
| Nodes | `controlplane` — CPU: `470m`, Memory: `1252Mi`; `node01` — CPU: `57m`, Memory: `349Mi` |
| Pods | `rabbit` — Memory: `252Mi`; `elephant` — Memory: `32Mi`; `lion` — Memory: `18Mi` |
And the direct answers to the lab questions:
| Question | Answer |
| - | - |
| Which node consumes the most CPU? | `controlplane` (`470m` vs `57m` on `node01`) |
| Which node consumes the most memory? | `controlplane` (`1252Mi` vs `349Mi` on `node01`) |
| Which pod consumes the most memory? | `rabbit` (`252Mi`) |
| Which pod consumes the least CPU? | `lion` (`1m`) |
## Links and references
* Metrics Server GitHub repository: [https://github.com/kubernetes-sigs/metrics-server](https://github.com/kubernetes-sigs/metrics-server)
* kubectl documentation: [https://kubernetes.io/docs/reference/generated/kubectl/kubectl-commands#top](https://kubernetes.io/docs/reference/generated/kubectl/kubectl-commands#top)
That completes the lab: you deployed the Metrics Server and used `kubectl top` to identify nodes and pods that consume the most resources.
This documentation is built and hosted on [Mintlify](https://mintlify.com), a developer documentation platform.
## Deploy the Metrics Server manifests
From the cloned repository directory, create the required resources to install the Metrics Server:
```bash theme={null}
root@controlplane:~/kubernetes-metrics-server# kubectl create -f .
```
The Metrics Server may take a short while to become ready and start publishing metrics to the Metrics API. Wait a minute, then use `kubectl top` to query node and pod metrics.
## Use kubectl top to view resource usage
Once the Metrics Server is collecting metrics, `kubectl top` reports CPU and memory usage for nodes and pods.
Example output for nodes:
```bash theme={null}
root@controlplane:~/kubernetes-metrics-server# kubectl top node
NAME CPU(cores) CPU% MEMORY(bytes) MEMORY%
controlplane 470m 1% 1252Mi 0%
node01 57m 0% 349Mi 0%
```
Example output for pods:
```bash theme={null}
root@controlplane:~/kubernetes-metrics-server# kubectl top pod
NAME CPU(cores) MEMORY(bytes)
elephant 20m 32Mi
lion 1m 18Mi
rabbit 131m 252Mi
```
## Interpretation — identify heavy resource consumers
Use the `kubectl top` results to answer common monitoring questions. The primary consumers in this example are:
| Resource Type | Observed Metrics |
| - | - |
| Nodes | `controlplane` — CPU: `470m`, Memory: `1252Mi`; `node01` — CPU: `57m`, Memory: `349Mi` |
| Pods | `rabbit` — Memory: `252Mi`; `elephant` — Memory: `32Mi`; `lion` — Memory: `18Mi` |
And the direct answers to the lab questions:
| Question | Answer |
| - | - |
| Which node consumes the most CPU? | `controlplane` (`470m` vs `57m` on `node01`) |
| Which node consumes the most memory? | `controlplane` (`1252Mi` vs `349Mi` on `node01`) |
| Which pod consumes the most memory? | `rabbit` (`252Mi`) |
| Which pod consumes the least CPU? | `lion` (`1m`) |
## Links and references
* Metrics Server GitHub repository: [https://github.com/kubernetes-sigs/metrics-server](https://github.com/kubernetes-sigs/metrics-server)
* kubectl documentation: [https://kubernetes.io/docs/reference/generated/kubectl/kubectl-commands#top](https://kubernetes.io/docs/reference/generated/kubectl/kubectl-commands#top)
That completes the lab: you deployed the Metrics Server and used `kubectl top` to identify nodes and pods that consume the most resources.
This documentation is built and hosted on [Mintlify](https://mintlify.com), a developer documentation platform.