> ## Documentation Index
> Fetch the complete documentation index at: https://notes.kodekloud.com/llms.txt
> Use this file to discover all available pages before exploring further.
# Application Failure
> This article provides a guide on troubleshooting application failures in a two-tier architecture, focusing on systematic techniques and practical scenarios.
Welcome to this comprehensive guide on troubleshooting application failures. In this article, we review systematic troubleshooting techniques and provide practical scenarios to help you diagnose and resolve issues in a two-tier application architecture.
## Overview
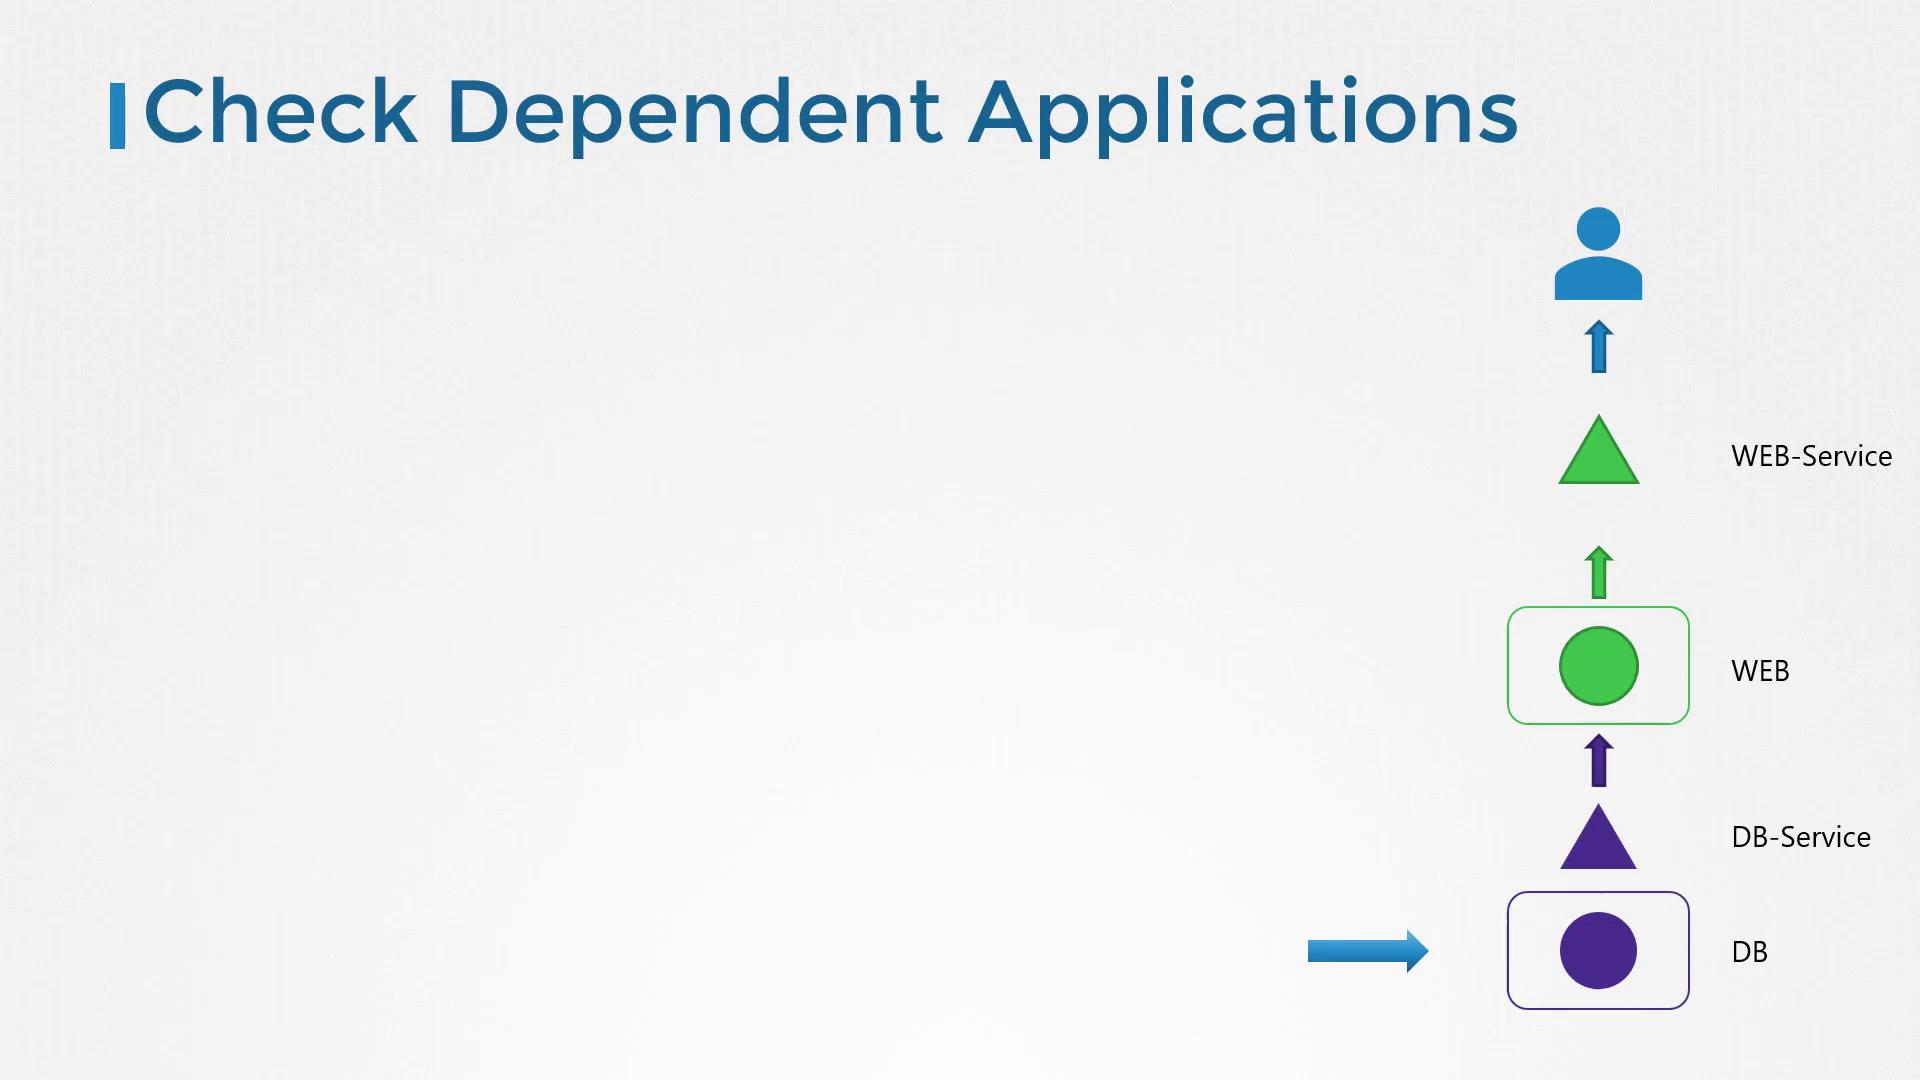
Consider a two-tier application consisting of a web server and a database server. The database pod hosts a database application and serves data to the web servers via a database service. Meanwhile, the web server, running on a separate pod, delivers content to the users through a web service.
Before you begin troubleshooting, document your application's configuration by creating a system map or listing all components and their connections. This documentation can be a valuable reference when determining where to start your investigation.
## Troubleshooting the Web Application
When users report issues accessing your application, start by testing the application’s front end. For example, if your application is web-based, verify the accessibility of the web server using a tool like curl on the service's IP address and node port:
```bash theme={null}
curl http://web-service-ip:node-port
curl: (7) Failed to connect to web-service-ip port node-port: Connection timed out
```
### Validate Service Endpoints
Ensure that the web service has correctly discovered endpoints for the web pod. A common issue is a mismatch between the selectors defined on the service and those on the pod.
View the service details with:
```bash theme={null}
bash
kubectl describe service web-service
```
You should see output similar to the following:
```bash theme={null}
Name: web-service
Namespace: default
Labels:
Annotations:
Selector: name=webapp-mysql
Type: NodePort
IP: 10.96.0.156
Port: 8080/TCP
TargetPort: 8080/TCP
NodePort: 31672/TCP
Endpoints: 10.32.0.6:8080
Session Affinity: None
External Traffic Policy: Cluster
Events:
```
### Verify Pod Configuration
Review the web application's pod definition to ensure it is correctly configured and running:
```yaml theme={null}
apiVersion: v1
kind: Pod
metadata:
name: webapp-mysql
labels:
app: example-app
name: webapp-mysql
spec:
containers:
- name: webapp-mysql
image: simple-webapp-mysql
ports:
- containerPort: 8080
```
Next, check the pod status. A stable pod typically shows a running status with minimal restarts:
```bash theme={null}
bash
kubectl get pod
```
Example output:
```text theme={null}
NAME READY STATUS RESTARTS AGE
Web 1/1 Running 5 50m
```
For a more detailed inspection, including event logs, use:
```bash theme={null}
bash
kubectl describe pod web
```
This command may display events like:
```text theme={null}
...
Events:
Type Reason Age From Message
---- ------ ---- ---- -------
Normal Scheduled 52m default-scheduler Successfully assigned webapp-mysql to worker-1
Normal Pulling 52m kubelet, worker-1 pulling image "simple-webapp-mysql"
Normal Pulled 52m kubelet, worker-1 Successfully pulled image "simple-webapp-mysql"
Normal Created 52m kubelet, worker-1 Created container
Normal Started 52m kubelet, worker-1 Started container
```
### Review Application Logs
Examine the application logs with:
```bash theme={null}
bash
kubectl logs web
```
Expected output might look like this:
```text theme={null}
10.32.0.1 - - [01/Apr/2019 12:51:55] "GET / HTTP/1.1" 200 -
10.32.0.1 - - [01/Apr/2019 12:51:55] "GET /static/img/success.jpg HTTP/1.1" 200 -
10.32.0.1 - - [01/Apr/2019 12:51:55] "GET /favicon.ico HTTP/1.1" 404 -
10.32.0.1 - - [01/Apr/2019 12:51:57] "GET / HTTP/1.1" 200 -
10.32.0.1 - - [01/Apr/2019 12:51:58] "GET / HTTP/1.1" 200 -
10.32.0.1 - - [01/Apr/2019 12:51:58] "GET / HTTP/1.1" 200 -
```
If these logs do not shed light on a recent failure, continuously stream the logs to capture real-time activity:
```bash theme={null}
bash
kubectl logs web -f
```
## Troubleshooting the Database Service
Apply a similar approach to verify the status of the database (DB) service. Examine the following:
* Inspect the DB service details.
* Confirm that endpoints are configured correctly.
* Check the DB pod's status.
* Review the database logs for errors that might signal issues within the database.
Ensure that both the web and DB services have matching selectors for their respective pods. Mismatches in labels can lead to missing endpoints and connectivity issues.
## Visualizing the Dependency Chain
The diagram below illustrates the troubleshooting flow for dependent applications. It outlines the sequence from the database (DB) to the web service (WEB-Service), including both the DB-Service and WEB components:
## Additional Resources
For further troubleshooting guidance and best practices, refer to the following resources:
* [Kubernetes Documentation](https://kubernetes.io/docs/tasks/debug-application-cluster/troubleshoot-application/)
* [Kubernetes Basics](https://kubernetes.io/docs/concepts/overview/what-is-kubernetes/)
## Final Tip
Use the command below to obtain detailed information about any pod. Replace \${POD_NAME} with the actual pod name.
```bash theme={null}
kubectl describe pods ${POD_NAME}
```
By following these steps, you can effectively troubleshoot and resolve application failures in your Kubernetes environment while ensuring a systematic approach that covers both the service and pod components.